
After inserting the COUNTIF function, the total number of tweets in English was 52,680. The total number of tweets was 53,564, therefore the percentage of tweets in English is roughly 98.8%.
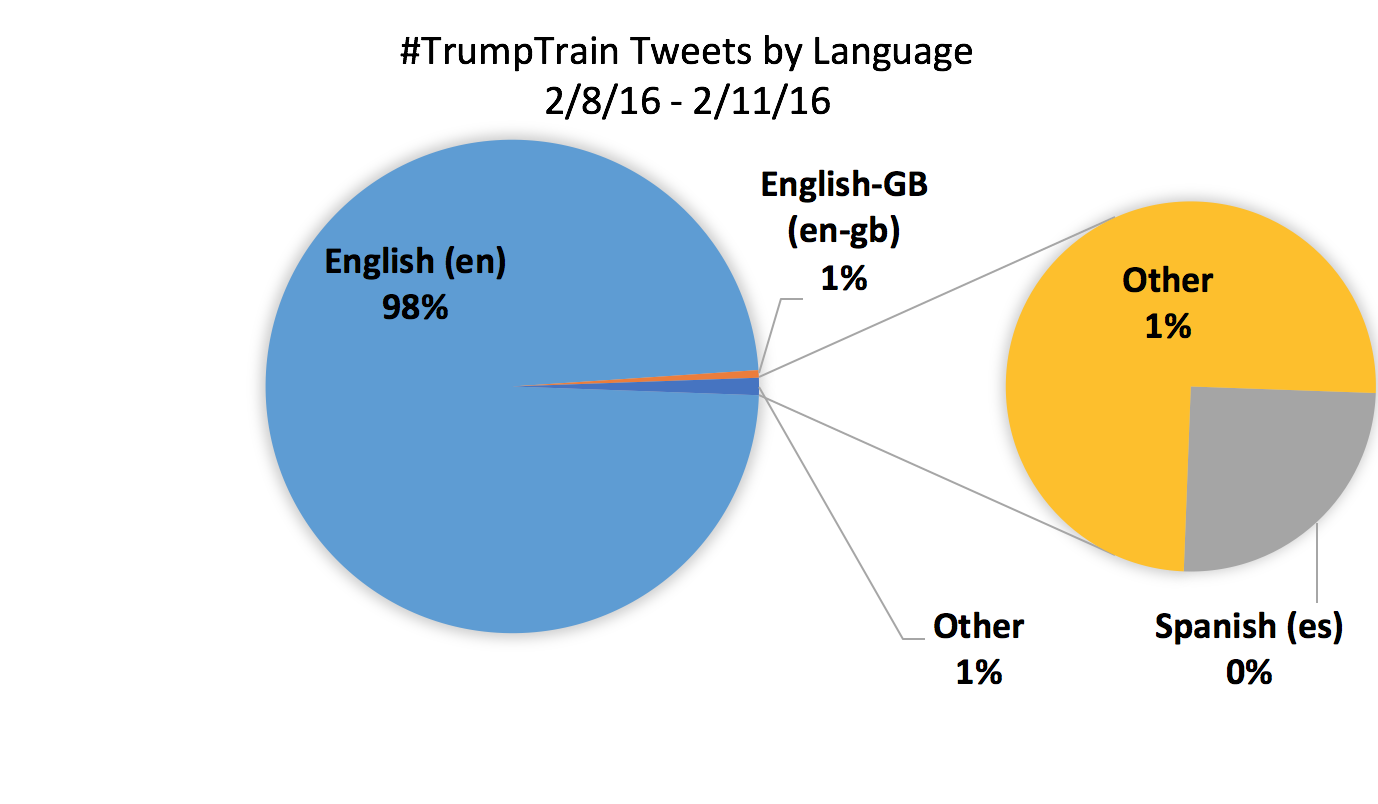
I was not surprised at all by the extremely large number of tweets in the English language. This number is in direct relation to the context of #TrumpTrain. This hashtag is focused around the presidential race in the United States of America where English is the most common language being spoken. There is a very small amount of people from other nations who speak different languages who would be tuned in and actively discussing this event. I found it valuable to create this type of pie chart to emphasize how small the remaining 1.2% actually is. There are 24 other languages which were clumped together under the “other” category and I found this type of pie chart an excellent way to express the shocking nature of this data. Within the “Other” category, the languages represented are: Arabic, Czech, German, Finnish, French, Hebrew, Hindi, Hungarian, Indonesian, Italian, Japanese, Korean, Dutch, Norwegian, Polish, Portuguese, Russian, Swedish, Thai, Turkish, Ukrainian, Chinese (mainland), and finally, Chinese (Taiwan).
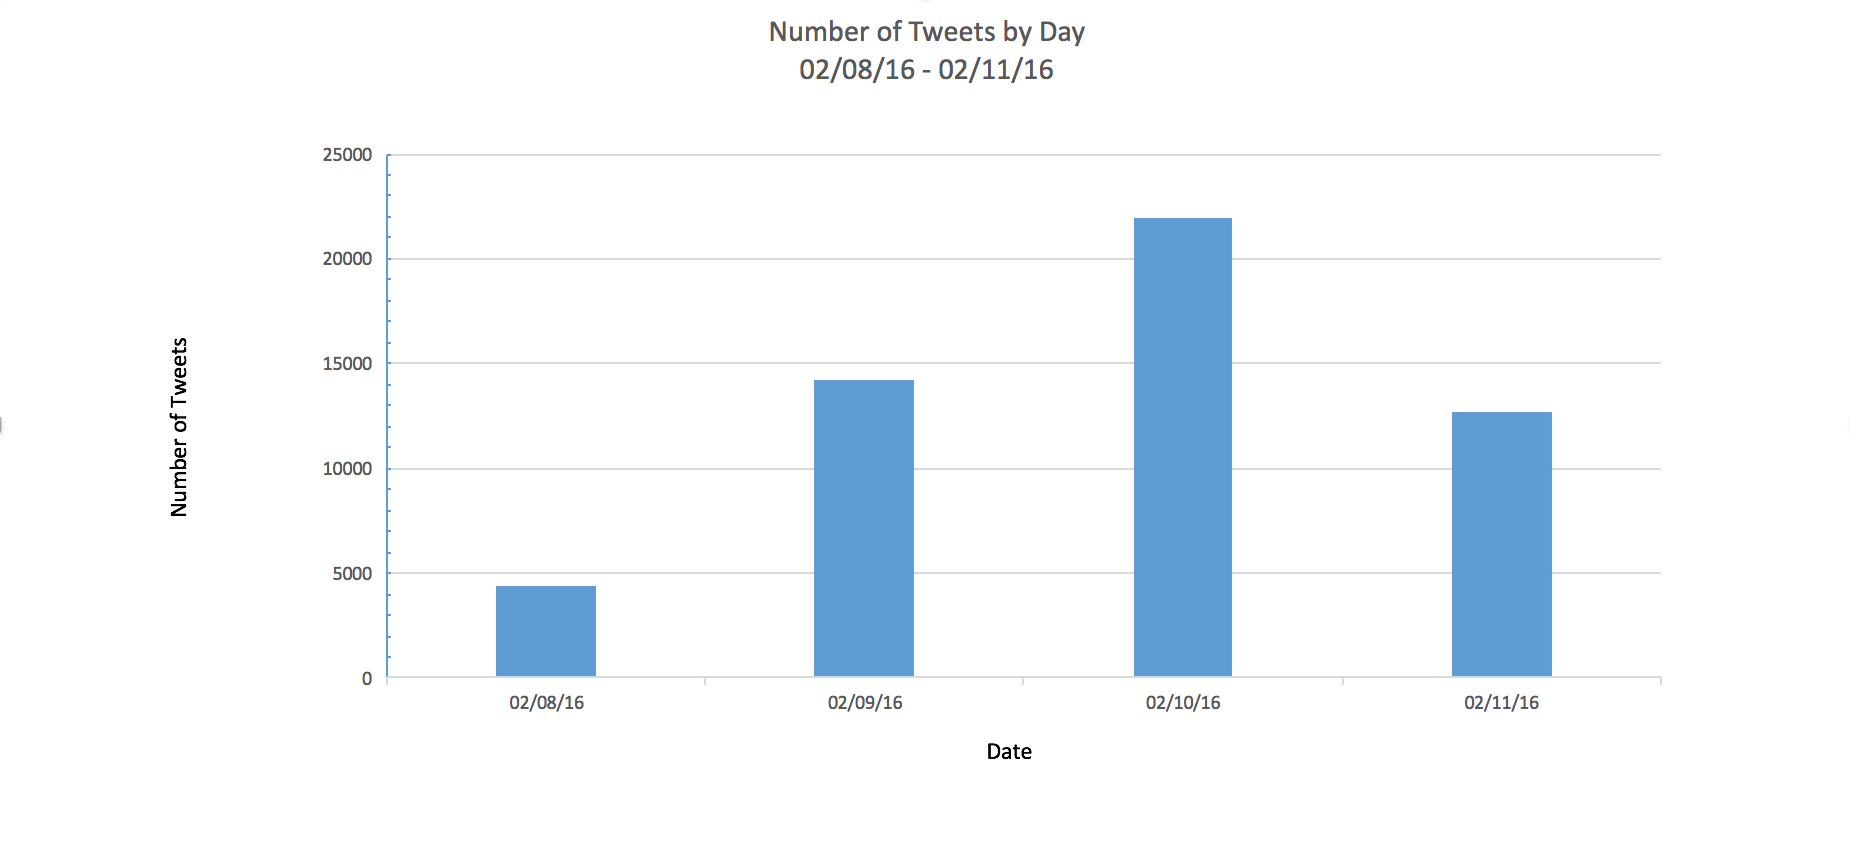
Although there are only four dates to choose from, I decided to go ahead and graph them with a little bit of knowledge as to the drastic increase in numbers on the 9th and 10th of February. I know there was a primary around this time and would not at all be surprised to see that it occurred on either the 9th or the 10th. Throughout this entire project I have found there to be an extreme influx in tweet numbers when there is a a primary or debate. These events clearly spark the interest of citizens who take to Twitter to express their beliefs and rally others around their candidate of choice.
Just as I had expected, on February 9th, the New Hampshire Primary took place which was one of the most important and influential primaries in the country. This is undoubtedly a reason for such a drastic increase on the day of the primary, as well as the following day where there was much discussion and delight for the winning candidate. I think that the following day #TrumpTrain was used in excess because Donald Trump won the primary. Since this hashtag is most often used in support of this candidate, it is not surprising at all as to why there were nearly five times as many tweets as their were on February 8th. According to a New York Times article, “Mr. Trump, the wealthy businessman whose blunt language and outsider image have electrified many Republicans . . . also tapped into a deep well of anxiety among Republicans and independents in New Hampshire, according to exit polling data, and he ran strongest among voters who were worried about illegal immigrants, incipient economic turmoil and the threat of a terrorist attack in the United States” (New York Times, 2016.) This further proves how the support for Donald Trump was at a high point following the primary as well as explaining the characteristics his followers believe in. I want to include this final quote simply as a way to express the type of candidate Donald Trump truly is, “‘I am going to be the greatest jobs president that God ever created,’ vowed Mr. Trump, adding that he would ‘knock the hell out of ISIS,’ or the Islamic State” (New York Times, 2016.)
In looking specifically at my own data, my number of tweets per day was definitely on the higher end of in comparison to the class data, in fact it was the highest. I personally collected roughly 13,391 tweets per day while the class mean was approximately 2,893 per day. The median was approximate 746 tweets per day. What this means is the data was skewed to the right as the data lower than the median were closer to the median than those that were higher. My data, along with #MakeAmericaGreatAgain were certainly outliers as they were roughly 11,000 more data points than the class mean. Unfortunately, the mode was unable to be calculated because no one had the exact same amount. I think it would have been extremely interesting if there was a mode to see how those two topics were interconnected. I have found it fascinating after reading Tarleton Gillespie’s article, “Can Algorithm Be Wrong?” by how much Twitter and other media outlets can control and regulate material we can see and analyze. One clear example from the reading where this happens is with reference to #occupywallstreet. Gillespie states, “. . . when tweets using the term #occupywallstreet seem to spike, the term did not Trend. Some suggested that Twitter was deliberately dropping the term from its list, and in doing so, preventing it from reaching a wider audience” (The Atlantic, 2012.) It really makes me wonder how much material and data is censored. The presidential candidates use social media as an enormous platform to gain support. Would it be possible for Twitter to single-handily censor tweets and determine who gains support in important elections? This is a very real possibility and we must be aware that this could in fact happen. The access to data is incredibly limited and it is of utmost importance to fully understand that this occurs.
I thought that it was really incredible how varied the class data was in total. My data on the class spreadsheet is limited as it was only four days out of my total data set because of of capacity overload on my GoogleSheet and the time it took me to export the files. Throughout this entire project I have constantly been collecting data. On my Google spread sheet I hit a total of 117,000 tweets before it would refuse to collect more. This is a clear example of how popular the presidential election is to talk about on social media. I really was not surprised to see that this was the case because there is constant attention on the presidential race, especially during the four days I selected to examine. I think that this means my hashtag is being tweeted and retweeted constantly, most often in support for Donald Trump. Further, there #MakeAmericaGreatAgain was only 1,000 tweets behind per day. These two numbers, when examined in conjunction point to the fact that Donald Trump has an extreme media presence and is being discussed constantly. it makes me wonder if he has intended this to happen and is using it to gain support and momentum throughout his campaign. Unfortunately, at the time of this writing the data for #FeelTheBern was not uploaded to the class data GoogleDoc. I think it would be fascinating to compare this hashtag in support for Bernie Sanders with those in support of Donald Trump. This may allow for a greater understanding of social media and how candidates use it to their advantage.
The only thing that this class data reveals to me is how popular and seemingly unlimited my data truly was. I wish that I could have used all of my data for this portion of lab because I think that more days of collection, and more data in total would have allowed me to analyze #TrumpTrain more extensively. Before this lab I never realized how much data I had actually collected and now knowing this and looking back I wish I had taken more time to find a way to extract all of my data from the GoogleSheet. This would have allowed me to examine it further and make a hypothesis with more certainty and a more positive outlook as I drew conclusions.
______________________________________________________________________________________________________
Healy, Patrick, and Jonathan Martin. “Donald Trump and Bernie Sanders Win in New Hampshire Primary.” The New York Times. February 09, 2016. http://www.nytimes.com/2016/02/10/us/politics/new-hampshire-primary.html.
Once again, I think you did a great job in analyzing your hashtag trend and applying it to current events. First off, your use of the New York Times article was a very effective way to establish reasoning behind the spike in tweets for certain days, as well as for the spike in Trump followers in general. Thus, I think one thing which sets your posts apart from others is that you not only look at your trend on social media level, but you also apply it to a broader spectrum of global politics and society. I enjoyed reading you analysis of the Gillespie reading, and I personally touched on the same points that you did in my blog post. I completely agree with you, and Gillespie, that there is a degree of censorship that has an effect on the ability of hashtags such as #occupywallstreet, #trumptrain, or #fightfor15 to trend. Ultimately, I thought that this was one of your best posts yet and I look forward to following the #trumptrain trend as we approach this year’s presidential election.
I appreciate the design of your pie graph in closely examining the “other” language category for #TrumpTrain tweets. With the overwhelming number of English tweets, the percentage of “other” languages tend to get lost in visualization. Both of your graphs are well labeled and suggest some interesting trends. It would be interesting to compare your twitter data from 2/9/16 with the data collected and visualized for #makeamericagreatagain on that same date. I wonder if the two terms are used in conjunction? Why do would some choose to use #TrumpTrain and others #makeamericagreatagain? I also wonder if there were any contributing factors to the far fewer number of tweets on 2/8/16? It is apparent that a spike in usage is directly impacted by major political events, but what does the dip in usage suggest? Was there news of a different nature occupying the interest of Twitter users on this day, or can it simply be attributed to little political action?
I would have liked to compare my own data for #FeeltheBern to this dataset in thinking about Twitter censorship. Does on candidate or party hold a profound advantage over the other on Twitter? If so, could this be a result of what Gillespie discusses in “Can an Algorithm Be Wrong?”? I wish I had thought about the two hashtags in relation to the article. Perhaps my own data is skewed by Twitter, either in support or rebellion of Bernie Sanders and/or the Democratic Party.
My hashtag, #makeamericagreatagain, is very similar to yours in almost every aspect of this post. We had nearly the same spread out of languages, with English dominating. We also had a huge amount of tweets in just a few days. The similarities are everywhere. In my opinion, the best part of the post is the pie graph. I really like how you looked into the 1% to see how that was divided. I also had a bunch of languages that made up less than 1%. My data is also similar to yours, in that when there is a debate or primary there is a huge spike in the number of tweets. I could only collect for a few days before I was over 100,000 tweets and google started to fail. One of the days in my data, and yours, was a primary. There was a massive jump in the number of tweets. I chose to look at the day of the primary hour by hour. It was interesting to see that one day compared to the days around it like you did. One question I have that I brought up in my post and also relates to your post is: do you think all the tweets came from the specific languages? Or do you think the algorithm read the tweet wrong and assigned the wrong language? Some of the languages of the tweets in my data seemed to be a strange language to tweet #makeamericagreatagain from.