
I expect to see quite an even distribution among the weekdays of February 6 to February 10.
With Voyant, 606,184 total words and 42,080 unique word forms. Tuesday, February 7 had the longest tweets, and Friday, February 10 had the shortest. Maybe people were feeling lazier towards the end of the week… The vocabulary density, oddly enough, was the exact opposite, with Friday having the highest vocabulary density and Tuesday having the lowest.
Some words obscuring my lens that made it through the stoplist are “climatechange_”, “_”, “it’s”, “http_”, “t_”, “ht_”, “h_”, “t.co_”, “https_” and “___”. I notice a lot of underscores that make their way into my data, so I will remove those.
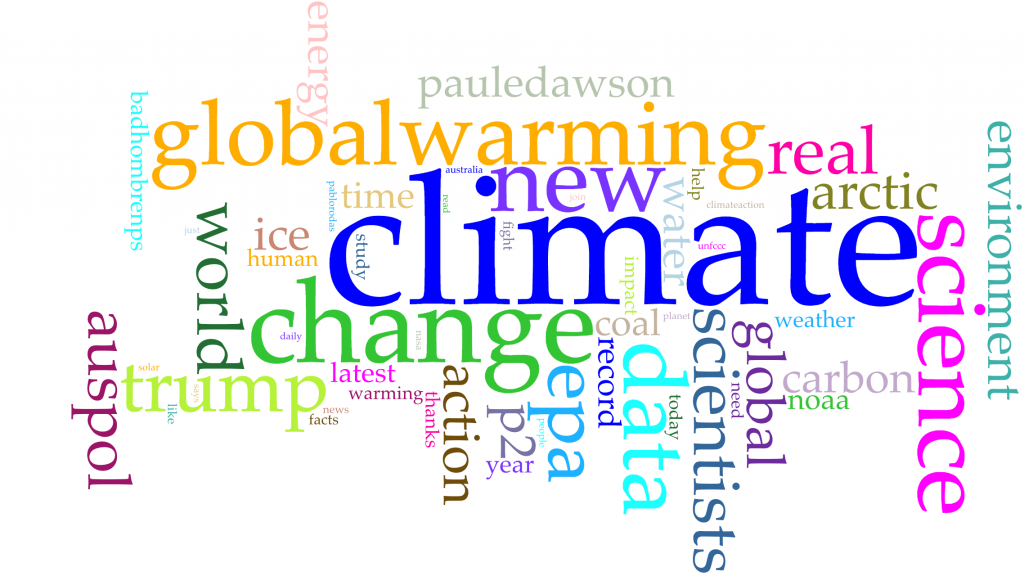
Some of the words that were most used were surprising, but most were related to climate change and climate-related events, such as “science”, “environment”, “coal”, “globalwarming”, “solar”, “carbon”, “energy”, etc. Some of the terms that were surprising were “pauledawson”, “auspol”, and “unfccc”. This cloud suggests words that are obviously relating to climate change. The word cloud, if anything, further confirms what I expected to find from tweets about climate change, so I am not surprised.
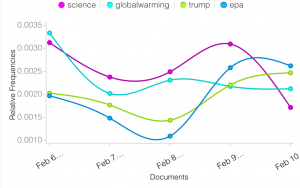
Four of the word trends I followed from February 6 to February 10 were “science”, “globalwarming”, “trump”, and “epa”. I chose these words because they are frequently related to climate change, and by tracking when they were more frequently used, I can better understand what #climatechange tweets were talking about. As shown above, it seems as though tweets about climate change were consistent with the terms “science” and “globalwarming” throughout the week. A different trend seemed to occur with the terms “trump” and “epa”, but their frequencies rose very similarly. President Trump must have laid low on Wednesday (February 8), but on Thursday, both “trump” and “epa” were more tweeted with #climatechange. After looking into what happened that day, I discovered that many media outlets said President Trump’s budget plan would increase military spending and cut EPA spending, which is likely the reason those terms were more frequently tweeted about in conjunction with #climatechange.
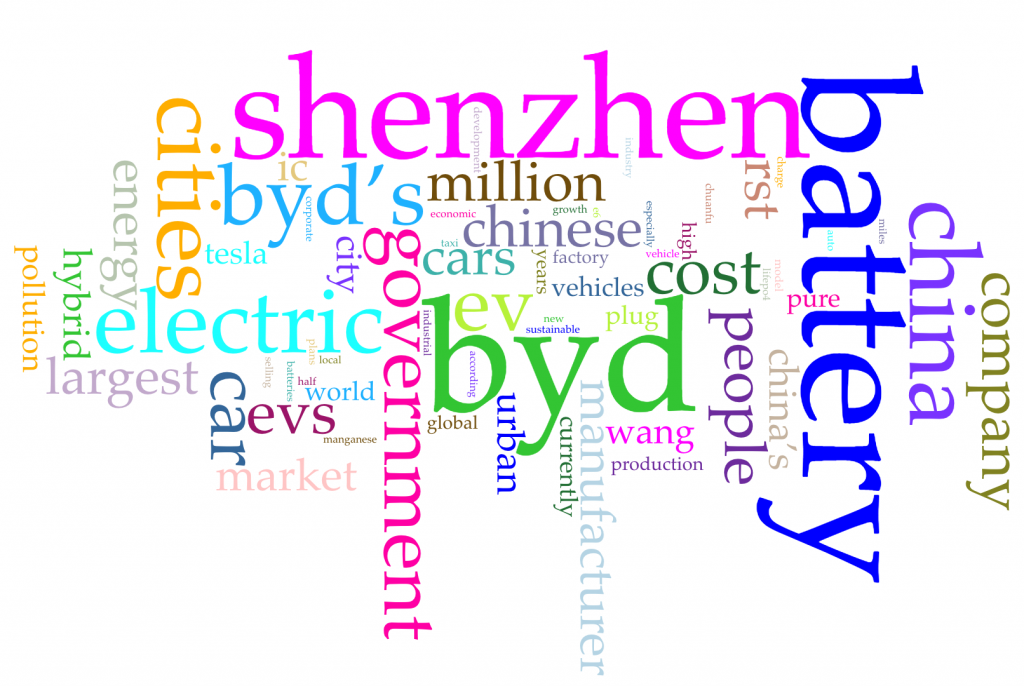
The document I chose to track on Voyant was an article I published last year on climate change in Shenzhen, China. I chose it because it is interesting to see words you wrote yourself and how repetitive you are/what trends there are over a long piece of text. I really did not need to add any stopwords in this case, since the stopwords I added to my tweets were mostly Twitter-related and dealt with annoying underscores or links.
In this case, with the article, the word cloud is quite different, as it deals more with China and the solution-side of climate change, rather than the problem awareness-side that is more common on Twitter. In other words, the article is more cornucopian, and the tweets are more environmental. It does not help, per se, in better reading my Twitter data, but it does offer an interesting two-part view on climate change.
Nathan Yau gives a more convincing argument on data visualization that is more convincing than Edward Tufte’s approach, which says the best data is incredibly accurate and telling. I think Yau’s approach is better and more explanatory of my data because he says the data is just an abstraction of real life, which is complicated. This is true of my data, since I am pulling it from Twitter, and obviously not everyone tweets. For example, I talk about climate change a lot, but I almost never tweet about climate change. He also says if you get a large enough dataset and a lot of context, you can at least try to make sense of it, as is true for me if I gathered enough data from Twitter and used that as a relative context.
It’s interesting to see how your hashtag can be applied in many different conversations among twitter and really encompass the many different facets of the broad topic of #climatechange to tell a more american story about what constitutes that topic, for example how “trump” and “epa” share similar trends over time. You also further illustrate that #climatechange can have a very different meaning related to your article about climate change in Shenzhen, China versus the more environmental and problem-awareness meaning you find your hashtag associated with in your twitter data. I think analyzing the different conversations and their meanings that contribute to the topic of climate change offers tremendous insight into how this topic is defined, evolves and ultimately influences the public opinions related to #keystoneXL.
Dude!! What a great contextual find!! The shift in climate change related hashtags and Trump/epa is so cool to see. In my standing rock voylant, I also saw a similar daily trend and did some outside research to contextualize my most found words. I also like your comment about how the article you wrote last year deals with solution rather than simply problem aware-ness. If only there was a way to apply that dichotomy to your tweets! Additionally, I enjoyed your visualization of #climatechange – it is remarkable to see all the different international locations where climate change was referenced.