
PART I
I chose the most recent 3,000 tweets because we haven’t reviewed or analyzed any of the twitter data that has been collected in the past three weeks, so this way I can visualize what has been happening in the realm of #KeystoneXL. I expect that the extraction of the twitter data collected will organize the different users into relationships that are based on the different conversations they have.
The total number of new rows after the data had been converted in python was 3,911. While there are some in the left column, there are some blank, revealing that the user tweeted not specifically at another person or retweeted them.
PART II
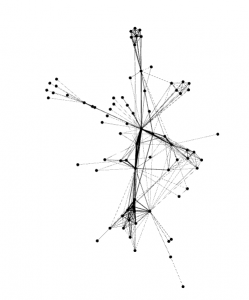
There are 77 nodes and 254 edges. A directed graph would give a more accurate representation of the different relationships that are going on within our data. By only illustrating the mutual relationships, you make the assumption that the individuals being connected have strong relationships or foundations of association. But there are some relationships that aren’t always reciprocal and would go unnoticed in a directed graph. For example, a character that is of a higher social standing may not interact with someone, but there are many other people who associate themselves with this character. A directed graph will thus illustrate all of the different conversations that are occurring throughout Les Miserables, reciprocal or not, in order to convey more about what conversations the characters are involved in and how that speaks to their identity/purpose in the story.

Valjean has an ID# of 11 and is the source of four different interactions. However, Valjean is the target of 23 other sources, showing the number if interactions others feel they have with Valjean. Fantine has an ID# of 23 and is the source of nine different interactions, but is found to be the target of six different sources.
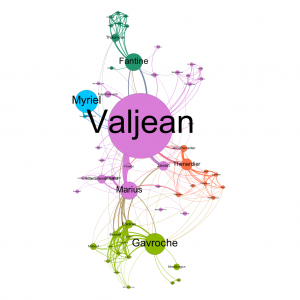
By increasing the repulsion strength to 10,000 fro 200, the nodes representing the characters in Les Miserables are pushed further apart so that their relationships to one another are more visible and organized. Those that have weaker relationships become further apart and their pathways much thinner, representing the strength of their relationship. Those that have stronger relationships are sitting closer together and have more pathways connecting them together. The average path length was ran at 2.641 and the diameter was found at 5. This reveals that there is approximately 2.6 degrees of separation in the dataset, or the average number of connections between the different characters. Whereas the diameter indicates that between two characters there are at most 5 connections between them. By setting the minimum of betweeness centrality to 10 and the maximum to 200, large circles appeared to represent what were smaller nodes. The biggest one is centralized in the middle and there are five smaller in comparison surrounding the large central node. I expect, that the central largest node is most likely the main character, as much of what the other characters are talking about and their connections are relating to the central figure.
PART III.
I chose a repulsion strength of 12,000 because a lot of the nodes were sitting right on top of one another, making it difficult to see the different connections and categories the data was being placed in based on the twitter relationships. The average path length was ran and recorded at 5.242, indicating that there are approximately 5 degrees of separation, or number of connections between the different twitter users. The modularity was ran as well, recording at 0.901, showing how the network within Twitter for #keystoneXL was decomposed into modular communities. The connected components was also ran and recorded at 433, indicating the amount of nodes that are connected to certain modular groups.
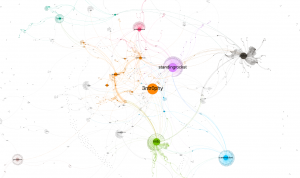
Overall the final graph depicts larger nodes in various colors with cloud interactions surrounding them, representing all the other nodes that are interacting with the main one and their relationships to other large nodes of another color. Some of these main and emphasized nodes are ‘standingrockst’ shown in purple, ‘3ntr0phy’ shown in orange, ‘nrdc’ shown in green, ‘oilsandsaction’ shown in teal, ‘mikehudema’ shown in pink, ‘ourrevolution’ shown in light blue, ‘greenpeace’ in light pink, and ‘potus’ shown in black. There are also many singletons or dyads that remain grey but fill the outskirts of the graph like a membrane of sorts.
The community highlighted in orange, headed by ‘3ntr0phy’ includes other larger nodes like ‘realdonaldtrump’ and ‘jankleeb’. ‘3entr0phy’ is a twitter user claiming to be a animal rights activist, physicist and environmentalist, in large against the keystone XL project and its potential harm to the indigenous tribes at the cost of oil. Twitter user ‘jankleeb’ also associates as a ‘pipeline fighter’ and the founder of @boldnebraska who strive to empower the state and “create change online & on the ground. #NoKXL”. However, it is interesting to see that ‘realdonaldtrump’ is within this community as well, most likely in an effort to call out Trump on his advancing policies and official approval of the project. It is interesting to see that the orange node ‘realdonaldtrump’ is so far away and has weak pathway to the black ‘potus node’. The green community is headed by ‘nrdc’, the National Resources Defense Council, which contains a dense cloud of other twitter users interacting and most likely retweeting their tweets expressing the opposition to Trump’s official approval of the keystone project, shown in its pathway to the ‘potus’ community, but within the context of its large and diminishing environmental impact.
The teal community headed by the node ‘oilsandsaction’ represent a more Canadian view to the issue by retweeting and pointing out the facts that prove the benefits and lack of risk/reasons to attack oil sands. I think it is interesting how they emphasize Canadian energy and Canadian oil sands to give off a nationalist vibe to their positivity for the extension of the pipeline, and often ask the question of why other foreign oil tankers receive no protest, but Canada has to be so directly accused and looked down on. The other larger nodes within the community seem to express the Canadian perspective and support for the extension of the pipeline from Alberta. The community highlighted in purple, headed by the node ‘standingrockst’ represents the Standing Rock Sioux reservation and their strong opposition to the Keystone XL pipeline. With a strong connection to the purple community is the pink one headed by ‘mikehudema’ which takes a position from Canada advocating for green peace and environmental activism in opposition to the pipeline. Whereas, a little further out to the left of the graph there is a light pink community surrounding the larger node of ‘greenpeace’ representing the conversation of environmental protection and peace.
The amount of singletons and dyads circulating around the gephi graph represents the many individuals who are tweeting on their own, or having a direct conversation with another twitter user, but do not participate in the conversations that are highlighted in the center of the graph. It shows that while the #KeystoneXL hashtag includes many different communities to highlight different conversations/perspectives about the issue, there are also many people who are involved but in different contexts. For example, there are clusters of grey interactions surrounding ‘lakotalaw’ and ‘benandjerrys’ that exist further out from the central nodes. I think analyzing this particular time period was especially useful since the the official approval of the presidential permit for the extension of the pipeline was approved on March 24th, there was a heightened conversation in light of this advancement.
Your keystone data is really great to look at and awesome that it is all connected in one conversation. My data for #energy was the polar opposite, with nodes set up all over the scattered across the graph. I think the difference in our graphs comes from #energy is a broad term that still being developed as a tweet understanding. Keystone is pretty independent topic as in if people are tweeting about keystone then their talking about keystone, with energy it can sometimes be a guy eating a banana and gaining energy. Really interesting how your keystone data is being tweeted by such larger figures.
Your data seems quite similar to mine. There are a few big players and lots of people talking to those larger nodes, but no one central player. Your grey singletons or dyads are very interesting. I also got @realdonaldtrump in almost the same node-looking way as you. I am curious as to what @benandjerrys is doing in all this. Honestly I thought your data would look more similar to Graham’s, since Keystone XL is such a specific topic compared to #energy or #climatechange, which is so broad.
I think your data is tight. I too saw mikehudema in my graph, and I have seen that twitter handle before in past labs so it is awesome to see overlap between our laps like that! I find it very interested to see how large and clustered your data is. Your graph is fantastic as well, it really shows a complex discussion of #keystonexl. Rarely do I see a large presence of pro-DAPL sentiment on the twitterverse, so it is very interesting to see #oilsandsaction. While I could not disagree more with that cluster of support, it is very interesting that you observed a nationalist spin to that cluster. I’d love to compare our data during the same time frame – I’m not sure what dates you used, but I think it would be very worth while to compare our data on similar dates.