
I chose the last 3,141 tweets to look at this data set. It covers multiple days where the lgbt community was active on twitter.
When I sorted my languages, I had 23 different languages covered. These included: ar, bg, ca, de, el, en, en-gb, es, fr, id,, it, ja, nl. pl, pt, ru, sk, sv, th, tr, uk, xx-ic, zh-ch.
2282 tweets are in english. My total tweets in this data set is 3,141 so the percentage of tweets in english is 72.65%. This is the majority of tweets.
THE DATES ARE FEB 25-MARCH 1st!!
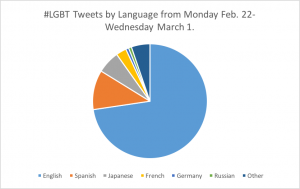
I think that English has the most tweets because, as I learned in Lab 2, a lot of the #LGBT talk is coming from places in the United States. Also, English is a very well known language. The next largest slice of this pie chart is Spanish, with about 11% of the data set being in Spanish. I think this is because people within the United States (where most of the tweets are coming from) are often bilingual. Another large influence of language in my data set is Japanese. This makes sense because, as I learned in Lab 1, Sapporo, Japan recognizing same-sex couples for the first time, so it is expected that the LGBT community would be tweeting about it in Japanese.
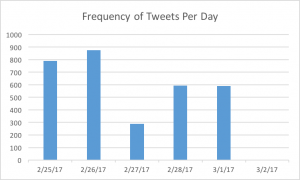
- Tweets were high on the 25th of February, there were rallies in St. Louis, and a lot of talk about the worry of discrimination for housing against LGBT people. Also, a lot of people were tweeting about the tv show, When We Rise, in preparation for the Oscars. The next day was there was the largest amount of tweets per day within this data set, and I believe this is because it was the day of the Oscars. Two LGBT programs, When We Rise, and Moonlight, were Oscar nominees and winners, so this explains the LGBT communities activity on twitter. The next day has a very noticeable dip in tweets. I think this is because all throughout the news, there was a lot of talk about ANTI LGBT, not LGBT. I bet that the LGBT community was not using this hashtag as much because it is normally use as a way to reaffirm a sense of community and support one another. On this day, Donald Trump created a “religious freedom” executive order and it has potential to discriminate against LGBT people. Also, it was the Monday after the Oscars. The 28th and the 1st of March had about the same amount of tweets per day. On these days there is a lot of talk about the North Carolina “bathroom bill” and how the NCAA is refusing to let North Carolina host any NCAA tournaments unless they appeal their bill. On March 1st, a transgender woman was killed in New Orleans. As a result, Frank Roberson, a Sargent, stepped up to act as a liaison between the New Orlean Police department and the LGBT community. This is bound to create conversation within the LGBT community. On March 2nd, there was only one tweet, because this is the day I stopped running TAGS. I probably should not have incorporated it in this data set, but I didn’t realize I only had one tweet until I did the day by day frequency analysis. I think that the amount of tweets sent each day correlates with what is going on in the news. Also, I find it entertaining and funny at how active the LGBT community was during Oscar Weekend, seeing as twitter is a platform to talk about other medias, it makes sense that there was such strong activity.
- I would say that my twitter data is very average when comparing to the rest of the class. There are a few people lower than me with averages and total sum’s, but there is a lot more people who have higher means etc. As for the percentage of tweets in English, I am also average, I have 72%, and it seems like people either have in the 90’s or the 50’s in percentages. I would say that this means that my twitter hashtag is consistent. It is a prevalent topic from day to day life, and not something that spikes and then disappears. The LGBT community has been working hard for a long time to make strides in equality and justice, and will continue to do so for many years to come. I think that this just shows how LGBT is a current issue that will stay being talked about, especially in the United States. As for trending, LGBT does not seem to trend as much as other hashtags might. This probably has to do with the fact that it is something that people bring up in discussion often, but not normally as a demanding role.
- Everyone has around the same count of tweets as me, this is probably due to the fact that a majority of the class decided to scrape only 3,000 tweets for further analyzation. Taylor has the most tweets. I think that my tweets are evenly distributed, but my range is high because of the one tweet from a new day. I wish I just left it out of this whole lab. 🙁 On average, there is about 530 tweets per day using this hashtag, I think that that is pretty good and again, shows consistency within my data set. This topic is talked about every day, and only varies about 200 tweets (disregarding the March 2nd). That range is not very large, so it shows the patterns and the expectations of the hashtag, and how it is always in conversation.
- I don’t think that my data descriptive statistics revealed any more information than my visualizations did. I thought it was helpful to know the average tweets per day, but I felt that my visualization allowed me to understand other elements that the statistics reiterated. I learned how constant my topic is on twitter. I found that it is talked about everyday, and media and television events can often trigger the amount of tweets to spike.
| 523.5 | Average Tweets Per Day | ||
| 592 | Median | ||
| #N/A | No mode | ||
| 3141 | Sum | ||
| 876 | MAX | ||
| 1 | Min | ||
| 875 | Range between max and MIN | ||
Finding connections between data and the reasoning behind that data really helps gain a better understanding of what we are looking at. With the peaks of activity for #lgbt tweets, it makes a lot of sense that there was a lot of discussion when Moonlight and When We Rise became Oscar nominees and when there were rallies in St. Louis. If you had left out the one tweet on March 2, I wonder what would have happened to your calculations. The average amount of tweets per day definitely is significantly higher than the 523.5 that you found.
It is interesting that such a high percentage of these tweets are in Japanese. I noticed that in my data, there were a few unexpected languages that had quite a few tweets, such as Hungarian. Perhaps the Twitter database simply misidentified the language, or perhaps there are one or two Japanese people who are really devoted to the LGBT community and post many tweets. It would be interesting to look into these tweets in a separate study.
It is really interesting to see how you were able to find the correlation between the high amount of tweets on Feb. 25th and the rallies in St. Louis. While it makes sense that this would occur, what is even more intriguing is your interpretation on the impact of the two oscar movies on the high amount of tweets. This is something that I would have never really considered and I think it is really important that you are looking into all different lurking variables that could be effecting your data.
When looking at your data I first found it very interesting how many different languages were included in your tweets considering the amount of tweets in your data set. Although my dataset included 24 different languages, I had 83,000 tweets compared to your 3,000. It was also interesting to note that although the majority of your tweets were in english, it was 72%, where I had 96%. While I do agree with your analysis of this information regarding the reason as to why english is the most prominent, spanish following, I think it would be interesting to investigate why you have such a wide range. When looking at just your data it is clear that english is leading and you do a good job of analyzing this information but when placing it amongst other classmates findings such as my own it becomes apparent that you have a larger range of languages.