
After sorting my tweets into languages in alphabetical order, I found that I had 21 different languages in my tweets between March 16th- 21st. The languages I had are ar, ca, cs, de, el, en es, fa, fi, fr, hr, id, it, ja, nl, pl, ru, sr, sv, tr, zh-CN. After using the Countif equation, I found that 2643 of my 2998 tweets were in English which is 88% of my data. 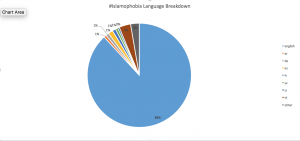
I think that the majority of my tweets are in English because Islamophobia is a big issue within America and English is our dominant language. Islamophobia has been in the news since Trump’s Muslim Ban which also explain why English was the top language. I was shocked that Dutch was the second top language and wonder why. I would have thought that Arabic would have had more tweets because that is the predominant language of Muslims.
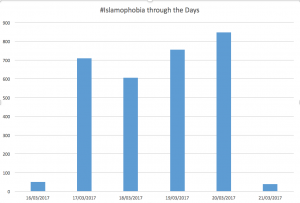
I chose to stop running my data in the morning on March 21st which is why I think the tweets that day are so low. As for March 16th, I used my data from Lab 4 and stopped when I got to around 3,000 tweets which was in the evening on March 16th so I am missing some data from that day. Looking at the bar chart all days have around the same number of tweets but March 20th has a slight peak which makes me think something happened on that day.
When looking into the news from these days this is what I found:
March 16th: A US federal judge blocked Trump’s revised travel ban. Although this man is not the first judge to oppose Trump’s revised travel ban, no big new outlets reported on this. The Reports came from the Muslim News and StepFeed. Other than these articles, Islamophobia was not talked about in the news on the 16th.
http://stepfeed.com/trump-s-muslim-ban-has-been-blocked-again-6342
March 17th: Like the 16th, nothing significant happened on this day with Islamophobia but The Guardian did post an article about What the American court system has been Islamophobia.
https://www.theguardian.com/commentisfree/2017/mar/17/islamophobia-most-worrying-europe-not-trumps-america
The rest of the days continued in this same matter. I believe that the majority of my tweets were just tweets discussing Islamophobia rather than an event that happened. I feel like people on Twitter engage in ongoing conversations about Islamophobia with or without an event. This is also why I believe the number of tweets per day are relatively the same. I do wonder what my data would look like as a whole or when an event had occurred. I wish I had looked at a larger section of my data so I could have seen the how many tweets per day there were on the days when Islamophobia was in the news.
| average | 499.6666667 |
| median | 656 |
| mode | #N/A |
| sum | 2998 |
| max | 846 |
| min | 37 |
| max-min | 809 |
First, my mean, median and range are far smaller than most of the class because I used a smaller set of my data. I do think that I am a standout because I did not use the entire semester of data. Looking at my Twitter data, the average tweets per day was relatively the same. When looking at the percent of tweets in english, my data was pretty equal to the rest of the class. I would be shocked if our class data had been different because we are all looking at issues that a prevalent in the US.
The first thing I noticed is that our class looked at many different sizes of data. A lot of people used their whole data sets while others used a condensed set. My max and min were similar to some of the other people in our class. I feel like I am not a stand out in this way. My range is also pretty average in comparison to the rest of my class. I feel like overall my data was average in comparison to my classmates so the results of my data did not shock me.
In conclusion, I am not shocked about the results from my data. I chose a smaller data set which resulted in smaller numbers than some other people in our class. I think that if I had looked a my whole data set I would have seen days where the number of tweets were about the same mixed with some peaks when the news spiked.
Ahmad, Muneer I. “American courts are tackling Islamophobia – why won’t Europeans? | Muneer I Ahmed.” The Guardian. Guardian News and Media, 17 Mar. 2017. Web. 14 Apr. 2017.
Lemon, Jason, and Un2XjwcisrSKIYij. “Trump’s ‘Muslim ban’ has been blocked … again.” StepFeed. N.p., 16 Mar. 2017. Web. 14 Apr. 2017.
“US federal judge blocks Trump’s revised travel ban.” The Muslim News. N.p., n.d. Web. 14 Apr. 2017.
Dear Caroline,
First of all, one thing that I found very impressive in Danny’s lab, which you and I both did not do, was that he took the time to convert each language in the dataset to their proper title. This is something that I think both yours and my lab could benefit from doing to avoid any confusion.
I find your point interesting to attribute most of the tweets being in English to Trump’s Muslim Ban. #Islamophobia, as well as #Obamacare and #WhyIMarch are all U.S. political issues, therefore it makes sense that the majority of our datasets are in English. I would agree with you on the confusion behind Dutch being the second most tweeted language in your dataset. One thing for you to consider is typing in the keywords “Dutch” & “Islamophobia” into your google search to see what results you find.
Overall, great work on the final lab. Looking forward to your final presentation!
All the best,
Katherine
Caroline, another great post. I thought that it was pretty wild that 88% of your tweets were in English, especially because your topic is more of a worldwide issue when compared to Obamacare, which only affects people in the United States. Like Katherine said, your point as to why 88% of tweets were in English makes sense because Trump’s travel ban did promote Islamophobia throughout the United States, which I’m sure caused many people to express their opinion on Twitter. One thing I think you should do is convert the languages in the dataset to their actual name because it makes understanding the pie chart so much easier. I thought that the articles you chose on March 16th and 17th helped show why there were a certain number of tweets on those days when compared to other days. I also feel like my dataset was too small when analyzing the mean, mode, range, etc. aspect of this lab. I wish I used my whole dataset so that my data for this would be more accurate. Good job!