The “Not So Dirty” Dozen, Plus a Few: Ways Hartford Magnet Schools Influence Student Enrollment

Posted on

How do magnet schools influence student enrollment? Kevin Welner previously published “The Dirty Dozen,” which describes ways charter schools influence student enrollment (Welner, 2013). Do magnet schools, which are founded upon different goals, use the same strategies to sway their student body? This essay aims to determine if and how Welner’s “dirty dozen” also apply to magnet schools in Hartford, how they are used differently, and what additional approaches magnets use.

Hartford Public Schools is an “all-choice” program, in which families submit lottery applications to their preferred district school, including charter and magnet schools (Dougherty et al., 2014). Charter schools aim to improve academic achievement, provide for educational innovation, provide vehicles for the reduction of racial, ethnic, and economic isolation, and provide a choice of public education programs for students and parents (Cotto & Feder, 2014). Although charters can have their charter revoked if they do not attract, enroll, and retain low income, minority, emerging bilingual students, and students with disabilities, no standards exist to measure this (Cotto & Feder, 2014). Magnet schools aim to reduce, eliminate, or prevent the racial, ethnic, or economic isolation of public school students, and offer a high-quality curriculum that supports educational improvement (Cotto & Feder, 2014). Magnet schools provide special curricular themes to attract students from both city and suburban districts (Dougherty, 2015). Funds for magnets can be withheld if the student body does not contain between 25% and 75% students of color, as in accordance with the Sheff vs. O’Neil standards (Cotto & Feder, 2014).

Location and Transportation 

Welner argues that charter schools choose their location with the students they intend to serve in mind, taking into account the availability of transportation. The Capitol Region Education Center, CREC coordinates free transportation to magnet schools, even for students attending schools out-of-district (CREC Schools, 2015), whereas charters only guarantee transportation to in-district students (Connecticut State Department of Education, 2015). The wider transportation services offered to students attending magnet schools allows them to attract students from different backgrounds in order to uphold the Sheff standards, while charters are not held to such standards and so do not need to provide transportation to such a wide region

RSCO transportation zone map (Source: Regional School Choice Office)

This theme is evident in field notes collected by my classmates from attending choice fairs and open houses. IF, at an open house, noted that the rep discussed “how they provide transportation regardless of location.” Additionally, when SS and JC spoke with a student attending a magnet school at the RSCO fair, the student “volunteered the information that buses are free.” AL and SG, also at the RSCO magnet fair, described an area solely for providing information about transportation for families interested in magnet schools in the Hartford area. Thus, at least in Hartford, it appears that magnets are not trying to exclude students based on their location as charters allegedly may do; instead, they are accommodating students from the city and surrounding suburbs.

Although these schools may be trying to accommodate far-away students, location will always play a role in enrollment. Students may opt out of a free but long commute to a magnet in favor of a quick commute to a neighborhood school. This location approach is not necessarily mal-intentioned, though. Charter schools in Hartford likely are not intentionally excluding certain students, but locating themselves in areas of high need.

Advertisement 

Welner’s “Mad men” approach argues that charters shape their school’s demographics using advertising and images. Hartford magnets appear to use this approach more to achieve diversity and inclusiveness, while Welner implies that charters may target or deter specific student demographics. AM noted that the students who represented the magnet school he visited were of different races, white and Hispanic. AM described a video shown that featured “an anecdote about a white girl and a black girl who became good friends through school,” and another clip in which a teacher says “not one of my students look alike.”

Source: Hartford Magnet Trinity College Academy

Magnets appear to be emphasizing diversity in their advertising to encourage students of different races to feel comfortable applying, and not simply targeting or deterring students of a certain race. AG and RU observed an elementary magnet distribute brochures in both English and Spanish, and EK, at the RSCO fair, noted that school representatives of magnets sometimes spoke Spanish to Spanish-speaking families. Additionally, the RSCO catalog, which provides information about Hartford’s magnet schools, is available online in Spanish.

LS, at the RSCO fair, observed one booth for a while and “noticed that the presenter’s spiel was different based on who came over to the booth.” He observed that when a black, seemingly lower class family came over, transportation was extensively focused on, while when a white family came, the rep skipped the transportation portion of his spiel and instead focused more on curriculum. Thus, these Hartford magnet schools are not targeting their advertisements for or against a particular group, as Welner implied in “Mad men”, but are tailoring them to fit the needs of each of the many target populations, likely to adhere to the Sheff standards.

Application and Enrollment Requirements 

Welner suggests that charters sometimes place conditions on applications, with lengthy applications and mandatory visits. In Hartford, each charter requires its own application, while there is a single application for all magnets, managed by RSCO, in which up to five magnet schools can be ranked. This lengthy application  appears daunting at first, but only asks for basic information, and rankings of either open choice or magnet programs. Jumoke Academy, a charter school, requires five student essays on top of similar information, and Explorations Charter School requires incoming students to submit two essays. Odyssey Community School, another charter, requires interested students to attend an open house. Requiring essays and attendance at events weeds out unmotivated families with likely lower-achieving kids, and lower-income working parents who find it difficult to attend open houses and help their child write five essays. No such essays or visits are required to apply to any magnet schools. Auditions are not even required for the Hartford arts magnets, making them more accessible to lower income students who cannot afford private lessons. Thus, Hartford charters, with more extensive, more complicated applications that are unique to each school seem to make more use of this “Hooping it up” strategy than magnets with their simpler, single application.

No evidence was found for Welner’s “Illegal and Dicey Practices” approach, in which charters may ask for Social Security cards or birth certificates, even though these cannot be required by law. Nowhere on the RSCO application was there a request for social security numbers or birth certificates. This held true for the easily accessible Hartford charter school applications, indicating that Hartford choice schools may not employ this “dirty” approach.

There is also no apparent evidence of Welner’s “Send us your best” strategy in the RSCO application, in which conditions like needing a certain GPA or prerequisites are placed upon enrollment. Although few charter applications could be accessed because the application period recently closed, Explorations Charter School did employ this tactic, by requiring that students entering the high school not as freshmen already have certain number of credits. Once enrolled, students must pass 80% of their courses and be present 90% of the time. Again, although little data is available, Hartford charters may more readily place conditions upon enrollment.

Steering Away 

Charters also may use Welner’s “bum steer,” in which schools steer away less desirable students. This indirectly appeared in the field notes, but in a more positive way, with magnets emphasizing finding the right fit. IF explained that one magnet “offers a program in which a prospective and/or accepted student can shadow a current student because the school only wants students who want to be there.” EK, at the RSCO fair, observed, “several schools also encouraged parents to have their child experience a day at their school and decide for himself/herself if it would be a good fit.” Rather than the school representatives themselves steering away students who may not be the best match, they encourage students to make this “fit” judgment themselves. Thus, the magnets are, at least in theory, getting the students who are a good fit for the school without using a manipulative approach.

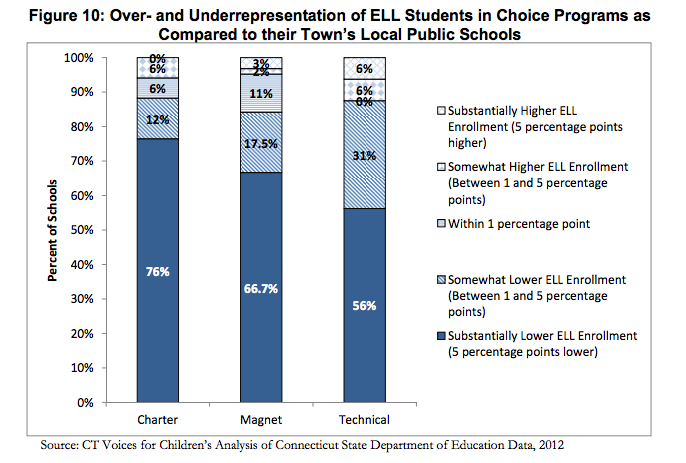
Relatedly, charters may use Welner’s “not in service” approach by simply not readily providing services for a group of higher-needs students. AM, at a magnet open house, explained, “these special arts programs received a lot of airtime when things like special education and ELL programs were skimmed over.” While state law requires schools enrolling more than twenty English language learners (ELL) to offer a school-wide bilingual education program, there is no requirement that choice schools offer such a program if ELL enrollment is under this threshold (Cotto & Feder, 2014). The school’s failure to mention any services for ELL students was possibly an attempt to discourage these students from applying, saving the school from bearing the financial burden of implementing these services. ELL students in Hartford are less likely to attend magnet and charter schools than local public schools (Cotto & Feder, 2014), perhaps due to the “not in service” approach.  However, as discussed above, magnet schools did make efforts to cater to ELL students by advertising in Spanish.

ELL students are the most underrepresented in charter schools, followed by magnet schools. (Source: Cotto & Feder, 2014)
In Hartford, there is the smallest percentage of ELL students in charter schools, followed by magnet schools. (Source: Cotto & Feder, 2014)

Discipline 

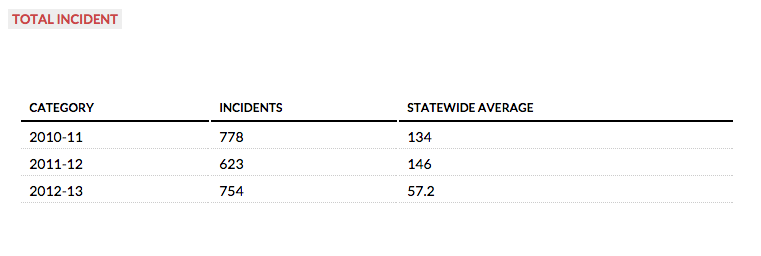
Welner’s “discipline and punish” tactic involves charters using harsh discipline regimes, leading to high expulsion rates. While data was unavailable for expulsion rates, a feature on CT Mirror compares disciplinary incidents at a given school to the statewide average. Data for the available Hartford magnet schools was perplexing; many schools reported zero disciplinary incidents in 2012-2013, however, even more schools reported numbers higher than the state average, most frequently school policy violations.  This could either indicate great variation in school policies and disciplinary strategies between Hartford magnets, or some magnets not reporting this information. Many charters with accessible data were also above the state average, again with the majority being for policy violations. While the data does not indicate if these incidents led to expulsions, the high numbers suggest that some of Hartford’s choice schools may employ harsh discipline regimes, perhaps in an attempt to remove disruptive students, as Welner suggested.

CT Mirror data for the Sport and Medical Sciences Academy, with the highest number of disciplinary incidents of all Hartford magnet schools for which data was available.
CT Mirror data for the Sport and Medical Sciences Academy, with the highest number of disciplinary incidents of all Hartford magnet schools for which data was available.(Source: CT Mirror)

Approaches with Limited Data 

Welner discusses additional approaches, however limited data for these is available. Such strategies include “flunk or leave”, in which school officials threaten to hold the student back a grade if they remain in the school, and “the fitness test,” in which parents of less successful students are counseled to consider alternative options. It cannot be determined if these apply to Hartford magnets. There is also little data available for Welner’s “going mobile (or not)” strategy, in which charters decide whether or not to backfill the students they lose, either during the year or for higher grades. AG and RU, at a magnet open house, explained that openings in grades other than the school’s starting grade “depended on how many people leave,” suggesting they do replace students the following year. However this is an elementary magnet, so it is not known if magnets backfill in higher grades or allow new students to enter mid-year.

Magnet Themes 

Welner explains that charters decide early on what types of students to cater to when determining what niche the school is designed to fill, such as focusing on rigorous academics or special needs students. Expanding on this approach, magnets more indirectly influence enrollment with their special curricular themes. Hartford magnet themes include arts and humanities, STEM, college prep, vocational, and character education. These themes, which are intended to attract students, may actually attract certain students while repelling others.

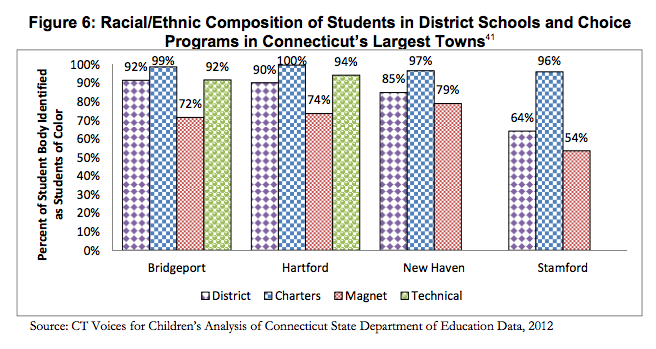
STEM schools, for instance, may attract more higher-income, well-educated families who understand the importance of such curriculum. LS, observing a STEM magnet booth at the RSCO fair, described how an Asian mother from an affluent suburb had already researched the school, and asked the representative about specific opportunities and “what the school would offer her son.” In contrast, a black mother from Hartford asked more general and “practical questions, including after school care options and transportation.” Although both expressed interest in the school, the class difference likely explains this difference in questions, and the Hartford mother’s focus on after-school care and transportation suggests that practicality, not special programs, is most important to her family. While the curricular theme may be the selling point for an affluent family, lower-income families may have to settle for a more convenient school. AL and SG, at the RSCO fair, also commented, “despite the fair being particularly minority heavy in attendance, the individuals looking at the specialized schools, whether performing arts or science based, were predominantly white.” Magnet schools serve the lowest percentage of free and reduced lunch eligible students in Hartford (Cotto & Feder, 2014).  Whether or not this holds true for STEM schools, the specialized themes may partly explain why the least low-income students enroll in magnet schools.

Hartford magnet schools enroll the lowest percentage of students eligible for free or reduced price meals. (Source: Cotto & Feder, 2014)

Magnets also influence enrollment by not offering particular themes. For instance, there are no Hartford magnets with a dual language theme, which also may explain the lower ELL enrollment in Hartford magnets than local public schools (Cotto & Feder, 2014). Perhaps if magnets expanded the breadth of their themes, a wider population will be attracted.

Availability of Information 

Another bias in choice schools not accounted for by Welner is the availability of information about the schools. Information can often be found online on school websites. However, not every family in Hartford owns a computer, or knows how to use one, creating a bias against low-income families and families with illiterate parents, also biasing against likely lower achieving children. Valuable information is also gathered from attending open houses and school fairs that some parents cannot easily attend. HH, at the RSCO fair, noted “some parents expressed concern that they may not be able to make it to the specific info sessions offered by some schools due to the fact that those sessions are normally offered during weekdays.”  Working, lower-income parents likely have less flexible hours, or are unable to afford childcare, and cannot attend open houses to get the important information. Although this likely impacts student enrollment, this is probably unintentional, and thus more “accidental” than “dirty” in biasing access to choice schools.

Conclusion 

Many of these approaches mentioned in “The Dirty Dozen” that charter schools may use seem to be less readily employed by Hartford magnet schools. With the magnets’ inclusive approaches in advertising and transportation and a convenient application, for instance, magnets seem to be well-intentioned and trying to create a diverse student body catering to different types of families and students rather than purposely trying to exclude certain types of students. However, the attempts do not always accomplish this inclusiveness, and some factors, like themes and availability of information, may unintentionally leave some students behind. While magnets may advertise in Spanish, for instance, they still enroll a smaller ELL population than the neighborhood schools. This indicates that magnets do not intend to exclude this population, but other factors play a role. If choice schools wish to prevent these “accidental” factors that make certain students less likely to enroll from occurring, these populations must be identified so that choice schools can better recruit these students.

(Note from the instructor: Students were ask to write essays no more than 2500 words, which would be about here. Evaluators may read as much as they wish, but should not rate the essay beyond this point.)

References

Attend and Apply (2015). Explorations Charter School. Retrieved from http://explorationscs.com/attendapply.html Charter School Questions and Answers. (2015).Connecticut State Department of Education. Retrieved from http://www.sde.ct.gov/sde/lib/sde/pdf/equity/charter/faqs.pdf

Cotto, R. & Feder, K. (2014). Choice Watch: Diversity and Access in Connecticut’s School Choice Programs. CT Voices for Children. Retrieved from http://www.ctvoices.org/sites/default/files/edu14choicewatchfull.pdf

Dougherty, J., Zannoni, D., Block, M., & Spirou, S. (2014). Who Chooses in Hartford? Report 1: Statistical analysis of Regional School Choice Office applicants and non-applicants among Hartford resident HPS students in grades 3-7, Spring 2012. Trinity College Digital Repository. Retrieved from http://digitalrepository.trincoll.edu/cgi/viewcontent.cgi?article=1045&context=cssp_papers

Dougherty, J. (2015). A Vocabulary for Understanding School Choice in Connecticut. Presentation for CSPL 341: Innovation in Education- Choice Seminar.

How to Apply (2015). Odyssey Community School. Retrieved from http://www.odysseyschool.org/about-odyssey/admission-information

Explorations Charter School Application (2015). Retrieved from http://explorationscs.com/images/2015-2016_Application_Long_Form_.pdf

IF, SS, JC, AL, SG, AM, EK, LS, HH, AG, RU (2015). Class Field Notes.

Jumoke Academy Application (2015). Retrieved from http://jumokeacademy.org/wp-content/uploads/2014/09/JumokeAcademyApplication2015-2016.pdf

RSCO Catalog (English). (2015). The Regional School Office. Retrieved from http://www.choiceeducation.org/javascript/tiny_mce/plugins/filemanager/files/RSCOcatalogFINALNov19.pdf

RSCO Catalog (Spanish). (2015). The Regional School Office. Retrieved from http://www.choiceeducation.org/javascript/tiny_mce/plugins/filemanager/files/RSCOcatalogSPANISH_web.pdf

RSCO Lottery Application (2015). The Regional School Choice Office. Retrieved from http://www.choiceeducation.org/javascript/tiny_mce/plugins/filemanager/files/RSCOlotteryapp201516_FINALDRAFT.pdf

The RSCO Transportation Zone. (2015). The Regional School Choice Office. Retrieved from http://www.choiceeducation.org/javascript/tiny_mce/plugins/filemanager/files/rsco_transportationzone.pdf

Transportation. (2015).CREC Schools. Retrieved from http://www.crecschools.org/for-parents/transportation/

Video. (2015).  Hartford Magnet Trinity College Academy. Retrieved from http://hmtca.hartfordschools.org/

Welner, K. G. (2013). The Dirty Dozen: How Charter Schools Influence Student Enrollment. Teachers College Record. [online], http://www.tcrecord.org

Your School (2015). The CT Mirror. Retrieved from http://projects.ctmirror.org/yourschool/index.php

Redesigning the Open Communities Alliance Mobility App to Help Connecticut Residents Find Affordable Housing

Posted on

BACKGROUND

The Mobility App run by Open Communities Alliance was created with the intent of helping people with government housing subsidies (notably Section 8 vouchers, an initiative that provides rental housing subsidies to low-income households) find homes in thriving neighborhoods with quality schools, low crime rates, and various other necessary amenities. 1 The App is currently available through the Open Communities Alliance website, but is relatively new and underutilized. A participant begins by inserting an address (perhaps his/her own or perhaps a desired location), clicking “Search,” and is then shown a peg on a map that reveals the location’s “Opportunity Index” (rated on a scale of “very low” (tan) to “very high” (deep orange)) as well as various “Neighborhood Assets” near the location (starting at ½ of a mile away and spanning up to 100 miles) such as public schools, daycare facilities, grocery stores, and places of worship.  Each differently colored section is based off of census tract data.

Macintosh HD:Users:ifine:Desktop:Screen Shot 2015-05-02 at 1.18.48 PM.png                                 
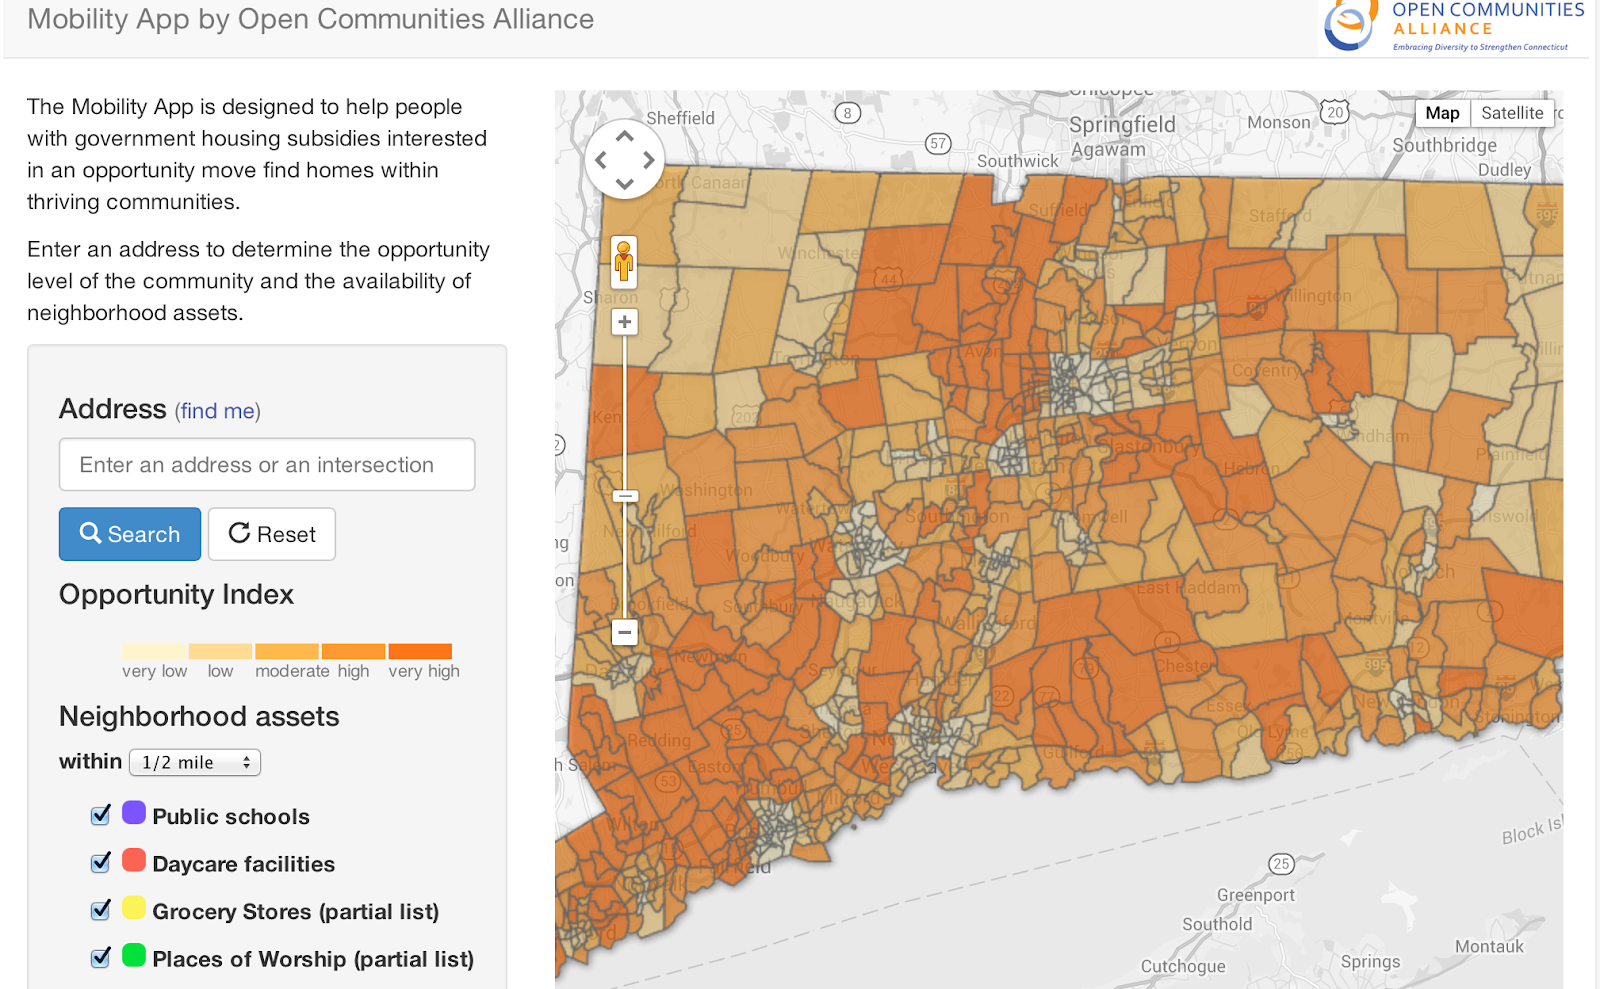
Figure 1: The Mobility App by Open Communities Alliance.

The “Opportunity Index” is based off of three qualifiers:

1. Economic Quality – such as but not limited to unemployment rate and job diversity
2. Educational Levels — such as but not limited to state math and English attainment exams
3. Neighborhood indicators — such as but not limited to crime rate and percent of people below the poverty line. 2

Yet, while the Mobility App is providing baseline support for housing movement, it is falling short in many regards.

1. There are not enough neighborhood assets to give a robust picture of what living in a specific location would be like.
2. There is not enough overt explanation as to what “Opportunity Index” means.
3. Participants are not fully engaging with the app in a meaningful way.  In a test done with the North End Action Team (NEAT) in Middletown, CT, only 29% of people polled changed how they thought about housing but nearly 65% of these people were looking to move. 3
4. Most notably, there are not direct links to actual available housing for rent, thereby undermining the singular mission that the Mobility App attempts to achieve through “help[ing] people with government housing subsidies interested in an opportunity move find homes within thriving communities.” 4

Considering this gap in effectiveness and the primitive resources currently given in the app, this essay calls for a redesign on the Open Communities Alliance Mobility App in order to create more opportunity and effective housing mobility.

HOW PEOPLE CURRENTLY ENGAGE WITH THE MOBILITY APP

On April 15, 2015, members of CSPL 341, the class for which this essay is being written (for more information on the purpose of this class as well as other projects conducted and various resources visit The Cities, Suburbs & Schools website), traveled down to the North End Action Team (NEAT) headquarters in Middletown, Connecticut to interview adults from the community in order to gather data on the public’s reaction to the Mobility App. We used audio and screen recordings to interview the subjects and track their movements and queries whilst interacting with the website.  We began with an interview script that asked participants whether they were thinking about moving or not and what their level of competency was with computers. Out of fourteen participants, 64% said they were thinking about moving and 71% said that they were regular computer users. 5
As we began the demonstration, we asked the participants to enter their approximate address (not actual address to protect for anonymity) and then review what the search revealed about their current location. The participants were instructed to explore the app at their leisure, however, this proved more difficult than expected. 57% of the participants could not enter their address without assistance and when exploring, 78% of participants clicked on one or fewer facets. 6 After the participants browsed the site, members of CSPL 341 then explained what each element (the opportunity index, the colored location dots, etc.) was designed to highlight in order to teach participants what each aspect of the app meant. Next, we asked participants to enter a predetermined address (100 Main St. Portland, CT) and have them describe to us what they saw. From there we concluded the interview by asking the participants if what they learned through the Mobility App changed how they viewed their neighborhood and if they had any feedback for the creators of the app.  The majority (71%) of participants did not change how they thought about housing mobility. We believe this was a result of the lack of an explicit explanation of each part of the tool. This application has proved not to be as easily accessible or self-explanatory as we once believed as many of the features were lost on the interviewees. However, once the application’s amenities were demonstrated and then explained in intimate detail, all but two users were not only able to navigate the application with ease but also were excited about its benefits. 7

WHAT PEOPLE SAY THEY WANT FROM A MOBILITY APP

When thinking about redesigning the Mobility App, there were a few pieces of feedback that came up repeatedly in our interviews at NEAT that coincided with a couple key housing desires expressed in Connecticut Fair Housing Center Study’s “Housing Mobility: What Do Housing Voucher Recipients Want?”  that we feel should be integrated into the redesign. First, there were some amenities that are not currently on our maps that interviewees mentioned were important to them when thinking about housing. This included both unquantifiable amenities such as “room to breathe” and “good neighbors” but also tangible amenities such as public transportation, affordability, and proximity to medical services and shopping centers. 8  Public transportation was an especially crucial amenity for both the NEAT participants and participants of the Connecticut Fair Housing. In fact, two members of the NEAT participant pool alluded to the fact they had no transportation at all and the Connecticut Fair Housing members ranked “Good Transportation” fourth behind “Safety”, “Cost,” and “Good Schools” (features which are already included in the current “Opportunity Index”). 9 At this point, the only reference we have regarding public transportation is the use of Google Maps. It would be incredibly beneficial to add local bus stops as one of the colored location dots on the map. Similarly, locations of hospitals/medical centers and shopping centers (but not limited to these entities) could be gathered through various data analysis programs. One of the other aspects mentioned was the issue of discrimination from landlords, with the participants in the Connecticut Fair Housing Center study, explaining that a bad landlord can ruin one’s housing search. Fortunately, a website, ratemylandlord.com, which allows tenants to review the landlords of their buildings and allows prospective tenants to read reviews before committing to living in the community. This website could be given as a link in the Mobility App to aid those looking to find housing in a building governed by equity and community.

 However the most important piece of feedback that we received from our interviews, which was seen both through observation and explicit verbal feedback, was that the website was not as accessible as we once believed. As shown in the data earlier, users struggled with the website until the features were explained in detail, which goes against the creators’ hopes for the website: users who stumble upon this app cannot find better housing opportunities if they cannot use the website itself.

Based off of the above, we have compiled a few changes to the design and function of the app in order to make it more accessible and useful.

1. Add in an “Introduction” video explaining how to use the app logistically and also to explain what facets of the methods or tools are, like opportunity level, tract, and neighborhood amenities.
2. Have the participants take a quiz that first assesses their current opportunity level then offers suggestions for higher opportunity level neighborhoods near their work or loved ones.

VIDEO

The inclusion of a video would visually demonstrate to participants (especially those not competent on a computer) how to effectively engage with the Mobility App. Hopefully, the video would make the website comprehendible to the extent that users would be able to navigate the mobility app from any location without the help of a housing counselor. This video feature would pop up automatically once the user has taken a short quiz, which will be explained in detail later. If he or she is not a first time user, the participant will have the option to skip the tutorial. The video tutorial will consist of six components and will be broken down into short video segments for each feature. The first chapter will introduce the application and explain what it is designed to help a participant with, reciting the App’s mission statement. The following chapters will be videos explaining more specific features within the application.

 The first specific aspect explained would be the “Opportunity Index” gradient located on the left side of the screen, as seen below. The narrator will clarify that the gradient ranges from very low, the tan color to very high opportunity level, a dark orange color, and that it was determined based on “economic, education and neighborhood quality.” 10 The narrator will go on to explain that that means evaluating the caliber of schools in the area, amount of job opportunities, crime rates and more.

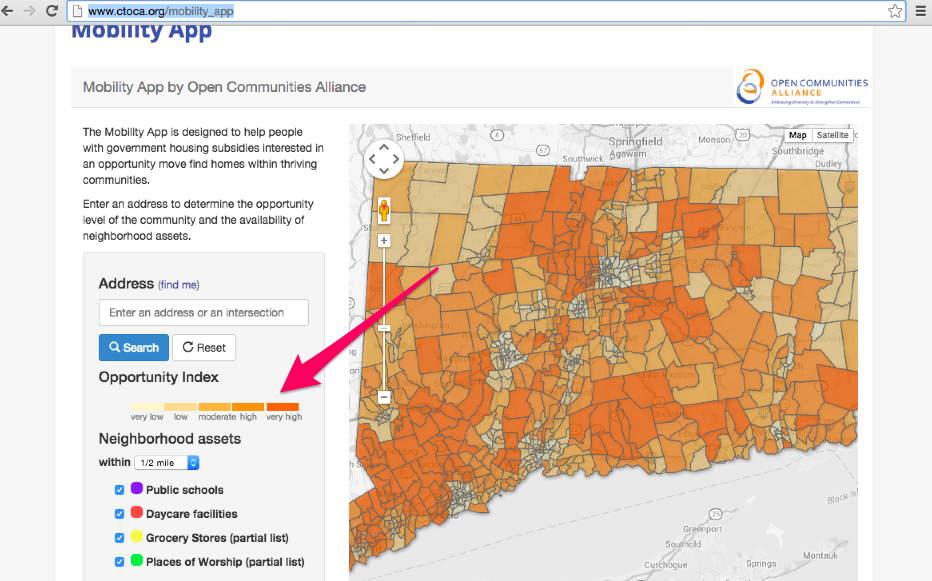
                        Figure 2: Explaining the Opportunity Index on The Mobility App

Next the video will explain the color coded amenities below the opportunity index such as public schools, daycare facilities, grocery stores, and the new amenities included such as proximity to hospitals, shopping centers, etc. in addition to pegs with links to homes for rent in the area (marked with red arrows). This will show the user how they can select amenities that are important to them specifically, and how the map will automatically show dots that represent the amenities near an entered address. It will also demonstrate that when a participant clicks on a dot, the title of the resource, the address, the phone numbers associated with this location pop up, as well as a link to getting directions to/from this amenity.

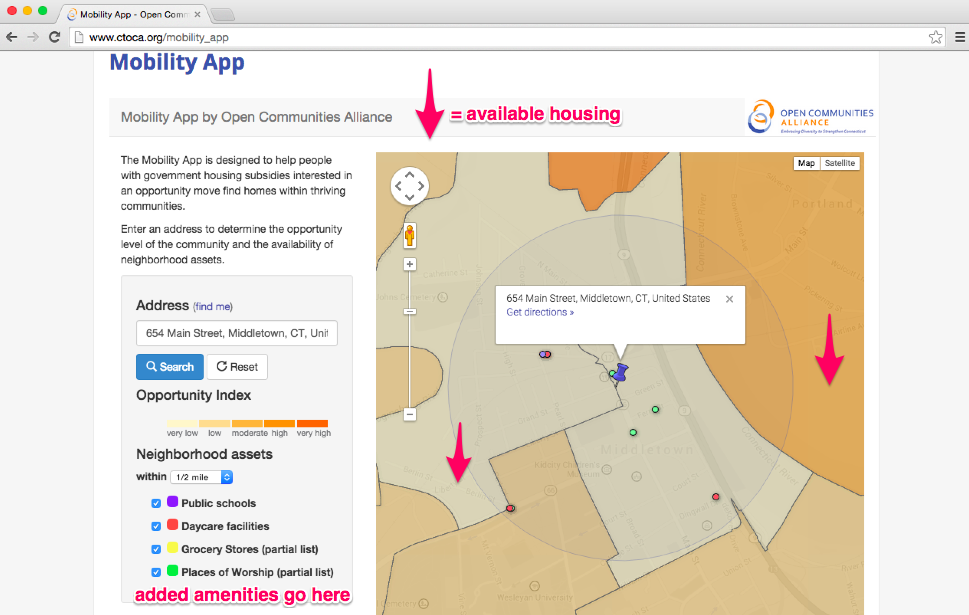
                  Figure 3: The Mobility App with Added Amenities and Available Housing

The next chapter highlighted in the video will be an explanation of how to use the “Get Directions” feature attached to each locale. The “Get Directions” button, the voiceover will explain, leads a participant to a linked website (most likely Google Maps) where the user will be able to see the easiest routes by foot, bike, car or public transportation from the selected destination to a second address. It will give a short demonstration of how to do so by entering a sample address and visually revealing how to use Google Maps.

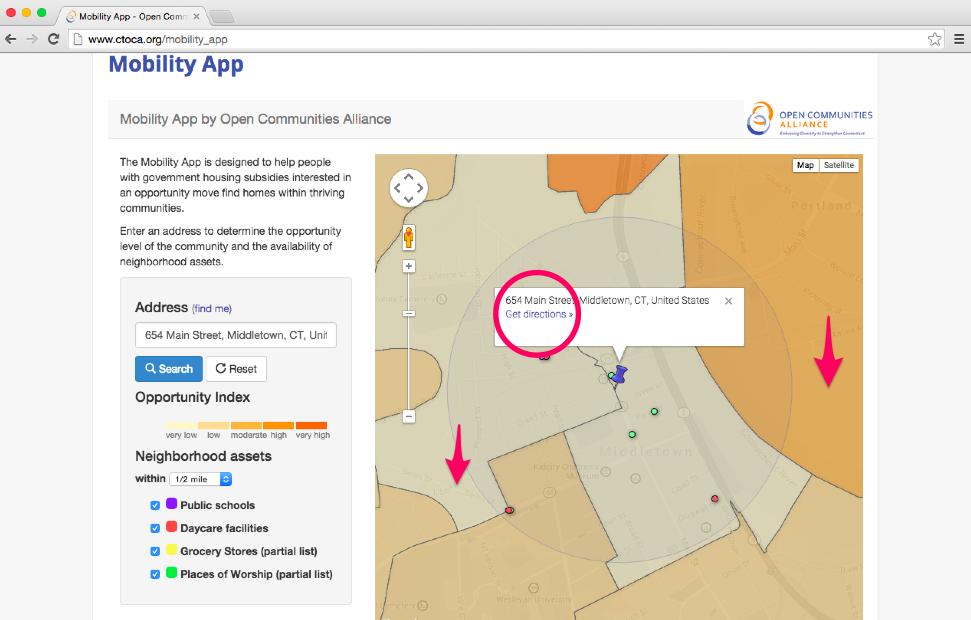
                              Figure 4: The “Get Directions” Button on The Mobility App

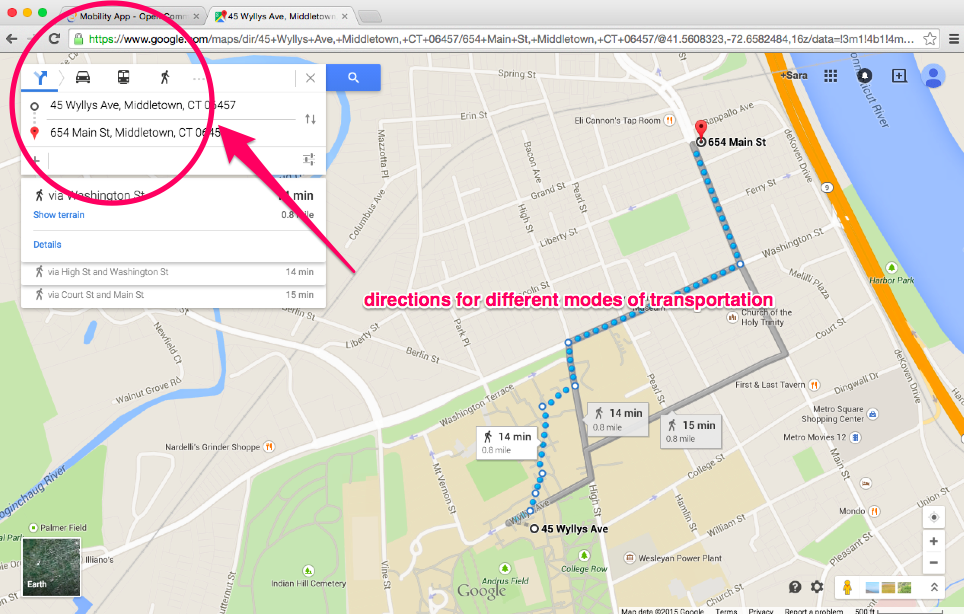
                                           Figure 5: Demonstration of Google Maps

Lastly, the video will describe one of the newer features that would be added with our redesign: the landlord feature. As described in the previous section, many participants mentioned that one of the details they want to know about houses or apartments is the quality of the landlord. Many participants expressed having difficulties with discrimination from unwelcoming landlords that made finding a new housing unit difficult. As a result, we suggest that there be a link be added to the available housing feature so that a participant can read reviews by previous tenants of that space or other spaces that the same landlord manages. One website that could be attached is ratemylandlord.com (see image of website below) . This added feature would address the repeated concerns expressed in the Connecticut survey, and with one of NEAT’s interviewees, and would ensure that the user would be given a full explanation of what living in a neighborhood and potential home would be like.

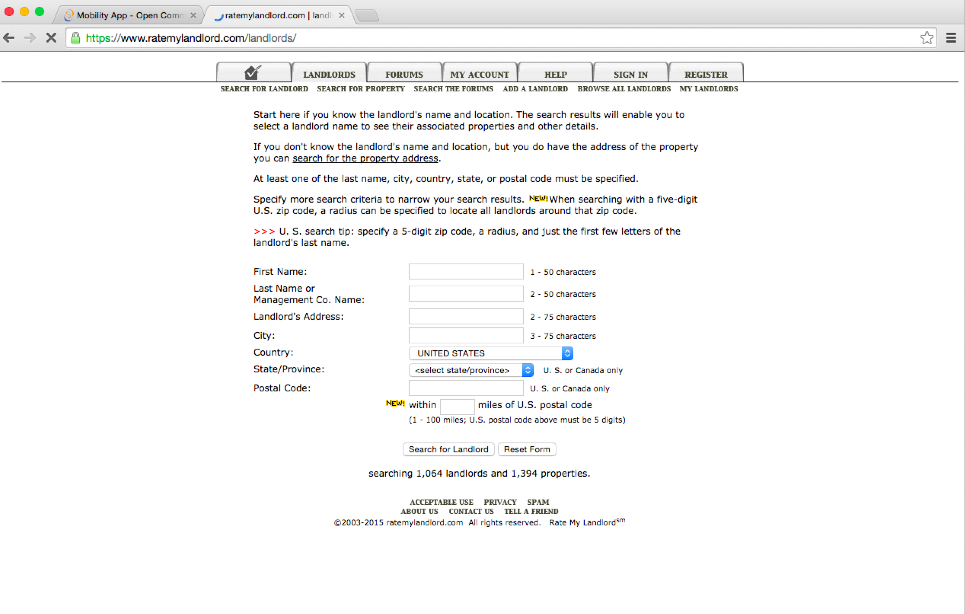
                                                            Figure 6: Ratemylandlord.com


At the end of the tutorial, a participant would click the “next” button, leading him/her to the Mobility App complete with the new amenities mentioned previously. The video tutorial would make the Mobility App more accessible for all users, especially technologically challenged users, and would help the app become more efficient in helping low-income Section Eight voucher recipients find a more upwardly mobile neighborhood and home to live in.

QUIZ

The second major suggestion to enhancing the Mobility App’s mission of “help[ing] people with government housing subsidies interested in an opportunity move find homes within thriving communities” would be to add in a quiz component.  The idea of this quiz is to not only make the app more readily accessible in that it would clearly visualize and explain, step by step, different opportunity levels, but also to individualize a participant’s search and to cater to the specific needs of a potential mover. As is clear from the many responses in the Connecticut Fair Housing Center’s report, “Housing Mobility: What Do Housing Voucher Recipients Want?” people looking to move desire a diverse array of commodities and assets such as level of safety, a “racially mixed” neighborhood, or a locale with schools that have special needs programs, just to name a few. 11 In other words, the inclusion of a quiz would make the app more applicable and would produce results that are actually representative of what a participant would look for in choosing individualized housing.

The first part of the quiz would ask a participant to insert a current or recent address with the intention of then providing information on opportunity in this location.


Macintosh HD:Users:ifine:Desktop:Screen Shot 2015-05-02 at 1.29.24 PM.png


                           Figure 7: Opening Screen of Mobility Opportunity Housing Quiz

Then, the Mobility App would locate the inserted location on the map to visually elucidate the opportunity level and various neighborhood amenities nearby (or lack thereof).

Macintosh HD:Users:ifine:Desktop:Screen Shot 2015-05-02 at 1.30.59 PM.pngMacintosh HD:Users:ifine:Desktop:Screen Shot 2015-05-02 at 1.31.12 PM.png 
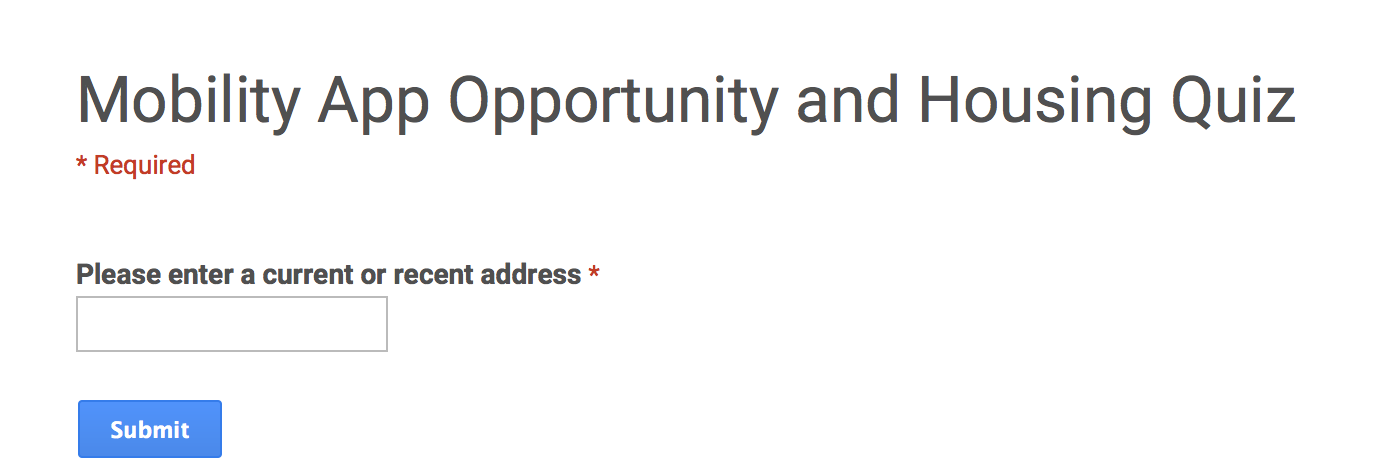
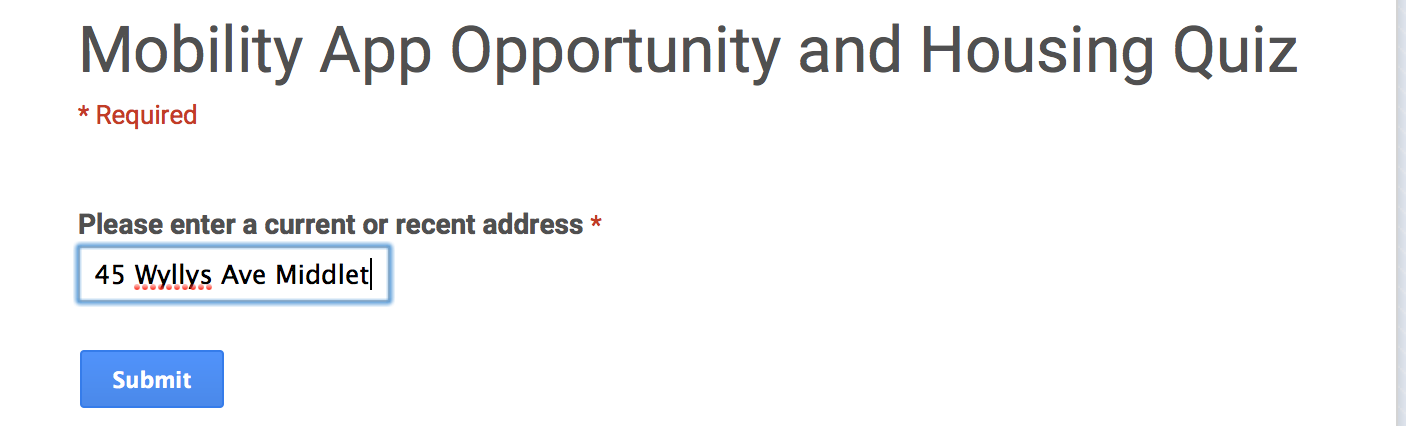
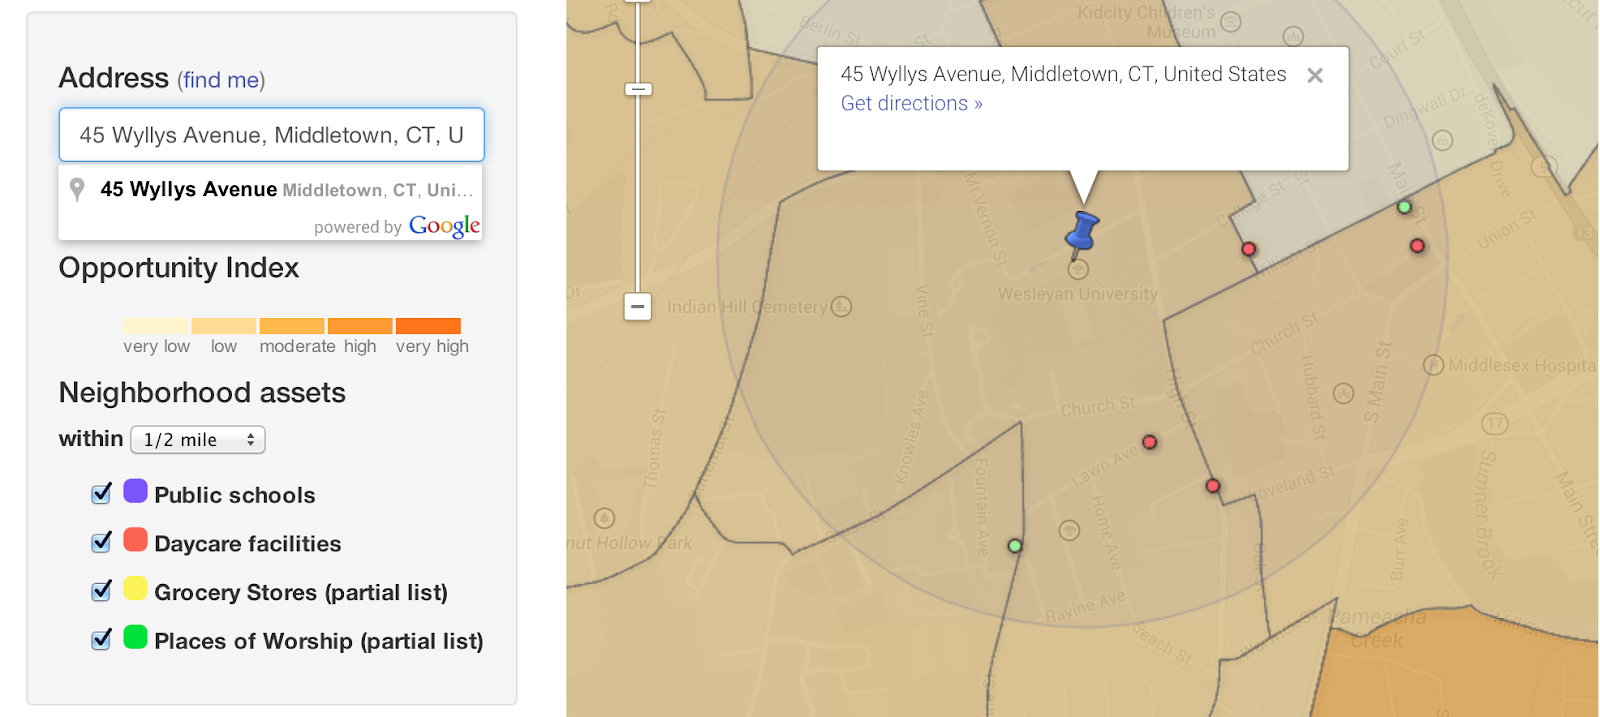
Figure 9: In Depth Visualization of How Location Would Be Shown In Mobility App Quiz
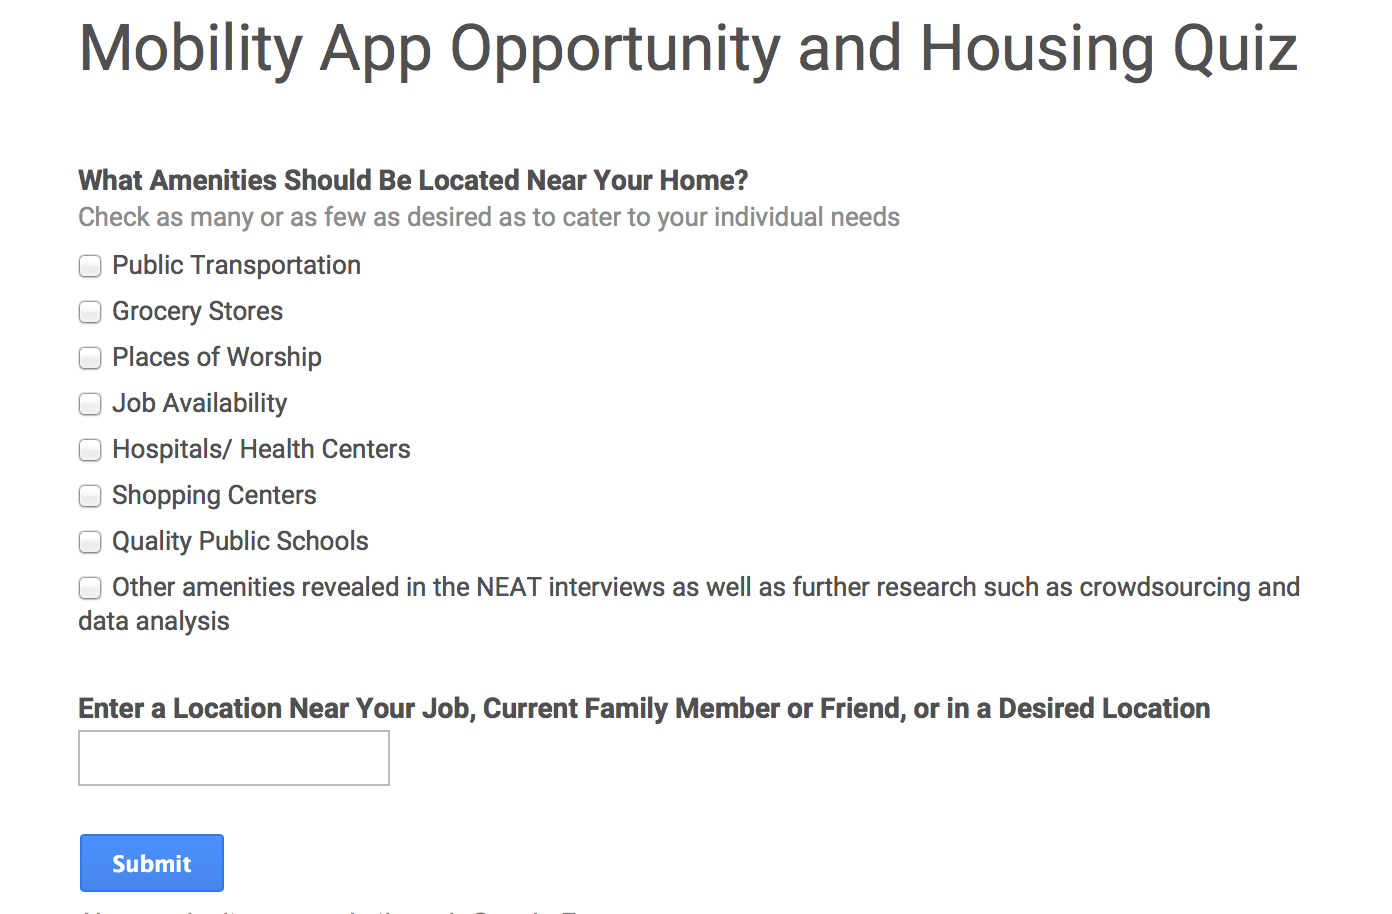
After, this visualization, the quiz would continue by asking a participant to check off various amenities that are important to him/her such as but not limited to transportation, hospitals, job availability, places of worship, grocery stores, shopping centers, etc. In order to generate a full list of significant amenities, further testing of the current tool would be necessary. Further, the quiz would also ask participants to enter a location near their job or a family/friend’s home or a desirable location. The idea behind asking a participant to enter a location near a job or loved one is to reduce the time commuting and help create a more stress-free life. Individual transportation, as mentioned above, is not something readily accessible by many of the NEAT or Connecticut Fair Housing Survey participants and, as a result, high quality public transportation is something they rely on heavily. Next, the app would show the location a participant has just entered on a map with their chosen amenities.

(Note from the instructor: Students were ask to write essays under 2500 words, which would be about here. Evaluators may read as much as they wish, but should not rate the essay beyond this point.)

Macintosh HD:Users:ifine:Desktop:Screen Shot 2015-05-02 at 2.17.16 PM.png

                 Figure 10: Visualization of Mobility App Opportunity and Housing Quiz

 However, simply asking a participant to insert a desirable address is not enough in supporting movement into more thriving communities. Therefore, based off of the information given in the quiz, the app would then compile a list of neighborhoods or towns that were in a higher opportunity index than the original address entered but that also had all the amenities that the participant listed were important to him/her and were close to the desired address. The app would provide this list in full as to give a participant as much choice as possible. Yet, one of the biggest downfalls with the original design of the app is that it fails to provide actual listings for available housing. Therefore, in this new design, the app would provide external links to rental homes (from Trulia or Zillow for example) as well as to ratemylandlord.com in order to make finding affordable housing as streamlined and pleasurable as possible.

When coming up with the idea of the quiz, one of the ideas discussed was whether or not to include a section that asked for a participant’s income and/or his/her desired rent. However, after consideration, it seemed that although this question initially makes sense in order to ensure that people were not spending beyond their means, considering Section 8 housing vouchers, inquiring about a participant’s income or rent constrictions is counterintuitive. Moreover, the Mobility App aims to close arbitrary socioeconomic stratification. Therefore, we would not want a participant to feel marginalized or forced into certain locations based off of money constrictions that may not even be relevant in light of subsidies.

The point is to keep choice as open and participant-centric as possible.

CONCLUSION

As the Open Communities Alliance Mobility App currently stands, it does not fulfill its mission.  The Mobility App attempts to assist Connecticut residents with housing subsidies such as Section 8 vouchers find homes in new locations with higher opportunity levels than his/her current home. While the Mobility App is a good start to attenuating the issue of socioeconomically and racially stratified housing, it does not provide enough resources to make meaningful change. However, with a few simple additions and edits, the app could be more applicable, pertinent, and easy to use. The inclusion of an Introduction Video would show those new to the app (and potentially not comfortable regularly using computers) how to interact with it and what each facet and aspect of the app means and how they function. This would ensure comprehension. Further, the inclusion of a Quiz would help personalize a participant’s experience with the app to create housing choice catered to individual needs and therefore more useful in terms of suggesting relevant housing. On a more microscopic scale, the list of neighborhood amenities should be expanded to include (but not be limited to) public transportation, location of hospitals, and proximity to shopping centers. Most importantly, as the app stands, it does not assist participants in “find[ing] homes within thriving communities” because it does not offer any links to available real estate to rent in these new and higher opportunity levels.  Therefore, the most critical, and perhaps most basic, change that the redesign should address is the inclusion of a list of or external links to open homes.

If the Open Communities Alliance Mobility App included the aforementioned redesign suggestions, we believe the tool could assist those looking to move find long-term and stress-free housing within his/her budget, desired location, and specific amenities.

Notes:

  1. For more information on how these thriving neighborhoods are defined, see the methods section for the Mobility App.
  2. Ibid.,
  3. “Mobility App Participant Spreadsheet,” Jack Dougherty, accessed May 1, 2015, https://docs.google.com/spreadsheets/d/1dbwO9jooBxvxZIuLaZzwAXX21LxRHy7k_jfeKadpIKk/edit#gid=0.
  4. “Mobility App,” Open Communities Alliance, accessed May 1, 2015, http://www.ctoca.org/mobility_app.
  5. “Mobility App Participant Spreadsheet,” Jack Dougherty, accessed May 1, 2015, https://docs.google.com/spreadsheets/d/1dbwO9jooBxvxZIuLaZzwAXX21LxRHy7k_jfeKadpIKk/edit#gid=0.
  6. Ibid.,
  7. Anonymous Participants, Interviewed by CSPL 341, NEAT Headquarters: Middletown, CT, April 15, 2015.
  8. Connecticut Fair Housing Center, “Analysis of Impediments to Fair Housing Choice 2015”, Government of the State of Connecticut Website, Accessed May 1, 2015, http://www.ct.gov/doh/lib/doh/analysis_of_impediments_2015.pdf.
  9. Ibid.,
  10. Jack Dougherty,”Mobility App Interview Guide.” Paper presented at the CSPL 341 Choice- A Case Study in Education and Entrepreneurship class at Wesleyan University, Middletown, Connecticut, April 18th, 2015.
  11. For more information on the different responses, see Section 4 of the report entitled “Your Ideal Neighborhood”

Are Choice Schools Worth The Money?

Posted on

School Choice: Future of New Magnet Schools Uncertain1 – a headline in the CT Mirror early this year questions the worth of school choice after the US Department of Education reported that Connecticut’s public school enrollment is projected to decrease by 5% over the next decade. 2 The debate around choice schools, which consist primarily of magnet and charter schools, is often dominated by intellectual considerations of educational equity. Waiting for Superman, a pro-school choice documentary, depicts the failures of the American public education system and glorifies charter schools as the only way out for underprivileged children. Choice proponents advocate school choice as a fundamental right that parents should have to advance their children’s education, while choice opponents argue that choice schools benefit a small proportion of students at the expense of the majority. However, policy decisions are often made from both political and economic standpoints, and it is imperative to address them in the context of school choice.

Looming debt problem

One of the reasons why choice school expansion is up in the air is due to the massive state budget deficit. Using Census Bureau’s 2012 population estimates, the state debt is equal to $16,178 for every resident of a U.S. state. 3 But if we base the state debt in terms of percentage of Gross State Product, Connecticut ranks seventh on the list of most indebted states with 49% as compared to the state average of 33%.

Screen Shot 2015-05-12 at 11.21.51 AM
Source: Eucalitto, Cory

The budget deficit is projected by the Office of Fiscal Analysis to exceed $1.3 billion in 2015-2016 and $1.4 billion in 2016-2017. 4 With this economic landscape in mind, it is worth questioning the decision to increase spending for choice school expansion. Can the state afford to expand choice schools at a time when district schools are in need of more funding? This is a question that the Connecticut General Assembly has to answer, and this piece will offer an economic perspective on choice school spending and deliver proposals for the state legislature to promote educational equity in a fiscally responsible manner.

While policymakers may point out that painting an ugly picture of state budget deficit argues against costly expansion of choice schools and at the same time warrants a reduction in educational spending, I seek to lay out my argument more explicitly by saying that I am not advocating for less spending on education. What I am suggesting is to shift funding away from choice school expansion towards district schools that require more funding per pupil. Since the state budget deficit is substantial, every dollar counts, and every additional dollar should go to the most needy district schools, where the greatest positive impact can be made.

Charter schools cost more

Choice proponents claim that choice schools are able to serve their students at a much lower cost, which might imply that they are more cost-effective in providing the same if not better quality of education than their district counterparts. Based on data available online, I have decided to show graphs for school expenditures in 2008-2009, a period where graphs for magnet, charter, and district schools are readily available. After excluding expenditures for transportation and special education services, Prof. Bruce D. Baker, a professor of education at Rutgers University, made an observation that deserves attention from choice proponents. The following graph compares the expenditure-per-pupil between charter and district schools in Connecticut.

slide14
Source: Baker, Bruce

Data points for district schools revolve around $10,000 per pupil, while most data points for charter schools are located above $10,000 per pupil. This shows that charter schools have received more state funding than district schools. Prof. Baker excluded transportation and special education expenditure for a fair comparison between charter and district schools because transportation and special education expenses for charter school students are booked as district expense. In reality, charter schools are even more costly to run if they do not remit transportation and special education expenditure back to the district.

slide111
Source: Baker, Bruce

Since district schools incur less expenditure-per-pupil, shifting funding away from choice schools towards district schools is an attractive and economical option for Connecticut. To showcase a more specific comparison between district and charter schools, the graph above illustrates spending between a district school and a charter school in Hartford and Bridgeport. If we look at the bars that exclude transportation and special education services, charter school spending per pupil is actually higher than district school spending per pupil.

Impact of charter schools

Since charter schools do not present a cost benefit for the state, perhaps the state could justify the increase in spending for charter schools through the positive impact on student performance. The National Charter School Study conducted by CREDO 5 revealed that students in charter schools have shown an upward trend in their performance over the past five years. However, the study did not address the fact that charter schools might be cream skimming, a process of selecting more academically able students for enrollment. This selection bias is accounted for in another study of charter schools 6 by the National Center for Education Evaluation, in which students who won the lottery were compared with students who lost the lottery, eliminating the selection bias of intrinsic motivation. They found that on average, charter schools did not have a statistically significant impact on student achievement. The following graph shows the substantial increase in state funding for charter schools over a 14-year period, and every increase in charter school funding represents an opportunity cost for district schools that could have used the funds to serve more disadvantaged students. Given the fact that the impact of charter schools is questionable even when the state has increased funding over time, it does not make economic sense to expand the type of schools that will benefit only a small proportion of students, if any benefit can be found at all.

Screen-Shot-2014-04-02-at-7.06.33-PM
Source: Thomas, Jacqueline

Impact of magnet schools

Magnet schools are the state’s go to solution to comply with the Sheff mandate of at least 25% white enrollment. Casey D. Cobb, a professor of educational leadership at the University of Connecticut, Robert Bifulco, Associate Professor of Public Administration at Syracuse University, and Courtney Bell, an associate research scientist at the Educational Testing Service, conducted research 7 on the improvement in academic performance of students in Connecticut magnet schools in 2009 by comparing test scores for city students who attended magnet schools and those who applied but did not get in. Even though the report concludes that interdistrict magnet high schools have positive effects on mathematics and reading achievements of urban students, I find it difficult to draw reliable conclusions due to the small sample size and the potential for unobservable selection bias. If similar results were obtained after using a larger sample size, we need to ask ourselves whether millions of state dollars spent on magnet schools could have been used by district schools to produce similar if not better results.

Screen Shot 2015-05-03 at 8.20.57 PM
Source: Thomas, Jacqueline

Magnet schools are expensive 

State funding for magnet schools has increased drastically over time, and with features such as specialized sciences or arts programs, magnet schools also cost more to run. Using Connecticut Department of Education data, the CT Mirror reported that magnet schools in Hartford region incur a higher expenditure-per-pupil at an average of $12,845 per pupil, which is about $2,500 more than the average expenditure-per-pupil for Connecticut district schools.

MagSchool
Source: Frahm, Robert A.

Since magnet schools cost more than charter schools and district schools, in order to justify an increase in funding from the state, the rate of return of magnet schools has to be substantially greater than suggested in the Bifulco paper. More complete research involving a larger sample size of schools should be conducted to evaluate the effectiveness of magnet schools and the costs associated to run them.

Choice schools under-serve needy communities

With the questionable impact of choice schools in mind, more funding should be given to cash-strapped district schools given the fact that they enroll more English language learners (ELL) and special education students who need access to more costly resources. Robert Cotto Jr., the Director of Urban Educational Initiatives, and Kenneth Feder, a policy analyst at Connecticut Voices for Children, reported 8 that magnet and charter schools have a lower percentage of ELL and special education students.

Screen Shot 2015-05-03 at 8.25.40 PM
Source: Cotto & Feder

The lower percentage of ELL could result from cream skimming practices or the lack of conducive environments for disadvantaged students. In a CT Mirror article 9, Jenifer Colon, an eighth grader from Puerto Rico said that magnet schools “are not really focused on English language learning students,” which explains why it made sense for some students like her to attend a district school to learn the language. Cotto’s report also found that charter schools are hyper-segregated by race, serving more than 90% minority students.

Screen Shot 2015-05-03 at 8.27.48 PM
Source: Cotto & Feder

In all four towns on the graph above, charter schools have the highest percentage of student body that identified as students of color. Since it is not clear whether charter schools improve student performance, the lack of racial integration should be a strong signal to the state that perhaps charter schools are not worth further investments.

Expand Open Choice program

Despite the fact that Connecticut could ill afford to spend more money on choice school expansion at a time when limited conclusions can be drawn about choice school impact on educational outcomes, the proposal to shift funding from choice schools towards urban district schools may still be unpopular in the Connecticut state legislature, which is dominated by suburban lawmakers who represent constituents less inclined to want their taxes spent on more urban children. My first proposal is to increase financial incentives for suburban district schools to enroll more urban students through the Open Choice program. Suburban districts get an average of $2000-$6000 from the state for every urban student that they enroll, which is substantially lower than the average expenditure per pupil for magnet schools in meeting the court-mandated Sheff requirement. In light of the fact that mandatory participation in the program is “not on the table right now” 10, the state should increase funding for Open Choice by another $3000 or more per pupil, which is still more cost effective than choice school spending, to improve educational resources for current district schools. This would also promote racial integration and allow a higher proportion of urban students to benefit from richer educational resources that suburban district schools possess. Since suburban schools would be incentivized to enroll more urban kids, the increase in state funding would benefit both suburban and urban students and dispel some resistance from suburban legislators. Educationists could then study educational models of successful suburban district schools and replicate them in the city to help improve urban student performance. I should also note that Open Choice might incur higher transportation expenses that may not appear in the district schools’ budgets, since the state bears those costs. However, this caveat applies to choice schools as well as they require transportation expenditure that would be incurred by districts.

Funding disparity between districts

We need to be aware of the funding disparity between school districts, because Open Choice is likely to increase funding for rich districts more so than for poor districts. This may be a bitter pill that policymakers have to swallow, as suburban lawmakers have to be incentivized to pass a bill that would benefit district schools in both suburbs and cities. The following graph illustrates the most advantaged school districts and the most disadvantaged school districts in Connecticut.

slide51
Source: Baker, Bruce

Ironically, two of the most disadvantaged school districts, Bridgeport and New Britain, have higher percentages of students who are ELL, who receive FRPM, or identify as Black or Hispanic, but the nominal current expenditure per pupil and average teacher salary is relatively lower than their suburban counterparts.

Increase funding for under-resourced district schools

Ultimately, the main driver behind educational inequality in Connecticut still lies with urban district schools that require the most state funding. My second proposal, albeit less popular than the first one if proposed as a bill in the state legislature, is to directly allocate more funds to urban district schools. Based on the previous graph, the expenditure per pupil in the most disadvantaged districts, which happened to be urban districts, is significantly lower than advantaged districts. Even though channeling more funds into district schools should improve educational resources, improving student performance is not a direct result of simply spending more money. Drawing on a national longitudinal dataset collected over 12 years, W. Norton Grubb, the author of Money Myth 11, makes a crucial distinction between “simple” resources such as higher teacher salaries and “abstract” resources such as school culture that cannot be readily bought. While an inefficient use of state funds that improve only simple resources will not necessarily improve performance, it does not detract from the fact that on average, expenditure per pupil is positively correlated with improved student outcomes. 12 While the effect of increased financial resources may be larger for some students than others, “money matters, resources that cost money matter, and more equitable distribution of school funding can improve outcomes”.

Ethical implications

Open Choice Program could potentially draw more bright and motivated students away from urban schools towards suburban schools, and worsen the average student performance in urban schools. Moreover, the burden of busing through the Open Choice Program falls primarily on minority urban students as they have to experience long bus rides every morning to get to suburban schools. Many white suburban students do not have great incentives to travel to urban schools for their education and could comfortably go to suburban schools in their neighborhoods, escaping the burden of busing. Magnet schools in suburbs and cities distributed the burden of busing more evenly, as suburban students would bear the burden of long bus rides to get to urban magnet schools. However, if funding for urban district schools significantly exceeded funding for suburban district schools, more suburban parents would be incentivized to send their children to enroll in urban schools to take advantage of greater educational resources that arise from higher expenditure.

Choice school expansion may not be the way forward to achieve educational equity for many children in Connecticut. Increasing funding for choice schools reveals a dark implication that we no longer believe in district schools as the hallmark of American public education. It reveals our preference for abandoning poor district schools and leaving children trapped in those schools to fend for themselves while a small group of students well-poised to take advantage of school choice leave their struggling classmates behind. We need to start questioning the effectiveness of choice schools in providing quality education to our children and to pay more attention to district schools that have been pushed to the sidelines. Policies should aim to achieve educational equity for as many students as possible rather than to concentrate on improving academic outcomes for a small subset of the student population at the expense of the majority. Are choice schools really worth our money? The answer to this question contains implications for efforts that could reduce the income gap in Connecticut. After all, if policymakers were able to reform struggling district schools into exemplary providers of first-rate public education, Davis Guggenheim, director of Waiting for Superman, would have less of a sob story to tell.

Notes:

  1. Thomas, Jacqueline Rabe. “School Choice: Future of New Magnet Schools Uncertain | The CT Mirror.” January 6, 2015. http://ctmirror.org/2015/01/06/school-choice-future-of-new-magnet-schools-uncertain/.
  2. Hussar, W.J., and Bailey, T.M. (2013). Projections of Education Statistics to 2022 (NCES 2014-051). U.S. Department of Education, National Center for Education Statistics. http://nces.ed.gov/pubs2014/2014051.pdf.
  3. Eucalitto, Cory. “State Budget Solutions’ Fourth Annual State Debt Report > Publications > State Budget Solutions.” January 8, 2014. http://www.statebudgetsolutions.org/publications/detail/state-budget-solutions-fourth-annual-state-debt-report.
  4. The Day. “The Day – Budget Cuts Costs, Breaks Promises.” February 19, 2015. http://www.theday.com/article/20150219/OP01/302199586.
  5. Center for Research on Education Outcomes (CREDO). 2013. National charter school study 2013. Stanford, CA: CREDO. http://credo.stanford.edu/reports/MULTIPLE_CHOICE_CREDO.pdf.
  6. Gleason, Philip, Melissa Clark, Christina Clark Tuttle, and Emily Dwoyer. The Evaluation of Charter School Impacts: Final Report. NCEE 2010-4029. National Center for Education Evaluation and Regional Assistance, 2010. http://eric.ed.gov/?id=ED510573.
  7. Bifulco, Robert, Casey D. Cobb, and Courtney Bell. “Can Interdistrict Choice Boost Student Achievement? The Case of Connecticut’s Interdistrict Magnet School Program.” Educational Evaluation and Policy Analysis 31, no. 4 (December 1, 2009): 323–45. doi:10.3102/0162373709340917.
  8. Cotto, Robert, and Kenneth Feder. “Choice Watch: Diversity and Access in Connecticut’s School Choice Programs | Connecticut Voices for Children,” April 2014. http://www.ctvoices.org/publications/choice-watch-diversity-and-access-connecticuts-school-choice-programs.
  9. Thomas, Jacqueline Rabe. “Despite Robust Options, Thousands Pass on School-Choice Lottery | The CT Mirror,” December 10, 2014. http://ctmirror.org/2014/12/10/thousands-pass-on-school-choice-lottery-despite-robust-options/.
  10. Thomas, Jacqueline Rabe. “Efforts to Desegregate, Expand School Choice a Challenge with Looming Deficits | The CT Mirror,” November 2, 2012. http://ctmirror.org/2012/11/02/efforts-desegregate-expand-school-choice-challenge-looming-deficits/.
  11. W. Norton Grubb, The Money Myth : School Resources, Outcomes, and Equity (New York: Russell Sage Foundation, 2009).
  12. Baker, Bruce. “Does Money Matter in Education? | Shanker Institute.” Accessed May 3, 2015. http://www.shankerinstitute.org/resource/does-money-matter.

No Choice in an “Open Choice” System: English Language Learners Underrepresented and Underfunded in Connecticut’s Choice Schools

Posted on

HISTORY

In the 1960’s, the state of Connecticut began bussing urban students to suburban schools, as a part of a school desegregation plan known as “Project Concern.” More than two decades later, Hartford schools were still predominately composed of students of color, while schools in the surrounding suburbs were predominately white. In 1989, Elizabeth Horton Sheff filed a lawsuit against Connecticut’s then-governor, Richard O’Neill, calling attention to the segregation and inequality of opportunity that characterized Hartford Area schools. Though it took eight years, Connecticut’s Supreme Court finally ruled in her favor, and mandated that the state must attempt to ameliorate this segregation. Despite this victory, not much changed in the years to come. So, in 2000, the plaintiffs returned to the courtroom. The resulting settlement called for expanded (voluntary) participation in the “Open Choice” system (previously known as “Project Concern”) and the formation of additional, public charters and themed magnet schools within Hartford open to students from both Hartford proper and the suburbs. In the 2011-2012 school year, just under 50,000 students were enrolled in one of Connecticut’s choice programs – the majority of these students attended one of 63 interdistrict magnet schools.[1] This new system has been hugely successful in its attempts to promote racial integration within schools[2] – it has even been referred to as “the only successful effort to produce a new legal framework to deal with the reality of metropolitan segregation.”[3] On the other hand, it has been far from inclusive of the state’s large population of nonnative English speakers and has a long way to go before reaching its goal of equal educational opportunity for all students.[4],[5]


ELL DISPARITY IN CHOICE SCHOOLS: WHAT THE NUMBERS SAY

The number of English language learners (ELL) in Connecticut is immense, and it is growing rapidly. In 2011-2012, over 30,000 students were considered to be “ELL” (and it is likely that this is an underestimate), making up 5.4% of the state’s total student population.[6] Despite their large presence, ELL students are severely underrepresented in Connecticut’s public choice schools (specifically in magnet, charter and technical schools). In the 2011-2012 school year, 76% of public charters, 64% of magnets, and 56% of technical schools in the Greater Hartford Area (GHA) had substantially lower enrollment percentages of ELL students than the local, traditional public schools in their districts.[7]

Figure 1 Figure 1: Differences in ELL enrollment at three types of choice schools as compared to local public schools. Reprinted, (Cotto & Feder, 2012).[8]

Unfortunately, choice schools have not become any more inclusive in the years since Cotto’s Report. They still enroll significantly lower percentages of ELL students than the traditional public schools in their respective districts. 2013-2014 data from 13 of the 28 GHA districts (as much data as was available) reveal that ELL students are still underrepresented, and especially so in magnet schools. ELL students are no more represented in magnet schools than they were two years ago, and in some cases, they are less so. Currently, the average ELL student-composition across the GHA is 10% for district schools, but only 4% for magnets. To identify districts that did a better job in encouraging ELL enrollment, it is most useful to look at the relative proportions within a particular district, rather than looking at the GHA as a whole. Danbury (25%), Hartford (22%), New London (22%) and Windham (26%) district schools enroll the highest percentages of ELL students. Danbury magnet schools, however, enroll 17% fewer ELL students than their district counterparts; this represents the largest enrollment gap in the GHA.[9] Charter and technical schools also tend to under-enroll ELL students. The average composition of ELL students among Bridgeport’s four public charter schools is only 4%.[10]

 Figure 2

Figure 2: Changes in the mean percentage of student body made up by ELL students at three types of choice schools, as compared to 2014 Connecticut district average. Reprinted with permission from “School Choice Data Analysis” project by Leib Sutcher and Claire Bradach.

When it comes to school choice, ELL students have almost none. Most choice schools do not have bilingual education programs. As of February 2015, less than half of the state’s students requiring ELL support were actually receiving it (approximately 9,897 out of 22,914).[11] As a result, ELL students in Connecticut are, on average, five grade levels below their non-ELL classmates.[12] Based on 8th grade math and reading scores, the achievement gap for ELL students in Connecticut is the worst and second-to-worst in the country.[13] There exist two possible solutions to this devastating achievement gap, the first of which relies on changes to existing policies regarding bilingual education programs.


SOLUTION #1: POLICY CHANGES

This past January, a group of concerned stakeholders including teachers, administrators, and members of the Latino and Asian communities held a forum to address the lack of resources for bilingual education. Luckily, a few legislators (find out names) listened to their suggestions and worked with them to write what because known as House Bill 6835, “An Act Concerning English Language Learners.” Aiming to better educational opportunities for ELL students in Connecticut, the original bill proposed changes to existing policies. Two recommendations, in particular, are ones that, if passed, could potentially have a significant and positive impact on the under enrollment of ELL students at choice schools.

Currently, the law goes that only schools with twenty or more ELL students must offer a program of bilingual education[14]. On top of that, to say bilingual education is loosely defined in the statutes would be a gross understatement. H.B. 6835’s originally called for a decrease in this threshold, from twenty students to six. Based on 2013-2014 enrollment data, this decreased minimum would lead to the new bilingual education programs in at least forty additional choice schools in the Hartford Area. This amendment might have even incentivized schools to try to recruit and enroll more English language learners in order to lock down that funding, as well as to increase overall diversity of the school (schools are penalized if they are not composed of at least 25% and at most 75% minority students). After major dissent was expressed at a public hearing On (date), the Joint Education Commission held a public hearing, at which much dissent was expressed, due to some peoples’ financial concerns. Connecticut spends a mere $1.9 million dollars on over 30,000 ELL students every year: a number that comes out to around $50-$60 per student[15] (fact check). Nonetheless, in the resulting substitution bill, the proposed amendment to lower the twenty-person minimum had been thrown out.

The Connecticut Statute for Education also limits the amount of time that a student is allowed to spend in a bilingual education program to just thirty months – If the student is within 30 months of high school graduation, they are not eligible for the services at all. A second, important feature of H.B. 6835, that did make it into the substitution bill, was a two-fold increase in this time frame, from thirty to sixty months. Just last week, on April 29th, the Appropriations Committee of the Connecticut General Assembly voted 36 to 20 in favor of the Joint Education Committee’s substitution bill. [16] H.B. 6835 still has a long way to go – it must pass through both House and Senate before its fate is sealed.


SOLUTION #2: DUAL-LANGUAGE MAGNET SCHOOLS

In Connecticut, it’s easy enough to find a magnet school with just about any theme – there are magnet schools for arts, for aerospace and engineering, and for global citizenship. In New Haven, there is a very special magnet school called the John C. Daniels School (JDS). JDS is a dual-language immersion school, and with 19% of its students being ELL, a proportion one percentage point higher than the district average and more than twice that of any other interdistrict magnet school in New Haven.[17] So, if only 19% of students at JDS are ELL, then who are the other 81%? They are native English speakers, and they have chosen to go to JDS to learn Spanish. At JDS, half of classes are taught in English, and half are taught in Spanish. Then, in middle school, students can elect to take either Mandarin or continue on with Spanish.[18] JDS students consistently score above the district average in every subject, with very few exceptions. In 2013, 97% of sixth graders passed the math section of the CMT, putting them ahead of not only their district, but the entire state of Connecticut.[19]

Figure 3

Figure 3: View of main entrance at John C. Daniels Interdistrict Magnet School of International Communication.[20]

JDS is not the only dual-language schools in Connecticut – the Dual Language and Arts Magnet Middle School in in Waterford, and the Regional Multicultural Magnet School in New London have also been both popular and successful. The creation of additional dual-language magnet schools based on existing models is the best way to address some of the disparities in educational opportunities for English language learners, and it is not so far fetched. A 2013 “Feasibility Study of Two-Way Language Programs,” led by the Superintendent of Hartford Public Schools, revealed great amounts of community and business support, and even potential state interest and funding. Dual-language instruction has been shown to contribute to a child’s cognitive development, language skills, career readiness and general global awareness.[21]

With the creation of more bilingual education schools comes the problem of staffing. Connecticut’s stringent certification requirements for bilingual education teachers work against the goal of serving the needs of the state’s large and growing ELL student population. To become certified in bilingual education, a teacher must go to through a fifth year of schooling. However, once certified, they are not paid any more than regular teachers. The state also does not recognize out-of-state certification – only teachers who received their bilingual education certificates in the state of Connecticut are eligible to teach. A bill that is currently on the senate calendar, Bill 1102, addresses these stipulations. If it passes, establishing more of these themed-magnets will become a more feasible prospect: more teachers mean more programs in more schools, and more options for ELL students.

While it is possible that the under-enrollment of ELL students in choice schools may not be the root of the problem, the remediation of this enrollment disparity may have the potential to turn around the achievement gap for English language learners in the state of Connecticut, and both policy changes and the creation of new, dual-language magnet schools are two, very promising solutions.


References


[1] Cotto, R. & Feder, K. (2014). Choice Watch: Diversity and Access in Connecticut’s School Choice

Programs. Connecticut Voices for Children. New Haven, CT.

[2] Rabe Thomas, J. (2013, November 26). Nearly half the students from Hartford now attend

integrated schools. Retrieved May 3, 2015, from http://ctmirror.org/nearly-half students-hartford-now-attend-integrated-schools/.

[4] See, Plurality Opinion of the State Supreme Court, Connecticut Coalition for Justice in Education Funding vs. Rell. March, 2009. Available at http://ccjef.org/litigation.

[5] Miller, C. & How, H. (2015, March 6). “Inequality in ELL-Enrollment at District versus Magnet Schools in the Greater Hartford Area.  Available at https://docs.google.com/document/d/1n0kDYiXIWSq17hSQl5aW8ecmKwZb6J-3PhHsdfHkffg/edit

[6]Hartford Public Schools. Two-Way Language Program Feasibility Study, January 3, 2013. http://www.achievehartford.org/upload/files/DualLanguageDiscussion—20130124123318926.pdf.

[7] Ibid 1.

[8] Ibid 1.

Programs. Connecticut Voices for Children. New Haven, CT.

[9] Ibid 5.

[10] MacDonald, A. (2015, March 6). “Angus’s Exercise D.” Available at https://docs.google.com/document/d/1CPD_xgiWQFqSIPHbyRDXEHWRZ_ti61Qv8P-FhuXRxwE/edit

[11] Zimmerman, E. (Director) (2015, February 25). Testimony before the Education Committee on Proposed S.B. No. 944 and H.B. 6835. Commission on Children. Lecture conducted from State of Connecticut General Assembly, Hartford, Connecticut. Available at

http://www.cga.ct.gov/2015/eddata/tmy/2015SB-00944-R000225-Elaine%20Zimmerman,%20CT%20Commission%20on%20Children-TMY.PDF.

[12] ConnCan: Connecticut Maintains Worst-in-the-Nation Achievement Gap. (2013, November 8). Retrieved May 3, 2015, from http://www.conncan.org/media-room/press-releases/2013-11-conncan-connecticut-maintains-worst-in-the-nation-ac

[13] Boesner, B. (2013, November 7). 2013 NAEP Snapshot [PDF document]. Retrieved from http://webiva-downton.s3.amazonaws.com/696/f8/4/1276/4/2013_ConnCAN_NAEP_Snapshot.pdf.

[14] http://www.sde.ct.gov/sde/cwp/view.asp?a=2618&q=321160

[15] Rodriguez, O. (2015, May 1). Background Information on H.B. 6835 [Telephone interview].

[16] Appropriations Committee – Vote Tally Sheet. (2015, April 29). Retrieved May 3, 2015, from http://www.cga.ct.gov/2015/TS/H/2015HB-06835-R00APP-CV33-TS.htm.

[17] Ibid 9.

[19] John C. Daniels School Test Scores – New Haven County, CT. (n.d.). Retrieved May 3, 2015, from http://www.realtor.com/local/John-C-Daniels-School_New-Haven_New-Haven-County_CT/test-scores

[21] Ibid 6.

20 Ibid 6.


Are They True to Their Missions? An Examination of the Portrayal of Choice School Communities in the Hartford Area

Posted on

There has been much criticism of the lottery, the convoluted application processes and other creaming tactics of charter schools to recruit and maintain a high-achieving, highly motivated and often hyper-segregated student body (e.g., Welner, 2013). Specifically in the Hartford metropolitan region, an investigation of parental perception of choice schools—specifically interdistrict magnet schools—detected a prevalent sentiment that choice schools create community divisions due to the competitive nature of the lottery (Debs, 2015). The present thematic analysis shows that the presentation styles and patterns of verbal communication between charter school and interdistrict magnet school representatives and families at school choice fairs and open houses can also be extremely influential in shaping a particular type of school community. Across the field notes from six different school choice events in the Hartford metropolitan region collected by Wesleyan University students in February 2015, school representatives emphasized building specific types of school communities in explicit and subtle ways.

Since magnet schools by definition unite diverse families from different locations to ensure integrated student bodies, fostering an inclusive and welcoming school community would seem like a necessary selling point. On the other hand, many charter schools, which often prioritize closing the achievement gap, are likely to emphasize a school community that appeals to a particular targeted demographic (e.g., low income minority students). Therefore, the question becomes, are the types of communities emphasized by school representatives at school choice events reflective of the respective school mission and/or vision statements? Rhetoric of school representatives from several interdistrict magnet schools and one charter school from a regional charter network in conjunction with the language of school mission and/or vision statements provides evidence for an array of choice school communities that may subtly or directly seek to attract particular types of students and further or inhibit integration.

Diversity & Community

While school community is often directly or indirectly addressed by choice school representatives in their pitches to prospective families, not all representatives define school community based on the same criteria. The most intuitive type of school community expressed would be based on the student body demographics (i.e., percentage of minority students, students who qualify for free and reduced price meals, students who are English Language Learners (ELL) or have a documented disability). Yet, seldom did the school representatives address this information directly. Observations from the Regional School Choice Office (RSCO) Fair mentioned that school representatives referenced the Sheff v. O’Neill ruling in regard to maintaining a certain racial balance at their interdistrict magnet school (HH, field notes, 2015). Other field notes from the same event reported that during the “entire hour and fifteen minutes there I did not hear the words ‘race,’ ‘Black,’ ‘White,’ ‘Latino,’ or ‘disadvantaged’ (LS, field notes, 2015).” Only the Hartford Magnet Trinity College Academy (HMTCA) was reported to have explicitly mentioned its mission to create a diverse student body through a film shown to open house attendees. The field notes reported the following:

The film talks about plurality and shows shots of children of many different races. The central thesis seems to be that Hartford Magnet Trinity College Academy was the mechanism through which children from diverse racial, geographical, and socioeconomic backgrounds have been permitted to come together and meet people from other milieus. (IF)

Additionally, the mission statements from the magnet schools described in the field notes of open houses do not directly state that their schools seek to attract and educate a diverse student body (i.e., Breakthrough Magnet School, Greater Hartford Academy of the Arts, CREC Academy of Aerospace Engineering Elementary School, HMTCA). These pieces of evidence suggest that, counter to the explicit intention of interdistrict magnet schools to promote racial and socioeconomic diversity, neither school representatives in school choice event settings nor their mission or vision statements were likely to describe their school community using direct language that underscores the diverse students they serve. While the legal language of the Sheff decision may be a standard explanation for school representatives, it may also alienate some parents due to a lack of prior exposure to the topic.

In contrast to a school community composed of a diverse student body, many charters, especially those that follow a “no excuses” model, have been criticized for generating student bodies that are more segregated than traditional district schools in the same jurisdiction (Kahlenberg & Potter, 2014). Data trends from 2011-12 to 2013-14 on racial  integration support this criticism (See Figure 1). 

This data is an update to the Cotto & Feder 2014 Choice Watch Report.

Cultural appeals to low income minority families by school representatives illustrate a strategic way in which charter schools develop racially or ethnically isolated communities. The school representatives at the Achievement First open house appealed to certain demographics through subtle, yet meaningful, gestures and modes of communication. For example, a school representative at the open house in Hartford that began at 5:30 PM provided empanadas and spoke Spanish with some Hispanic families. These efforts were described as a way to “establish the cultural/linguistic bond of identification” (CB, EK, AF field notes, 2015). While these efforts did not directly address community building, they created a welcoming community atmosphere specifically for the Hispanic parents. The Achievement First mission statement’s direct emphasis on “closing the achievement gap” and providing educational equity to historically underserved populations provides a clear impetus for directing promotional tactics at specific demographics who would most benefit from the school’s philosophy (“Our Mission and Vision,” 2015). While racial and socioeconomic integration in education has been repeatedly found to boost minority students’ academic outcomes, Achievement First’s model does not follow this approach to closing the achievement gap, but rather a rigorous academic approach targeted at a concentrated population (Kahlenberg & Potter, 2014).

Students, Staff & Families

Instead of touting the diversity of the student body or making specific appeals to certain demographics, some school representatives characterized their school community using a character appeal by underscoring the collaborative and supportive student-staff culture. The Breakthrough magnet school representative at the school’s open house characterized the school community as having a “family feel” and as a “close knit school community” (NT, field notes, 2015). The field notes went on to report that the school representative “used many buzzwords such as, ‘thriving,’ ‘joyful,’ ‘character,’ ‘safe,’ ‘risks,’ and ‘leadership,’ often using more than one in the same sentence.” Breakthrough magnet school’s emphasis on the character of their students and staff who compose their school community echoes their mission statement’s focus on developing “students as models of outstanding character” (“A Global School for Students of Character,” 2015). What is striking about this school representative’s portrayal of the school community is that the topic of parent involvement in the creation of a collaborative school community was omitted. Conversely, the mission statement dictates that Breakthrough Magnet School seeks to form a partnership between “staff, family and community members.” Although it is unclear whether the topic of parental involvement was intentionally excluded from the school representative’s pitch to families, the omission could indicate a larger problem facing magnet schools: the difficulty of engaging families from disparate communities and backgrounds at the school.

Other magnet schools and the charter school in the field notes sample did, however, directly mention parental involvement as a core element of their school community. At the CREC Academy of Aerospace Engineering magnet school open house, the representatives specifically addressed how a link between the family and the school is established by mentioning that a parent group convenes monthly to plan activities and to fundraise (AG, RU, field notes, 2015). This comment places an emphasis on parental behavioral engagement in the school community, which for many working class parents may be hard to execute. The school representatives at the Achievement First open house emphasized a potentially more accessible way in which parents can contribute to the school community. The field notes from this event reported the following:

The presenters also mentioned several times that they consider parents to be partners in the mission to get the kids to college. They said that there was a lot of communication between parents and teachers, and the teachers send a color-coded report about each student’s behavior to the parents every day. They also had a list of expectations for parents as a slide on the PowerPoint, and this included things like the expectation that the parents get their child ready for school and wearing their uniform each day and that they ensure their child does his or her homework. (CB, EK, AF, field notes, 2015)

Source: Achievement First Website (http://www.achievementfirst.org/our-approach/achievement-gap-and-mission/)
Quote from a principal featured on the same webpage as the mission statement. Source: Achievement First Website (http://www.achievementfirst.org/our-approach/achievement-gap-and-mission/)


This observation indicates an attitudinal and philosophical form of parental support and engagement that is a key element of bridging the gap between school and family. Instead of asking that parents regularly volunteer at the school or help fundraise, the school asks that parents be mission-aligned in order for students to be best prepared for the academic and behavioral demands during the school day. Additionally, this commentary prioritizes constant and transparent communication between parents and teachers. This suggests that the Achievement First family-school community operates under a reciprocal, goal-oriented and highly communicative system. As a way of further emphasizing the mission-alignment of all stakeholders in the Achievement First community, related quotes from principals and administrators appear on the webpage containing the mission statement.

Niche Communities

Source: Greater Hartford Academy of the Arts Website (http://www.crecschools.org/our-schools/greater-hartford-academy-of-the-arts)
Image and explanation of the state-of-the-art performing arts facility on the same webpage as the mission statement.
Source: Greater Hartford Academy of the Arts Website (http://www.crecschools.org/our-schools/greater-hartford-academy-of-the-arts)

School communities formed by the coalescence of mission-aligned groups is also apparent among interdistrict magnet schools, which often develop niche communities based on specialized interests. In order for magnet schools to attract students from a wide range of socioeconomic and geographic backgrounds, they typically have a special curricular focus or theme that a traditional district school would not offer. The magnet schools Greater Hartford Academy of the Arts and CREC Academy of Aerospace Engineering Elementary School provide quintessential examples of specialized school communities. The mission statement of the Greater Hartford Academy of the Arts portrays a definite dedication to developing visual and performing artists as well as providing an “academically rigorous curriculum” (“An Artistic and Academic Immersion,” 2015). The photograph directly under the mission statement visually displays the state-of-the-art facilities to further highlight the emphasis on the arts.

While there is no explicit mention of fostering an integrated student body in the mission statement, it does state that the arts are to be learned as a “mechanism for social justice” which perhaps connotes a social consciousness of the diverse backgrounds of the students. The field notes from this school’s open house corroborate the prioritization of artistic development and the absence of discourse on diversity or the student demographics. Only in describing a promotional pamphlet did the field notes mention the school’s “desire to be a part of a diverse, multi-cultural environment” (CM, field notes, 2015). Additionally, out of approximately 150 families present at the open house, the field notes observed that only one family was African American and only one was Hispanic. This provides potential evidence that either the curricular theme of the magnet school was particularly appealing to a certain demographic, or the timing or location of open house was not easily accessible or welcoming to minority families.

Similarly, the CREC Academy of Aerospace Engineering Elementary School’s mission statement stresses it’s dedication to teaching rigorous and cutting edge science and technology, yet there is no explicit mention of an aim to establish a diverse student body as is legally mandated by the Sheff ruling (“Academy of Aerospace & Engineering Elementary School,” 2015). In contrast to the field notes from the open house at the Arts Academy magnet school, the field notes from this magnet school’s open house did, in fact, address the issue of integration. Curiously, however, race was discussed though a proxy of geographic locations in the Hartford area, which aligns with the stipulations of Sheff. The school representative was reported stating that, “50% of the students are from Hartford and 50% are from 33 other towns” (AG, RU, field notes, 2015). The families present at the open house were also described as being more diverse and thus representative of the Hartford region. What seems apparent is that while interdistrict magnet schools are designed to establish and maintain integrated school communities, niche community-type magnet schools based on a specific focus are not likely to explicitly express this goal in their mission statements nor in the pitches given by school representatives at open house events.

Community Partnerships

Source: Hartford Magnet Trinity College Academy Website (http://hmtca.hartfordschools.org/vision.html)
Image of HMTCA students at Trinity College located on the same webpage as the vision statement.
Source: Hartford Magnet Trinity College Academy Website (http://hmtca.hartfordschools.org/vision.html)

While the magnet schools previously mentioned portray school communities that can seem insular due to their strong focus on a specific theme, other choice schools establish school communities that extend beyond the school and into the local community. The Hartford Magnet Trinity College Academy’s vision statement places a major emphasis on incentivizing community engagement, working to improve the community, and collaborating with community contributors (“Vision Statement,” 2015). The field notes from this magnet school’s open house align with this emphasis on community partnership. While the school representatives did focus on the student-teacher relationships, they also highlighted the school’s main partnership with Trinity College, located across the street (AM; IF, field notes, 2015). Photographs on the vision statement’s webpage illustrate students’ engagement with the college. Yet, when the school representative discussed extracurricular activities, the representative mainly focused on the arts and failed to explicitly mention any type of community engagement (IF, field notes, 2015).

The mission statement and the presentation by school representatives at Achievement First also underscore a school community that extends into the larger community. However, a dichotomy between a collaborative spirit and a competitive tone emerged regarding this topic. The Achievement First mission statement highlights its goal of sharing best practices with district schools and other charter schools in order to bring about greater education reform and to close the achievement gap (“Our Mission and Vision,” 2015). In contrast to criticism of some charters for their push to replace district schools (Kahlenberg & Potter, 2014), this message emphasizes collaboration. The field notes from the Achievement Frist open house indicate that the school representatives also mentioned other district schools in the Hartford region and in the state of Connecticut. A data-driven approach was taken in which schools were compared by test scores and presented as bar charts on a PowerPoint (CB, EK, AF, field notes, 2015). This message has a competitive charge and does not acknowledge any sort of collaboration between Achievement First schools and non-Achievement First Schools. Thus, school community in this case can be conceptualized as the “in-group,” or schools and educators aligned with the Achievement First mission, juxtaposed against the “out-group,” or those who do not share practices or a common philosophy with the charter network.

(Note from the instructor: Students were ask to write essays no more than 2500 words, which would be about here. Evaluators may read as much as they wish, but should not rate the essay beyond this point.)

While an array of school communities are delineated by school mission statements and largely supported by communication between school representatives and families, little evidence points to the communities formed on the classroom level that may reflect the larger school community or represent internal community divisions. The most prominent way in which either of these possibilities could be apparent is through the presence or absence of tracking, ELL programs and mainstreaming opportunities for students with disabilities. None of the school mission statements mentioned meeting the needs of ELL or special needs students. Seldom did school representatives mention such programs and when they did, they were reported as being said in passing. Thus, while a school as a whole may serve a diverse student body, a closer examination of internal programs would elucidate whether students receive a diverse classroom experience. Additionally, discourse on school community building was largely absent from the RSCO fair notes where there seemed to be greater emphasis on logistics rather than on school culture and community. School community building is possibly better addressed at events that are less hectic and focused on one school. 

References

A Global School for Students of Character. (2015, May 2). Retrieved from http://www.breakthroughmagnetschool.org

Academy of Aerospace & Engineering Elementary School. (2015, May 2). Retrieved from http://www.crecschools.org/our-schools/academy-of-aerospace-engineering-elementary-school/

An Artistic and Academic Immersion. (2015, May 2). Retrieved from http://www.crecschools.org/our-schools/greater-hartford-academy-of-the-arts/

Cotto, R. & Feder, K. (2014). Choice Watch: Diversity and Access in Connecticut’s School Choice Programs. Connecticut Voices for Children. New Haven, CT.

Debs, M. (2015). Untouchable Carrots: Marketing School Choice and Realities in Hartford’s Inter-district Magnet Program. Unpublished Manuscript, Yale University, New Haven, CT.

AG, RU; AM; CB, EK, AF; CB; IF; NT. Field Notes. (2015, February).

Kahlenberg, R. D., & Potter, H. (2014). A Smarter Charter: Finding What Works for Charter Schools and Public Education. New York: Teachers College Press.

Our Mission and Vision. (2015, May 2). Retrieved from http://www.achievementfirst.org/our-approach/achievement-gap-and-mission/

Vision Statement. (2015, May 2). Retrieved from http://hmtca.hartfordschools.org/vision.html

Welner, K. (2013). The Dirty Dozen: How Charter Schools Influence Student Enrollment. Teachers College Record. Retrieved from http://www.tcrecord.org.