CTOCA Mobility App Redesign

Posted on

The Open Communities Alliance has developed a tool to help individuals with housing subsidies find better communities and homes. While it is an excellent initiative, the mobility app is not yet as effective as it could be in helping people find homes and communities to move into. Through a housing information event organized with the help of the Open Communities Alliance and the Middletown North End Action Team, our class was able to conduct interviews with local who would potentially find the application useful. The interviews and data from the housing event indicate that while there is a clear interest in information about housing, the Mobility App is not highlighting the information that many individuals are interested in.

One of the largest problems with the app as it is currently designed is that it does not supply information about housing opportunities that app users can actually inquire about renting. The app has good information about opportunity levels and assets surrounding certain addresses, but this only goes so far in helping people find places they may actually live in. The Open Communities Alliance website states, “The Alliance is dedicated to bringing resources to lower opportunity areas and linking to higher opportunity areas people who historically have not had access to them.” To this end, it would be helpful for the housing mobility app to have access to information about specific apartment or houses to rent in higher­ opportunity areas.

People who attended the community housing workshop we held at the North End Action Team on April 15 cited the app’s lack of real listings as one of its most significant flaws. One participant said, “What are these, like, spots you can move?” when ze saw the dots for the neighborhood assets (Participant 10A). The same participant commented that ze liked the security deposit on the Portland, CT listing we showed workshop participants. This suggests a demand for information about specific housing opportunities in addition to the information about neighborhood assets and opportunity levels that the app already provides.

In the next version of the app, it would be helpful to incorporate housing listings from a rental listings website, such as Trulia, and to have these listings represented as points on a map of the area. A comparison of listings of Middletown apartments on Trulia, Realtor.com, and Zillow suggested that Trulia might be the optimal choice for a source of data to use in conjunction with the app. Trulia had more listings overall for Middletown housing opportunities (38 postings, compared to 28 on Realtor.com and 26 on Zillow) and more listings for opportunities under $1000/month (15, compared to 12 on Realtor.com and 9 on Zillow). An advantage of Zillow, however, is that Zillow presents its listings on a map of the area, which is what we propose for the app to do as well. Therefore it might be easier to pull location data from Zillow listings than from Trulia, but this would need further investigation by someone more familiar with the technical demands this would impose.

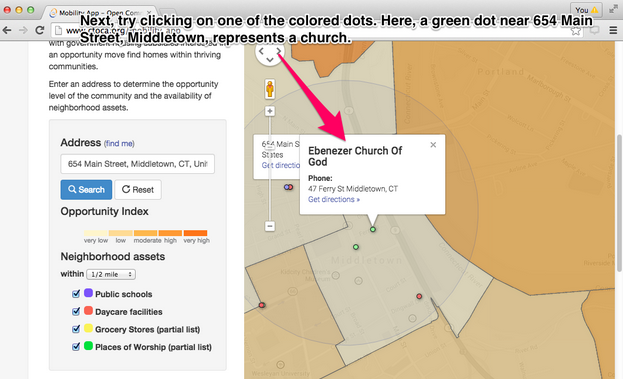
To make the listings very visible and simultaneously address participants’ concerns about the opacity of the opportunity ­level orange shading, we propose that the opportunity levels for individual listings be represented in the color of the balloon indicating an apartment or house for rent. A really clear redesign would be to completely remove the census tracts, but to color code the available housing markers by census opportunity level. This would allow users of the app to see clearly where the apartment or house was located with respect to familiar streets or neighborhood assets while also benefitting from the information about opportunity levels. Here is what this might look like:

To distinguish the listings from neighborhood assets and to ensure that the listings were the most prominent feature of the app, we propose that they be represented as balloons akin to the ones Google uses. Users could click on the balloons to get more information (opportunity level as well as a link to the posting on Trulia or Zillow) about the house or apartment listing. The neighborhood assets could be dots as they are in the app currently. This change to the app would allow housing listings to come first, which could really help people looking for housing make their decisions based on actual listings and locations without sacrificing the important opportunity­ level data and neighborhood assets.

The feature that was least evident to most participants was the transportation information. In the current format of the app, transportation is limited to a “get directions” link that takes the user to a new Google Maps page. Before it was explained, none of the fourteen participants clicked on or described the presence of this feature. This is a terrible shortcoming of the app, considering how important access to transportation is to most individuals when considering a new home or school for their children. Participants 3, 4, and 14 all referenced a need to understand different aspects of transportation during the process of finding housing despite there already being a section of the tool dedicated to housing. Any redesign of this tool must address this issue, because the inclusion of neighborhood assets or housing offerings are not as enlightening when users can’t find out how accessible they are.

It’s clear that linking out of the application for transportation information isn’t a very obvious feature to many. It would be better to include transportation information directly in the app. This way, it would be easier to use alongside visuals for opportunity level, housing, and neighborhood assets. The first and most simple step is to use a street map for the application instead of the map of census tracts. Being able to visualize a neighborhood’s roads and streets is the first step to understanding how one’s day to day travels will pass. The census tracts give very little in the way of understanding scale, population density, and nearness to highways or public transportation, all of which have an impact on living.

Here is an example of how a bus route could be shown. This example uses a shuttle route in Hartford. The word bubble is an example of what could pop up if the user mouses over the route.

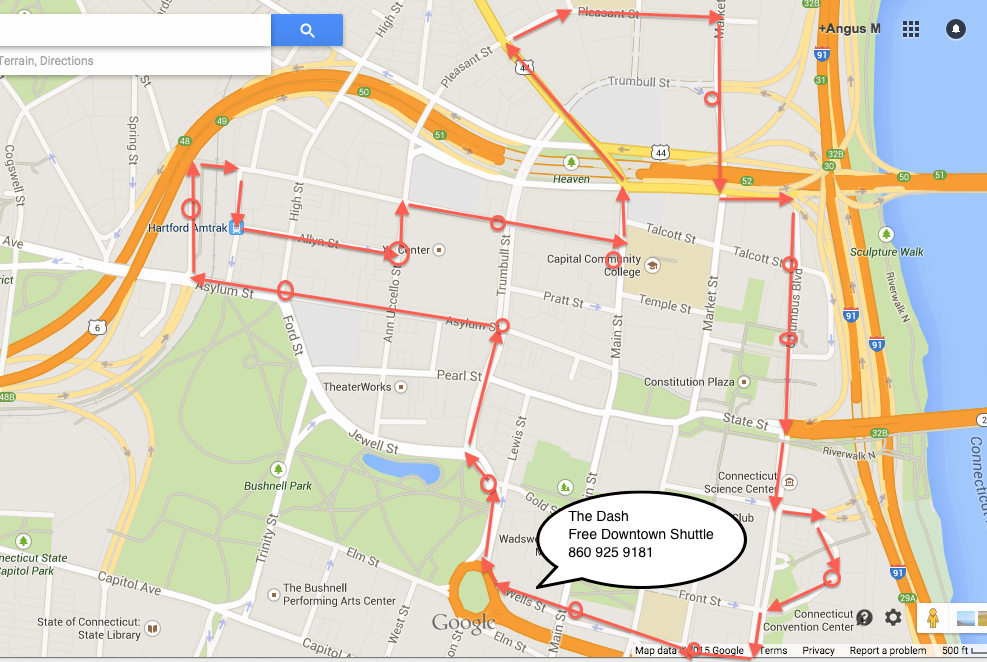
The next truly helpful asset would be to add bus (and other public transportation) routes and stops directly to the app. A good redesign would include an overlay of the different routes and stops on the map. Users should be able to hide or show this feature, just like the neighborhood assets. Also like the neighborhood assets, when clicked, the line would show a text box with the name of the bus or stop, along with a relevant phone number for the area’s CT Transit. This feature would not replace the “get directions” link, but would rather enhance its function. While this tool would not be as effective as the “get directions” link in finding tangible directions, it would provide a quick and broad understanding of how transportation in different neighborhoods compare to each other. This is an important layer of understanding that is not covered in the neighborhood assets or the opportunity index – a neighborhood can have wonderful schools, low crime, and high average incomes, but if life there requires a car, these positives would be of little use to a family without one.

The neighborhood assets feature was by far the most utilized in our housing workshop. Ten of the eleven individuals who clicked on any part of the application without assistance first clicked on neighborhood assets, and all eleven clicked on neighborhood assets at some point. By comparison, five people clicked on the shapes representing census tract opportunity level at some point, and no one clicked on the “get directions” link. This implies two things: That the way in which the neighborhood assets are represented in the tool is highly effective, and that neighborhood assets as a category are interesting to individuals who the app is designed for.

Many of the participants used items that could be labelled as “neighborhood assets” to decide whether or not a potential new home was in a good area. For instance, Participant 5 was interested in living near a community center. Participant thought that adding more points for things like public parks. Other participants wanted to find libraries and hospitals. These all could be listed alongside the current neighborhood assets.

In many ways, individuals were looking to these points as indicators of a good area. This is understandable – it is often crucial to live within a safe walking distance to a school or grocery store, or at least a bus stop to get there. For many, this is a basic necessity when looking for housing. However, this information in itself cannot stand in for the opportunity data. One might assume that high opportunity neighborhoods are more likely to have more neighborhood assets, but a quick examination of the mobility app shows otherwise. For all of the urban centers in Connecticut, the city center tends to have a lower opportunity level and quite a lot more neighborhood assets than the surrounding suburbs. This makes perfect sense, but it means that neighborhood assets alone are not adequate indicators of high-quality neighborhoods. Opportunity levels are also important to show, but their representation must be reworked to improve engagement.

Additionally, a stumbling block to many users of the app was the app’s overall lack of intuitiveness. Many participants in our focus group indicated that they were confused about what to do with what they were seeing in the app.

One specific major issue common across several participants in our housing workshop was that they found it difficult to orient themselves in the map. People said things like “How did I lose High Street?” (Participant 1) and “like where would Main…does it show like streets? Like where would the Y be from there?” (Participant 13), which indicated confusion. By changing the opportunity levels to colors of the balloons, as suggested in our discussion of housing listings earlier, the map would be clearer, and participants would be able to see specific streets and familiar landmarks more clearly. Having features pop up when you hovered the mouse over them instead of when you clicked them would also help with increasing the ease of use and reducing the clutter of the app.

Part of this struggle we observed in some of our participants may be attributable to the digital divide. A majority of the participants in our housing-app test session were not familiar or proficient at using computers (only 43% of our participants could use the search tool unassisted), and this represents a major potential-user population that may need different features to help them use the app. Several participants who were not very familiar with computers indicated that something of this nature would be helpful. One participant said, As Participant 5 said, “I think if something that could explain it for people that don’t know the computers, that would be really helpful.” Other participants indicated that more guidance would help them, making statements like “So what are we looking for?” (Participant 9M) and “So what do I have to put there?” (Participant 11). If people can’t figure out how to use the tool on their own, they will not be able to take advantage of the valuable information the app contains.

A thorough tutorial that explained in detail what information to put where could help self-described “computer-illiterate” people use the app. Ideally, the information in the tutorial would go down the the level of telling people what to click on and where to type in information to help people who were extremely unfamiliar with computers and might not have the same intuition-based abilities to figure this out as more computer-savvy users. This might look something like this: (note: We’d like to turn this into an embedded slideshow)

tutorial 17 tutorial 16 tutorial 15 tutorial 14 tutorial 13 tutorial 12 tutorial 11 tutorial 10 tutorial 9 tutorial 8 tutorial 7 tutorial 6 tutorial 5 tutorial 4 tutorial 3 tutorial 2 tutorial 1

We believe these suggestions will improve the housing mobility app and increase its utility and ease of use for those most in need of better housing opportunities. With our additions and revisions to the app, people will be able to find specific places to live, get a realistic sense of their transportation options, see enriched neighborhood assets, and understand how to make use of all this information even with limited computer skills. The Housing Mobility App has the power to be a tremendously helpful resource to housing mobility counselors and people looking for better housing opportunities for their families. These suggestions would make the app even more closely aligned with CT Open Communities Alliance’s mission to help people who historically may have not have had access to high opportunities have a chance to succeed.

Reduced Isolation: An Examination of Integration in Magnet and Charter Schools

Posted on

According to the Connecticut State Department of Education, both magnet and charter schools were founded on the basis of creating environments designed to “reduce racial, ethnic, and economic isolation.” However, of the two, only magnet schools are actually required to maintain a racial balance, whereas it is merely a suggestion for charter schools. In an attempt to reduce racially isolated schools, settlements that arose out of the Sheff vs. O’Neill case include a section outlining specific requirements for magnet schools to be considered desegregated. In our essay, we look to past school enrollment data to reveal the importance of having this defined standard of reduced isolation, and how the presence of this guideline is more effective in racially, ethnically, and economically integrating schools when strictly employed as in magnet schools than when simply encouraged as in charters. The data reveals that every year, the number of racially isolated magnet schools decreases while the number of racially isolated charter schools remains relatively the same, which accounts for the majority of charter schools. Without a specific standard they are required to adhere to, the majority of charter schools are, in terms of Sheff standards, considered racially isolated. This supports the effectiveness of the Sheff standard in encouraging the desegregation of schools. Without the standard, charter schools have a larger proportion of racially isolated student bodies, as compared to magnet schools. Why then, are charters not held to the same racial requirements as magnets are? This is a question we would like to further explore through data analysis and visualization.

Magnets Versus Charters

The magnet schools we have chosen to discuss in this essay are those that participate in the Sheff legislation and specifically abide by the clearly defined standards for environments of reduced isolation. That said, magnet schools are also public schools, but these operate under “a local or regional school district, a regional educational service center, or a cooperative arrangement involving two or more districts” 1. Magnets have two main goals: to reduce racial, ethnic and economic isolation and to offer curricula that encourage and support educational improvement and achievement 2. The Sheff Stipulation and Proposed Order from 2013 went into effect to remedy the Hartford schools’ violation of the Connecticut Constitutional order to reduce the racial, ethnic and socioeconomic isolation 3. Because schools were not effectively desegregating, Sheff proposed benchmarks to enhance incentives and promote reduced isolation. If magnet schools fail to meet these guidelines, they risk losing grant funding 4. In 2008, the order required that magnets enroll between 25% and 75% minority students, defined as non-white students 5 . In 2013, the range remained the same, but the definition of minority changed to only Black and Hispanic students 6. In 2013, Sheff included a section calling for the enrollment of at least 44% Hartford-resident minorities 7. Most recently, Sheff has increased that requirement to 47.5% 8. Together these two clearly defined and measurable standards function to increase integration, achieving the primary goal of magnet schools.

Charter schools, on the other hand, are public schools “that operate independently of local and regional boards of education” 9. One main goal for charter schools is “to reduce racial, ethnic and economic isolation” 10. With its goals at the forefront, charters establish their own methods and standards for achieving them. Because charters function autonomously, they are not held to any specific standard, as magnets are. This raises concerns for the incentives and accountability of charters and their goal of fostering diverse environments.

Charters abide by the Connecticut State Statute 11, which frequently mentions racial and socioeconomic integration. The first section discusses the approval process for a charter. The document states that the “State Board of Education shall consider the effect of the proposed charter school on the reduction of racial, ethnic and economic isolation in the region in which it is to be located” 12. To say that the Board will “consider” granting a charter based on its proposal to reduce isolation becomes altogether meaningless when there is no specifically outlined goal for which charters should aim to achieve concerning the diversity in enrollment. Merely considering something does not hold charters accountable to any kind of consequence if they do not successfully reduce isolation. Whether or not a proposed charter contributes to reducing isolated environments, the Board of Education is simply asked to consider it, not to decline the charter on the grounds of lacking a racially and socioeconomically integrated student body.

The next section mentioning reduced isolation discusses it in the context of probation processes. Charters can be placed on probation if they fail to “achieve measurable progress in reducing racial, ethnic and economic isolation” 13. The question here is: what qualifies as measurable progress when there is no quantifiable value provided? “Measurable progress” is a subjective term, whereby charters decide on their own ratio of minority to non-minority students. They are then held only to their own personal standard for reduced isolation. However, with the autonomy that they are grounded in, charters can adjust their measure to prevent them from going on probation or having their charter revoked. With the freedom to judge for themselves what is considered “measurable progress” or not, charters would never have to be at risk of losing funding or risk termination because they are in control of their own progress and how that progress is viewed by the Board. The main issue with this language is that while the statute does require charters to actively work towards integration, it provides no specific boundary on which to hold them accountable.

Another section states that applicants, when applying to charters, will receive preference if they “reside in a district in which seventy-five per cent or more of the enrolled students are members of racial or ethnic minorities” 14. This means that charters will give preference to students coming from homogenous, minority communities. Again, giving preference to these students promotes integration and functions to help those most in need. However, that does not hold them accountable for any particular percentage and it does not consider the effects of racial and socioeconomic imbalance. Similar to the issue of language discussed above, with no quantifiable quota there is no way for these charters to effectively reach the type of student body conducive with high minority achievement.

The Sheff Standard: Old and New

In an attempt to reduce racially isolated schools, Sheff settlements include a section outlining requirements for schools to be considered desegregated. In 2008, Sheff categorized reduced isolation as schools whose minority percentage fell between 25%-75% of total enrollment 15. Minority was defined as non-white students, including Black, Hispanic, Native American, Asian, and Pacific Islander. Under this standard, about a third of magnets failed to comply. Only two of these non-compliant schools failed to meet reduced isolation standards because its enrollment population comprised of mostly non-minority students – the remaining schools were considered segregated due to an exceedingly high percentage of minority and low-income students. The non-compliant schools described in the latter comprised of anywhere from 75% to almost 90% minority students, a point at which the student body was hyper-segregated with near homogeneity. The frequency of this extremely segregated environment can be attributed to the “niche market approach,” where schools and their administrators hope to target low-income and minority groups to serve populations with the greatest need 16. By enrolling a larger number of minority students than of white, the schools achieve their goals of reaching more disadvantaged communities. However, as we will discuss later in the essay, this approach proves to be far more detrimental to those disadvantaged students; educating them in a racially and economically segregated environment seems to do more harm than good.

In 2013 Sheff amended its reduced isolation standards to refer solely to students identifying as any part Black or Hispanic 17. Under this new definition of minority, the number of non-compliant magnets in the 2013-2014 school year was cut almost in half.

Looking at recent school enrollment data, we found an increasing trend in the number of magnet schools that became compliant with Sheff standards.
Looking at recent school enrollment data, we found an increasing trend in the number of magnet schools that became compliant with Sheff standards. (Source: Jessica Carlson)

When counting only Black and/or Hispanic students towards reduced isolation, 83% of the magnets (52 out of 63 schools) successfully achieved Sheff compliance, a number that significantly increased from its original 66% of compliant schools (41 out of 63 schools) in the 2011-2012 school year, using the previous definition of minority. Looking at the most recent school enrollment data for magnet schools reveals only 5 out of 45 listed schools out of compliance with Sheff standards, which further increases the percentage to 89% compliant (see tables 1 and 2 at the end of this section for the data used in this analysis). The annual enrollment data shows a consistent increase in compliance; by holding magnets to a measurable standard of reduced isolation, schools are held accountable and given real incentives to foster integrated student bodies.

It is important to acknowledge, however, that the way the word “minority” is defined has immense power in its ability to influence future demographics and enrollment standards in schools. Simply changing the definition for reduced isolation had a significant impact on whether or not magnet schools remained compliant with the racial standards set by Sheff. Had the definition remained unchanged, 18 magnet schools would have been noncompliant in 2013-2014 (compared to the 11 noncompliant schools under Sheff’s 2013 standard), showing little to no significant change from past years. Furthermore, of those 18 magnets that failed to meet Sheff’s 2008 standards, 8 of them became compliant under Sheff’s revised standards in 2013 without having to alter their student enrollment. Under the original Sheff standard, defining “minority” as non-white, these schools would not have been in compliance. However, the updated definition of minority automatically puts these schools in compliance without any active effort to adjust racial enrollment. Thus, while an increasing number of schools were considered desegregated, the racial distribution for some schools changed minimally or not at all. Regardless, a significant portion of these newly compliant schools did in fact make an active effort to reduce isolation, reinforcing the idea that this imposed standard of compliance encourages magnet schools to diversify and become compliant with Sheff standards.

Table 1: The spreadsheet above shows the percentages of reduced isolation for magnet schools in the 2011-2012 and 2013-2014 school years. For the 2011-2012 school year, reduced isolation was calculated in terms of nonwhite students, and in 2013-2014 it became only Black and Hispanic students. Reduced isolation is given as the inverse of these calculations. Schools are compliant if their reduced isolation percentage falls between 25% and 75%. (Source: Robert Cotto and Jack Dougherty)

Table 2: The spreadsheet above shows the percentages of reduced isolation for magnet schools in the current 2014-2015 school year. Reduced isolation is given as the inverse of the percent Black and Hispanic students. Schools are compliant if their reduced isolation percentage falls between 25% and 75%. (Source: Barbara Canzonetti)

What If?: Applying Sheff to Charters

While currently, the Sheff reduced isolation standard is only exercised by magnets, this is not out of exclusivity within the legislation, but rather because other types of schools have chosen not to participate. In the Sheff legislation, the state agreed to incorporate a variety of programs, some of which include “charter school initiatives, state technical high schools and vocational agriculture programs, and other new and progressive initiatives,” that could, if they chose, be considered a part of the reduced isolation goal 18. Participating in this goal would allow the state to count the school in their total number of integrated schools, as well as make the school eligible for funding. Given that charters were designed to promote diversity, such a standard of integration appears to directly align with the mission statement of charter schools. However, charters have yet to act in accordance with the Sheff legislation; instead, they follow their own, more lenient integration guidelines as previously discussed.

Using the most up-to-date data available for the enrollment levels of both magnets and charters, this bar graph shows how many more magnet schools are racially integrated than charters. (Source: Jessica Carlson)

Without a concrete and measurable unit for integration, charters can often neglect entirely this goal of diversity within their student bodies. A lack in standard also creates more difficulty in determining which charters are succeeding or failing to create diverse and integrated environments. In order to test how integrated Connecticut Open Choice charter schools were, we applied the new Sheff reduced isolation standard to charter schools from the 2013-2014 school year. We found that only 28% (5 out of 18) would be compliant with reduced isolation, compared to the 89% of magnets currently in compliance (see graph for comparison and table 3 for data). Based on this disparity, we would argue that magnets are far more successful than are charters in creating environments of reduced isolation, a difference that is rooted in the strictly defined integration standard that magnets, but not charters, are held accountable to.

Table 3: The schools highlighted in purple are the only 5 charters that would be compliant with Sheff’s reduced isolation standard. (Source: Jack Dougherty)

So why, then, do charters not adopt the Sheff standards? When our seminar spoke with the authors of A Smarter Charter, Kahlenberg and Potter explained that such a set standard was not in the nature of charters. Placing specific criteria or regulations on charters goes against Albert Shanker’s initial vision of charters as laboratory schools. For Shanker, charter schools were to function as experiments with varying approaches and curricula to discover what works best for all students 19. Charters do not want to hinder or bind themselves by requiring a standard for racial balance and integration because perhaps it is not the best way to educate its students. An education system built on freedom of exploration strives to hold on to that independence and self-governance. But while they exercise their freedom, charters fail to produce the rich and diverse environments Shanker had hoped would come naturally.

(Note from the instructor: Students were ask to write essays under 2500 words, which would be about here. Evaluators may read as much as they wish, but should not rate the essay beyond this point.)

So What?

What is the big deal about having racial, ethnic, and economic integration in school populations anyways? Integration on all levels plays a strong role in developing better, moral characters, leading to a “dramatic decrease in discriminatory attitudes and prejudices” 20. Research has found that children are at higher “risk of developing stereotypes about racial groups if they live in and are educated in racially isolated settings,” further perpetuating the idea that integration is crucial 21.

Not only is integration important for character, but also for the creation of an environment producing higher academic achievement. Research has found that “children from socioeconomically deprived families do better academically when they are integrated with children of higher socioeconomic status and better-educated families” 22. The motivation and ambition of middle- and upper- class peers are contagious; deprived students are able to accelerate their learning through informal interactions with peers 23. Integrated academic environments also allow low-income students and their families to profit from the presence of middle- and high-income parents, who tend to “volunteer in the classroom, have high standards, hold school officials accountable, apply political pressures to ensure adequate funding, and provide financial support” 24. Increasing diversity is not a zero-sum game; the achievement levels of middle class, white students will not decrease due to the presence of low income, minority students 25. In fact, their achievement will most likely remain the same, and their ability to interact with individuals of diverse backgrounds will improve.

The importance of integrated environments is highlighted by indisputable data regarding the higher academic achievement and increased social awareness of minority students educated in diverse environments. Looking at recent school enrollment data, we have found that a larger number of magnet schools have integrated student bodies than do charters. Should charters be held to a similar, strictly defined standard for creating environments of reduced isolation as magnets are held to Sheff, we strongly believe that they too can have more integrated student bodies.

Notes:

  1.  Cotto, R. & Feder, K. (2014). Choice Watch: Diversity and Access in Connecticut’s School Choice Programs. Connecticut Voices for Children. New Haven, CT. p. 6
  2.  Cotto, R. & Feder, K. (2014). Choice Watch: Diversity and Access in Connecticut’s School Choice Programs. Connecticut Voices for Children. New Haven, CT. p. 6
  3. Sheff v O’Neill. “Stipulation and Proposed Order [Remedy Phase III].” Superior Court: Complex Litigation Docket at Hartford, CT, HHD-X07-CV89-4026240-S, December 13, 2013. p. 1 https://www.dropbox.com/s/jrdbk0an15t398d/Sheff20131213PhaseIII.pdf?dl=0.
  4. Cotto, R. & Feder, K. (2014). Choice Watch: Diversity and Access in Connecticut’s School Choice Programs. Connecticut Voices for Children. New Haven, CT. p. 6
  5. Sheff v O’Neill. “Stipulation and Proposed Order [Remedy Phase II].” Superior Court: Complex Litigation Docket at Hartford, CT, HHD-X07-CV89-4026240-S, April 4, 2008. p. 3.  http://digitalrepository.trincoll.edu/cssp_archives/19/.
  6. Sheff v O’Neill. “Stipulation and Proposed Order [Remedy Phase III].” Superior Court: Complex Litigation Docket at Hartford, CT, HHD-X07-CV89-4026240-S, December 13, 2013. p. 5  https://www.dropbox.com/s/jrdbk0an15t398d/Sheff20131213PhaseIII.pdf?dl=0.
  7. Sheff v O’Neill. “Stipulation and Proposed Order [Remedy Phase III].” Superior Court: Complex Litigation Docket at Hartford, CT, HHD-X07-CV89-4026240-S, December 13, 2013. p. 5  https://www.dropbox.com/s/jrdbk0an15t398d/Sheff20131213PhaseIII.pdf?dl=0.
  8. Sheff v O’Neill. “Stipulation and Proposed Order [Remedy Phase IV].” Superior Court: Complex Litigation Docket at Hartford, CT, HHD-X07-CV89-4026240-S, February 23, 2015. p. 2  http://www.sheffmovement.org/wp-content/uploads/2015/02/sheff-settlement-2.23.15.pdf
  9. Cotto, R. & Feder, K. (2014). Choice Watch: Diversity and Access in Connecticut’s School Choice Programs. Connecticut Voices for Children. New Haven, CT. p. 6
  10. Cotto, R. & Feder, K. (2014). Choice Watch: Diversity and Access in Connecticut’s School Choice Programs. Connecticut Voices for Children. New Haven, CT. p. 6
  11. General Statutes of Connecticut (2015). Chapter 164 – Educational Opportunities, Section 10-66bb, http://search.cga.state.ct.us/sur/chap_164.htm#sec_10-66bb
  12. General Statutes of Connecticut (2015). Chapter 164 – Educational Opportunities, Section 10-66bb, http://search.cga.state.ct.us/sur/chap_164.htm#sec_10-66bb
  13. General Statutes of Connecticut (2015). Chapter 164 – Educational Opportunities, Section 10-66bb, http://search.cga.state.ct.us/sur/chap_164.htm#sec_10-66bb
  14. General Statutes of Connecticut (2015). Chapter 164 – Educational Opportunities, Section 10-66bb, http://search.cga.state.ct.us/sur/chap_164.htm#sec_10-66bb
  15. Sheff v O’Neill. “Stipulation and Proposed Order [Remedy Phase II].” Superior Court: Complex Litigation Docket at Hartford, CT, HHD-X07-CV89-4026240-S, April 4, 2008. p. 3  http://digitalrepository.trincoll.edu/cssp_archives/19/.
  16. Kahlenberg, R. D., & Potter, H. (2014). A Smarter Charter: Finding What Works for Charter Schools and Public Education. New York: Teachers College Press. p. 18
  17. Sheff v O’Neill. “Stipulation and Proposed Order [Remedy Phase III].” Superior Court: Complex Litigation Docket at Hartford, CT, HHD-X07-CV89-4026240-S, December 13, 2013. p. 5.  https://www.dropbox.com/s/jrdbk0an15t398d/Sheff20131213PhaseIII.pdf?dl=0.
  18. Sheff v O’Neill. “Stipulation and Proposed Order [Remedy Phase III].” Superior Court: Complex Litigation Docket at Hartford, CT, HHD-X07-CV89-4026240-S, December 13, 2013. p. 2.  https://www.dropbox.com/s/jrdbk0an15t398d/Sheff20131213PhaseIII.pdf?dl=0.
  19. Kahlenberg, R. D., & Potter, H. (2014). A Smarter Charter: Finding What Works for Charter Schools and Public Education. New York: Teachers College Press. p. 7
  20. Kahlenberg, R. D., & Potter, H. (2014). A Smarter Charter: Finding What Works for Charter Schools and Public Education. New York: Teachers College Press. p. 55
  21. Kahlenberg, R. D., & Potter, H. (2014). A Smarter Charter: Finding What Works for Charter Schools and Public Education. New York: Teachers College Press. p. 55
  22. Kahlenberg, R. D., & Potter, H. (2014). A Smarter Charter: Finding What Works for Charter Schools and Public Education. New York: Teachers College Press. p. 9
  23. Kahlenberg, R. D., & Potter, H. (2014). A Smarter Charter: Finding What Works for Charter Schools and Public Education. New York: Teachers College Press. p. 64
  24. Kahlenberg, R. D., & Potter, H. (2014). A Smarter Charter: Finding What Works for Charter Schools and Public Education. New York: Teachers College Press. p. 65
  25. Kahlenberg, R. D., & Potter, H. (2014). A Smarter Charter: Finding What Works for Charter Schools and Public Education. New York: Teachers College Press. p. 62

The Unspoken Demographics of Hartford-Area Magnet Schools

Posted on

Introduction

In a seminar at Wesleyan University called “Choice: A Case Study in Education and Entrepreneurship,” students visited various “choice” school fairs and open houses. Choice schools in Connecticut are part of a movement to allow parents and students to choose their school, rather than the only option being the traditional neighborhood public school, and include district-wide open choice programs, interdistrict city-suburban transfer, charter schools, and interdistrict magnet schools. 1 In Connecticut, the choice movement exploded after the landmark Sheff v. O’Neill ruling in 1996, in which the State Supreme Court ruled that the racial and socioeconomic segregation of Hartford’s school children violated the Connecticut Constitution. However, from the field notes collected at the school fairs and open houses we visited, racial and socioeconomic integration were rarely mentioned by school representatives, parents, or students.

This is not because race and socioeconomic status don’t matter anymore; on the contrary, there is still a great deal of variation in racial balance even in Connecticut choice schools. In this paper, I will examine how racial balance plays out in Hartford-area interdistrict magnet schools based on school theme and school location. I am focusing on magnet schools because these schools are designed to have a specific racial balance in order to achieve the goal of desegregating Connecticut’s public schools, yet demographics play out differently depending on the school, and some schools are struggling to maintain their required desegregation standards.

Desegregating Hartford’s schools: The controversy and the lack of transparency

Why does integration matter? In Connecticut today, there are 40,000 children attending chronically failing schools where most students are far below grade level. At these schools, nearly 90% of students are African American or Hispanic/Latino and come from low-income households, on average. 2 Students of color bear the burden of Connecticut’s failing schools, in spite of the American ideal in which all children should have equal opportunity to learn and grow together.

In education reform, integration is a debated concept. Now, charter schools, which do not focus on integration and tend to be very segregated in order to give spots to the children who are most in need. Kahlenberg and Potter critique the devolution of the charter school movement away from founder Albert Shanker’s initial vision to create racially and economically integrated alternatives to traditional public schools; they quote Shanker saying, “children from socioeconomically deprived families do better academically when they are integrated with children of higher socioeconomic status and better-educated families,” and “when children converse, they learn from each other. Placing a child with a large vocabulary next to one with a smaller vocabulary can provide a gain to one without a loss to the other.” 3

On the other hand, frustrated parents argue that the focus on integration forces schools to put their resources into attracting students from whiter, wealthier towns. 4 Darien Franco, 2011 graduate of Capital Preparatory Magnet School told me, “I think that the desegregation goal is a bit superficial because what I assume is the whole point is part of an effort to make sure everyone’s getting a similar, quality education. I think whoever wants/needs a spot the most should get it. Of course Hartford schools are going to have a high percentage of black/Latino kids, because that’s who lives in Hartford. I don’t see exactly how sending in non-black/Latino children to a school alleviates any particular issue, other than they’ll be more used to seeing them in everyday life.” 5

As a result of Sheff v. O’Neill, in the past ten years, the state has spent $1.4 billion to renovate and build new magnet schools, which are designed as reduced isolation schools that draw students from the city and suburbs. 6 Magnet schools in the Hartford area have special themes designed to draw in students from both the city and suburbs, and they are required to have a student body that is 25%-75% racial minority students (newly defined as African American or Hispanic/Latino). While magnet schools are public schools open to all residents of Connecticut and appear to select students randomly based on a lottery, in truth, there are many subtle factors determining which students end up at different schools. Magnet schools have incentives to be academically successful and are required to maintain a racial balance, so they are never truly random their selection of students.

 One important factor in attracting a certain student body is the way schools communicate with parents and prospective students. Our class observed many schools present themselves to parents and children in order to better understand how they choose to communicate. Perhaps surprisingly, school representatives rarely brought up integration or provided information on their school’s demographic statistics or goals, and parents did not usually ask about it either.

Unwrapping Hartford magnet school demographics

The fact that there is little transparency or emphasis on racial balance in schools does not mean demographic factors are unrelated to parents’ choice of schools for their children. In their field notes from the Regional School Choice Office (RSCO) fair on February 7, 2015, Alix Liss and Sara Guernsey observe that “despite the fair being particularly minority heavy in attendance, the individuals looking at the specialized schools, whether performing arts or science based, were predominantly white.” 7 Does this hold true for actually enrollment in magnet schools? In order to find out, I assigned a theme to each Hartford-area magnet school and analyzed the demographics of each category. In order to create my categories, I drew on a list compiled by Mira Debs and Jack Dougherty, and looked at the website and mission statement of each school. Though some schools have more than one theme, for the sake of this analysis, I chose the theme I thought was most prominent. I have divided the schools into the following categories: STEM, college prep, career prep, alternative pedagogy, arts, global/international studies, liberal arts, character education, and early childhood only. Using data from the 2014-2015 CSDE Sheff Compliance report from October 1, 2014, I calculated the average percent of black/Latino students in each category. 8 I found that large differences in demographics do exist among these schools. The following table shows all of the Hartford-area magnet schools, categories, and demographic data.

Table 1: Hartford-Area Magnet Schools, themes, and 2014-2015 demographic data. Demographic data compiled from CSDE Sheff Compliance Report.

The categories with the highest percentage of minority students were character education* (79.2%), college prep (77.5%), and career prep (77.0%), while the categories with the lowest percentage of minority students were early childhood* (53.1%), STEM (55.8%), arts (56.8%), and liberal arts* (59.0%) (I have marked categories with only one or two schools with an asterisk here and later in this essay; all other categories have at least four schools). The following graph shows these percentages.

Figure 1: Average percent black/Latino students in Hartford-area magnets schools by theme

The observation at the RSCO fair that white families migrated toward the more niche-themed schools makes sense considering the actual enrollment in these schools (although, it is interesting to observe that they cited those families as “predominantly white” even though the schools with the highest percentage of non-minority students are still all over 50% black and Latino). Of course, this data cannot explain whether the reason for these demographic differences is that certain types of schools appeal to certain demographics or that these schools are actively working to attract different demographics due to their philosophies or institutional goals.

However, one way schools might alter their applicant pool is through the location of their school. Because transportation is an issue for many parents and busing for interdistrict schools can be quite complicated and time-consuming, a school far outside the city in the suburbs may be less accessible to many families. In fact, using the data on the Hartford resident students from the 2014-2015 CSDE Sheff Compliance Report, I calculated that magnet schools located in the city of Hartford have an average of 43.7% Hartford resident students enrolled, while only 34.2% of students are Hartford residents in schools located outside of Hartford (in towns such as East Hartford, Bloomfield, Avon, Enfield, Glastonbury, New Britain, Manchester, Rocky Hill, South Windsor, and West Hartford). Balancing Hartford and suburban students is a main goal of magnet schools because Hartford is the second poorest city in the country, and the vast majority of Hartford is black or Latino, with only 15.8% of the city’s population whites of non-Latino background in the 2010 census. 9 This caused the extreme segregation of Hartford public schools that fueled the Sheff movement. For race, though, the difference between magnet schools in Hartford and the suburbs is much less: schools in Hartford are on average 65.8% black/Latino, while schools located outside of the city are 62.7% black/Latino. Though a difference still exists, the fact that the numbers are pretty close probably indicates that schools located in the suburbs likely enroll more suburban black/Latino students than schools in Hartford. The following interactive map shows the location of Hartford-area magnet schools and their percentage of minority students:

Direct link to the map above

Based on my analysis, I can conclude that theme of the school is more important than school location in determining the racial demographics of schools. However, when looking at the percentage of Hartford students in each school, location is much more important. Theme may be important too; looking at the table above, we can see that the themes with the highest percentage of minority students, character education*, college prep, and career prep, enroll 48.7%, 41.5%, and 51.2% Hartford students, respectively, while the themes with the lowest percentage of minority students, early childhood*, STEM, and arts, enroll 28.6%, 34.6%, and 37.6% Hartford students respectively. But the themes do not follow the exact same order in terms of their Hartford student population as they do minority student population.

Since location does seem to affect demographics at least to some degree, do schools with themes that enroll fewer minority students and fewer Hartford students tend to locate themselves further outside the city? In order to answer this question, I compiled the addresses of each magnet schools and used Google Maps to calculate their distance from Hartford (I used the location point that Google Maps automatically associates with “Hartford, CT,” which is in the center of the city, so even schools located in Hartford have a “distance from Hartford” that is based on this common centerpoint).

 Based on this analysis, there is not an obvious correlation between school location, theme, and demographics. For example, STEM schools, which on average enroll only 55.8% minority and 34.6% Hartford resident students, are only 4.3 miles from Hartford center, on average. On the other hand, career prep schools, which on average enroll 77.0% minority and 51.2% Hartford resident students, are 6.7 miles from Hartford center, on average. Therefore, there is no clear indication that different themed schools are choosing their location based on the type of students they attract or wish to attract. Of course, this analysis is limited in that it is based on a small number of schools and does not take into account the demographics of different suburbs. Moreover, because many magnet schools were founded relatively recently, many schools have changed location in the past few years or are currently in temporary locations while permanent sites are built.

In conclusion, though school representatives and parents rarely talk about demographics, there are clearly many factors that affect racial composition of schools. In this analysis, I found that theme is a key indicator, while location also has a smaller influence. Further analysis would be necessary to understand why theme affects the racial balance of schools. Clearly, though, as schools develop their themes in order to attract students from Hartford and its suburbs, it is important to keep in mind how different themes relate to school demographics.

Notes:

  1. Dougherty, Jack. “Vocabulary for Understanding School Choice in CT – Google Slides.” Accessed May 3, 2015. https://docs.google.com/presentation/d/1Eknsj1S-RAeQDeFulF7viHiSN6Uhn3UUz7b1p-9GZ6o/edit#slide=id.g5f09c8db1_05.
  2. “CONNECTICUT EDUCATION IN CRISIS: 40,000 CHILDREN TRAPPED IN FAILING SCHOOLS.” Connecticut Coalition for Achievement Now, November 18, 2014. http://www.conncan.org/media-room/press-releases/2014-11-connecticut-education-in-crisis-40000-children-trapp.
  3.  Kahlenberg, Richard D., and Halley Potter. A Smarter Charter: Finding What Works for Charter Schools and Public Education. New York: Teachers College Press, 2014, p. 9
  4. See Mira Debs, “Untouchable Carrots: Marketing School Choice and Realities in Hartford’s Inter-district Magnet Program,” draft article, February 2015. This article offers insight into the frustrations many parents face in a system designed to attract more white students to schools in order to meet desegregation standards, when many minority families are struggling to get their children into a good school. This article is not yet available to the public.
  5. Franco, Darien, Personal correspondence, May 3, 2015.
  6. Thomas, Jacqueline Rabe. “$20M Agreement Will Expand School Choice to Desegregate Hartford Schools | The CT Mirror.” CT Mirror, February 23, 2015. http://ctmirror.org/2015/02/23/20m-agreement-will-expand-school-choice-to-desegregate-hartford-schools/.
  7. “Compiled School Choice Public Event Field Notes,” February 2015, p. 30
  8. “CSDE Sheff Compliance Report,” October 2014. https://www.dropbox.com/s/xt0ddcrl95jjxfd/2014-15SheffComplianceFromCSDE_SN_BLRI.xlsx?dl=0.
  9. “Hartford (city) QuickFacts from the US Census Bureau.” Accessed May 4, 2015. http://quickfacts.census.gov/qfd/states/09/0937000.html.

Still Separate and Still Unequal: Understanding Racial Segregation in Connecticut Schools

Posted on

Given Brown v. Board of Ed. (1954) reaches its’ sixty first anniversary this year, it is hard to reconcile the fact that so many schools are still segregated by both race and socioeconomic class (McBride 2006). According to scholars (Frankenberg 2010), this segregation is especially true and present in the majority of charter, public neighborhood and magnet schools. Magnet schools, institutions driven by a mission for racial diversity, strive to give individuals of all backgrounds equal opportunity, but given these ideals and often the schools’ locations, the desired integration is less than legitimate. Connecticut is populated primarily by white, middle to upper class, wealthy and educated individuals. 81.6% of the population is white, with 11.3% Black and 14.7% Latino. In 2009-2013, 89.2% of people had graduated high school. Between 2009-2013, 36.5% had graduated some form of secondary college education (“Connecticut” 2014). Specific to Hartford, CT, nearly 900,000 individuals populate the city. 77.3% of residents are white, 15% are black, 5% Asian and 16.6% Latino. From 2009-2013, 88.1% of individuals graduated high school and 34.9% of individuals graduated college (“Hartford County, Connecticut” 2014). There is great privilege and school choice within this city, and yet, its learning environments are still scarily segregated by race. Especially in a progressive state like that of Connecticut, it is essential to understand why and how this segregation persists, specifically in magnet schools, and how effective policy can be implemented in order to change the trajectory schools are currently on.

Beginning prior to the 1896 Supreme Court case of Plessy v. Ferguson, which upheld the statement “separate but equal” for public places and facilities (“Jim Crow Stories Plessy V. Ferguson” 2002)(McBride 2006), racial segregation has been present throughout American educational institutions and has existed as long as racial inequality has. One reason for segregation’s continued presence in schools is due to the fact that people involve themselves in communities in which they feel most comfortable. This can be attributed to home location, extracurricular activities, clubs, and religious temples, housing opportunities, white flight, gentrification and zoning.

One major way in which continued segregation within Hartford has persisted is through school choice, something greatly discussed in Jongyeon Ee and Gary Orfield’s “UCLA’s Civil Rights Project.” With a number of other scholars, Orfield developed this research for a great number of cities and states, but with Ee, exposed Connecticut to be predominantly white and middle to upper class. However, from one town to the next exist pockets of minorities, from Bridgeport to East Hartford and back to Windsor and Farmington.  In 1980, Connecticut State Government began to require each district to report the racial make-up of their schools, including information such as distance of home from school in addition to understanding who required free and or price reduced lunch. This law, known as the Racial Imbalance Law, also required schools to communicate with their districts when the number of minority students was not aligned with that of the number of majority race students. The school board was then required to work with the schools in order to implement more effective policy (Lohman 2010). This law was unfortunately not particularly successful (Ee and Orfield 2015). The policy mandated “the minority-white ratio in a school not be more than 25% above or below the regional total” (Ee and Orfield 2015:11). This law failed, and so has the Connecticut state government in eradicating school based segregation that “is among districts within metropolitan areas not inside individual districts, which often are overwhelmingly white or nonwhite” (Ee and Orfield 2015: 11).

Another contributing factor as to why racial segregation persists in schools is due to the level of information, or rather lack there of, that parents receive when enrolling their children in schools and the heavy presence of self-selection practices. Many also find fault with the way in which schools operate, often due to curriculum, location, teachers and or culture. Even though many people share similar preferences for their children to excel in school, individuals still send their school-aged kids to institutions in which other students are like them – from similar backgrounds and ethnicities (Kahlenberg and Potter 2014:125). There are some however that do see great value in sending their children to schools maintaining diverse environments. For example, in her novel entitled “Both Sides Now: The Story of School Desegregation’s Graduates, Amy Stuart Wells writes about a woman named Maya who decided against sending her child to Jewish school due to the limited cultural exposure he or she would receive. She said, “I could not imagine putting [my kids] in a school where everybody’s white and has money I think that’s a really bad thing to do…I don’t think [being rich] makes them better people or happier people” (Wells 2009: 206).

Below are two images from an interactive map application depicting the “racial breakdown of students since 1969, by district” (Thomas “60 Years after Brown vs. Board of Education: Still Separate in Connecticut 2015) One map portrays that breakdown from 1968-1969, and the other shows that breakdown from 2012-2013, demonstrating the change in racial composition. When using the map online, one can look at various regions in Connecticut to have a better understanding of race in schools in the entire state. These images give the statistics exclusively for Hartford.

This is a visual depiction of the breakdown of students by race in Hartford from 1968-1969. This App allows for users to see the racial composition of every region if looked at online.
This is a visual depiction of the breakdown of students by race in Hartford from 1968-1969. This App allows for users to see the racial composition of every region if looked at online. (Thomas “60 years after Brown vs. Board of Education: Still separate in Connecticut 2015)
This is a visual depiction of the breakdown of students by race in Hartford from 2012-2013. This App allows for users to see the racial composition of every region if looked at online.
This is a visual depiction of the breakdown of students by race in Hartford from 2012-2013. This App allows for users to see the racial composition of every region if looked at online. (Thomas “60  years after Brown vs. Board of Education: Still Separate in Connecticut 2015)

As Orfield and Ee’s report suggested, school choice is one major topic of contention in Connecticut politics, culture and society, specifically when it comes to the Sheff Movement. In 1989, Elizabeth Horton Sheff began a crusade against the Connecticut government on behalf of her son and the minority students of the state. Arguing that black and Latino schools in urban areas were less privileged than those of the white suburban schools, Sheff and her other plaintiffs began to make great change. In 1996, district lines were deemed unconstitutional and within a year later, a law entitled “An Act Enhancing Educational Choices and Opportunities” was passed; it encouraged racial integration through school choice. In 2008, through the Sheff Movement, a greater number of spots for students from all areas and racial backgrounds were to be made available in magnet schools. Elizabeth Sheff’s son Milo may no longer be in primary school, but her efforts continue and make for great change in the racial aspects of learning in this state (“History of Sheff v. O’Neill” 2014) (“Sheff V. O’Neill” 2014).

In response to the civil rights case, the Connecticut state government spent $1.4 billion on building new magnet schools and fixing those that had been dilapidated. In order to maintain the various forms of education institutions in the state, $140 million of government money must be spent every year. One of Sheff’s major goals was to provide opportunities for 41% of Hartford’s minority students to enroll in integrated schools (Thomas, “60 years after Brown v. Board of Education: Still Separate in Connecticut” 2014).

Here is a photo of Hartford Magnet Trinity College Academy. It maintains a focus on arts and science, as well as community engagement. Connected to Trinity College, the school is focused on building a college preparatory program.
Here is a photo of Hartford Magnet Trinity College Academy. The school maintains a focus on arts and science, as well as community engagement. Connected to Trinity College, the school is focused on maintaing a college preparatory program and an environment of college and career readiness. (“MagnetMiddle.jpg 320×420 pixels” 2011)

The Sheff Movement places a large emphasis on magnet schools, institutions geared toward providing a vast array of opportunities for minority students to receive an exceptional education. As of 2003, thirty-one magnet schools operated in Connecticut, serving 10,700 students through 100 public school districts. Magnet schools are often associated with particular topics of study and a focused mission. This could be STEM, which is Science, Technology, Engineering, and Mathematics, Fine and Performing Arts, International Baccalaureate, International Studies, CTE, which is Career and Technical Education, and World Languages. The curriculums are created in this manner in order to create and maintain focus while also building more familial-based interest (Chen 2015)(“What are Magnet Schools?” 2014). Al Shanker, one of the founders of charter schools, suggested all public schools, whether charter or magnet or otherwise, “should provide a common education to children from all backgrounds that teaches not only skills but also American history, culture, and democracy” (Kahlenberg and Potter 2014: 57). Unfortunately, despite some government support and encouragement, these schools have not entirely followed through on Shanker’s suggestion quite yet.

Connecticut Magnet Schools are evaluated through a series of state designed questions each year. The first is “What characteristics define interdistrict magnet schools and how do interdistrict magnet schools differ from other public schools?” The second is, “what impact have interdistrict magnet schools had on reducing the racial, ethnic, and economic isolation of CT students?” The third is, “what impact have interdistrict magnet schools had on reducing the racial, ethnic, and economic isolation of students within the magnet school itself?” The fourth is “How does the performance of interdistrict magnet school students compare with that of public school students state-wide?” And the final two are “how consistent are students, parents, and their public school professional staff in their perception of the effectiveness of their magnet schools, and what characteristics do the highly successful magnet school share?” (Beaudin: 3-5). Unfortunately, the results of these questions and of magnet schools in general have not proved to be as successful as had been previously predicted. The schools remain homogeneous, especially as there is limited enrollment of white students. Few special needs students are even offered the opportunity of enrollment (Thomas “Report: Many Connecticut charter schools ‘hyper-segregated’” 2014).  In 2009, Connecticut dictated no magnet schools would be built until further data on their potential to be successful had been accumulated. Despite them being schools of choice and supposed opportunity, their effectiveness has still yet to be measured properly, and the call for them to do so was made over five years ago (Thomas “School Choice: Future of new magnet schools uncertain 2015). What are the state’s, and even more specifically Hartford’s, Department of Education’s priorities?

Many of the reasons racial segregation persists in schools is due to issues like those of choice, access, transportation and public perception. There are some causes directly related to why magnet schools have not been as diverse as had been hoped as well.  In Christine Rossell’s dissertation entitled “The Desegregation Efficiency of Magnet Schools,” she even writes, specifically of magnet schools, “One possible explanation for why magnet schools did not have a more salutary effect on interracial exposure in the voluntary desegregation plans is that they may produce some white flight of their own (Rossell 2003: 12). Could she be right?

“White flight” speaks to white people moving to areas where they can live and be educated together and isolated from others (Kahlenberg and Potter, 2014: 47). Much of the justification for white flight stems from the fear that leaving a white community reduces the level of safety and pureness surrounding children. School lotteries, often weighted toward one of these particular racial or income groups, perpetuate this minimally diverse school system by giving some students more opportunities than others, solely due to race (Kahlenberg and Potter, 2014:131). In talking about white flight and race specific schools in their book, Kahlenberg and Potter also speak about institutions that do in fact develop with “themes tied to a particular cultural or ethnic group” (Kahlenberg and Potter, 2014:51). Some are Latino, some Greek, some African American and others Hawaiian. These cultural and racial separations completely eradicate the idea that schools of choice were first built in an effort to provide options, choice and limited discrimination, especially in urban environments like that of Hartford. Hopefully, with better evaluation, discussion and assessment, more of these schools will operate according to the state’s needs and the nation’s desires for racial integration. If not, perhaps these schools must be shut down.

For schools to remain open and operating in the city of Hartford, they must meet the standards of the Connecticut Adequate Yearly Progress Report. The qualifications include “the percent at or above proficient on the math and reading CMT and/or CAPT, the participation rate on the math and reading CMT and/or CAPT and an additional academic indicator, which, for high schools is the graduation rate and for elementary and middle schools is the percent at or above Basic on the writing portion of the CMT (“Connecticut Adequate Yearly Progress” 2012).” Magnet schools have had supportive evidence suggesting the potential their provided education maintains. On average, their students have higher statistical results on the CMT and CAPT standardized tests in comparison to their Hartford public school peers (Raioul and Sagullo 2012). While magnet schools have enhanced education for so many, especially minorities, they have not instituted enormous change for the overall levels of racial segregation in classrooms district, and state, wide. Christine Rossell may have been right in her theories about white flight. In 2000, Harford maintained a population of 18%, which was down from 44% in 1980. According to studies performed by Michael Sacks at Trinity College in 2008, “the number of whites had dropped from 61,000 to 22,000 in the two decades” (Sacks 2008: 2). He writes, “the decline in percentage white in Hartford between 1990 and 2000 was higher than in any other central city in the 102 largest metropolitan areas of the country” (Sacks 2008:2).

Racial segregation in schools, especially in schools of choice like those of charters and magnets, is positively unacceptable. In her article entitled “What Will you Think of Me? Racial Integration, Peer Relationships and Achievement Among White Students and Students of Color, Sabrina Zirkel writes of the great benefits that come from learning in an integrated environment. Some of the larger effects include the potential to curtail racism, provide a forum for mixed race friendships and increase school-wide test scores. She writes, “Studies of the long term effects of desegregation for the educational and professional outcomes of students of color provide qualified support for the argument that, on the whole, desegregated schools do produce more successful educational and professional outcomes for students of color and they do reduce prejudice and increase racial integration in the larger society” (Zirkel 2004: 58-59). Zirkel makes it clear integration is key to the future of education. However, understanding why integration has not fully occurred throughout the entire US, or even reduced racial stigma, is essential in developing new policy here in schools in Connecticut.

So many families, despite race, actually want the same education for their children. In their work entitled “Smarter Charter,” Kahlenberg and Potter write, “[A] survey asked parents to rank a list of student goals and school characteristics. Parents of all incomes were likely to value a strong reading and math curriculum. Learning good study habits and self-discipline was also first or second ranked student goal within each income group…the overall ranking of preferences was fairly consistent across income brackets” (Kahlenberg and Potter, 2014:125). This particular study and passage within the book proves that no matter what background, most parents do in fact want a quality learning environment for their children; accessibility just dictates who receives what.

(Note from the instructor: Students were ask to write essays under 2500 words, which would be about here. Evaluators may read as much as they wish, but should not rate the essay beyond this point.)

Early on in their book, Richard Kahlenberg and Haley Potter write, “American schools are not only about raising achievement and promoting social mobility; they are also…promoting an American identity, social cohesion, and democratic citizenship (Kahlenberg and Potter 2014: 55).” However, these goals, many of which were created and established decades ago, have not been entirely successful and are proving to be even less so today. Magnet schools are meant to be a solution to the constant conflict present between races when it comes to education. They contribute to the problem, just as Christine Rossell said they might and would. Racial segregation poses an enormous impediment to learning for individuals in classrooms throughout Connecticut, notably in cities like that of Hartford. Students are at a great disadvantage when being taught in a homogenous school. Ironically, this segregation is perpetuated in schools of choice, one example being those institutions that are magnets. Understanding why and how limited integrated segregation persists, especially in environments of supposed opportunity, is imperative in building policy to resolve these issues in the future.

Works Cited:

Beaudin, Barbara Q. Interdistrict Magnet Schools in Connecticut. Connecticut State Department of Education Division of Evaluation and Research. Retrieved May 2, 2015. (http://www.sde.ct.gov/sde/lib/sde/PDF/Equity/magnet/magnet_presentation_caims_11_2003.pdf).

Chen, Grace. 2015. What is a Magnet School? Public School Review. Retrieved May 3, 2015. (http://www.publicschoolreview.com/blog/what-is-a-magnet-school).

De La Torre, Vanessa. 2013. Hartford to Operate Two New Sheff Magnet Schools. The Hartford Courant. Retrieved May 1, 2015. (http://articles.courant.com/2013-03-20/community/hc-hartford-magnet-sheff-0321-20130320_1_new-magnet-magnet-schools-suburban-students).

Frankenberg, E., Siegel-Hawley, G., & Wang, J. 2010. Choice without Equity: Charter School Segregation and the Need for Civil Rights Standards. Civil Rights Project/Proyecto Derechos Civiles. Retrieved April 30, 2015. (http://civilrightsproject.ucla.edu/research/k-12-education/integration-and-diversity/choice-without-equity-2009-report/).

Kahlenberg, Richard D and Potter, Haley. 2014. A Smarter Charter: Finding what Works for Charter Schools and Public Education. New York, NY: Teachers College Press.

Lohman, Judith. 2010. The Racial Imbalance Law. OLR Research Report. Retrieved May 1, 2015. (http://www.cga.ct.gov/2010/rpt/2010-R-0228.htm).

McBride, Alex. 2006. Expanding Civil Rights: Landmark Cases. US Department of Education NY State Archives: NYSED.gov. Retrieved April 29, 2015. (http://www.archives.nysed.gov/edpolicy/research/res_essay_johnson_cole.shtml).

Orfield, Gary and Ee, Jongyeon. 2015. “Connecticut School Integration: Moving Forward as the Northeast Retreats” UCLA The Civil Rights Project 5. Retrieved April 29, 2015. (http://civilrightsproject.ucla.edu/research/k-12-education/integration-and-diversity/connecticut-school-integration-moving-forward-as-the-northeast-retreats/orfield-ee-connecticut-school-integration-2015.pdf).

Rioual, Brigit and Sagullo, Nicole. 2012. Are All Magnet Schools Created Equal? Brigit’s Blog: Just another Trinity College Commons. Retrieved May 1, 2015. (http://commons.trincoll.edu/brioual/).

Sacks, Michael. 2008. Inequality and Suburbanization in the Hartford Metropolitan Area, 1980-2000. Department of Sociology Trinity College.

Thomas, Jacqueline Rabe. 2014. Report: Many Connecticut charter schools ‘hyper-segregated’. The CT Mirror. Retrieved May 2, 2015. (http://ctmirror.org/2014/04/09/school-choice-many-schools-hyper-segregated/).

Thomas, Jacqueline Rabe. 2014. 60 Years after Brown vs. Board of Education: Still Separate in Connecticut. The CT Mirror. Retrieved May 1, 2015. (http://ctmirror.org/2014/05/16/60-years-after-brown-vs-board-of-education-still-separate-in-connecticut/).

Thomas, Jacqueline Rabe. 2015. School choice: Future of new magnet schools uncertain. The CT Mirror. Retrieved May 3, 2015. (http://ctmirror.org/2015/01/06/school-choice-future-of-new-magnet-schools-uncertain/).

Wells, Amy. 2009. Both Sides Now: The Story of School Desegregation’s Graduates. University of California Press: A George Gund Foundation Book in African American Studies.

Zirkel, Sabrina. 2004. What Will You Think of Me? Racial Integration, Peer Relationships and Achievement Among White Students and Students of Color. Mills College: Saybrook Graduate School and Research Center. Journal of Social Issues, Vol. 60, No. 1, 57-74.

1999-2015. Connecticut College Financial Aid Programs. College Scholarships.org. Retrieved May 1, 2015. (http://www.collegescholarships.org/states/connecticut.htm).

2002. Jim Crow Stories Plessy V. Ferguson. The Rise and Fall of Jim Crow. Retrieved May 1, 2015. (http://www.pbs.org/wnet/jimcrow/stories_events_plessy.html).

2011. MagnetMiddle.jpg 320×240 pixels. Retrieved May 3, 2015. (http://www.trincoll.edu/Academics/MajorsAndMinors/educational/PublishingImages/MagnetMiddle.jpg).

2012. Connecticut Adequate Yearly Progress. Connecticut State Department of Education. Retrieved May 1, 2015. (http://ctayp.emetric.net).

2013. What are Magnet Schools? Magnet Schools of America. Retrieved April 29, 2015. (http://www.magnet.edu/about/what-are-magnet-schools).

2014. History of Sheff v. O’Neill. Sheff Movement: Quality Integrated Education for All Children. Retrieved May 1, 2015. (http://www.sheffmovement.org/history-2/).

 2014. Sheff v. O’Neill. Wikipedia: The Free Encyclopedia. Retrieved May 1, 2015. (http://en.wikipedia.org/wiki/Sheff_v._O’Neill).

2015. Hartford Magnet Trinity College Academy. Trinity College. Retrieved May 3, 2015. (http://www.trincoll.edu/Academics/MajorsAndMinors/educational/Pages/MagnetMiddle.aspx).

2015. Enrollment in Public/Private School by Race. MapEd STORY MAPS. National Center for Education Statistics.  Censuus Bureau, American Community Survey 2008-2012 Profile Table CDP05. Retrieved April 30, 2015. (http://nces.ed.gov/programs/maped/storymaps/ACSEnrollment/index.htm).

2015. State and County QuickFacts: Connecticut. United States Census Bureau. Retrieved April 30, 2015. (http://quickfacts.census.gov/qfd/states/09000.html).

2015. State and County QuickFacts: Hartford County, Connecticut. United States Census Bureau. Retrieved April 30, 2015. (http://quickfacts.census.gov/qfd/states/09000.html).


The “Not So Dirty” Dozen, Plus a Few: Ways Hartford Magnet Schools Influence Student Enrollment

Posted on

How do magnet schools influence student enrollment? Kevin Welner previously published “The Dirty Dozen,” which describes ways charter schools influence student enrollment (Welner, 2013). Do magnet schools, which are founded upon different goals, use the same strategies to sway their student body? This essay aims to determine if and how Welner’s “dirty dozen” also apply to magnet schools in Hartford, how they are used differently, and what additional approaches magnets use.

Hartford Public Schools is an “all-choice” program, in which families submit lottery applications to their preferred district school, including charter and magnet schools (Dougherty et al., 2014). Charter schools aim to improve academic achievement, provide for educational innovation, provide vehicles for the reduction of racial, ethnic, and economic isolation, and provide a choice of public education programs for students and parents (Cotto & Feder, 2014). Although charters can have their charter revoked if they do not attract, enroll, and retain low income, minority, emerging bilingual students, and students with disabilities, no standards exist to measure this (Cotto & Feder, 2014). Magnet schools aim to reduce, eliminate, or prevent the racial, ethnic, or economic isolation of public school students, and offer a high-quality curriculum that supports educational improvement (Cotto & Feder, 2014). Magnet schools provide special curricular themes to attract students from both city and suburban districts (Dougherty, 2015). Funds for magnets can be withheld if the student body does not contain between 25% and 75% students of color, as in accordance with the Sheff vs. O’Neil standards (Cotto & Feder, 2014).

Location and Transportation 

Welner argues that charter schools choose their location with the students they intend to serve in mind, taking into account the availability of transportation. The Capitol Region Education Center, CREC coordinates free transportation to magnet schools, even for students attending schools out-of-district (CREC Schools, 2015), whereas charters only guarantee transportation to in-district students (Connecticut State Department of Education, 2015). The wider transportation services offered to students attending magnet schools allows them to attract students from different backgrounds in order to uphold the Sheff standards, while charters are not held to such standards and so do not need to provide transportation to such a wide region

RSCO transportation zone map (Source: Regional School Choice Office)

This theme is evident in field notes collected by my classmates from attending choice fairs and open houses. IF, at an open house, noted that the rep discussed “how they provide transportation regardless of location.” Additionally, when SS and JC spoke with a student attending a magnet school at the RSCO fair, the student “volunteered the information that buses are free.” AL and SG, also at the RSCO magnet fair, described an area solely for providing information about transportation for families interested in magnet schools in the Hartford area. Thus, at least in Hartford, it appears that magnets are not trying to exclude students based on their location as charters allegedly may do; instead, they are accommodating students from the city and surrounding suburbs.

Although these schools may be trying to accommodate far-away students, location will always play a role in enrollment. Students may opt out of a free but long commute to a magnet in favor of a quick commute to a neighborhood school. This location approach is not necessarily mal-intentioned, though. Charter schools in Hartford likely are not intentionally excluding certain students, but locating themselves in areas of high need.

Advertisement 

Welner’s “Mad men” approach argues that charters shape their school’s demographics using advertising and images. Hartford magnets appear to use this approach more to achieve diversity and inclusiveness, while Welner implies that charters may target or deter specific student demographics. AM noted that the students who represented the magnet school he visited were of different races, white and Hispanic. AM described a video shown that featured “an anecdote about a white girl and a black girl who became good friends through school,” and another clip in which a teacher says “not one of my students look alike.”

Source: Hartford Magnet Trinity College Academy

Magnets appear to be emphasizing diversity in their advertising to encourage students of different races to feel comfortable applying, and not simply targeting or deterring students of a certain race. AG and RU observed an elementary magnet distribute brochures in both English and Spanish, and EK, at the RSCO fair, noted that school representatives of magnets sometimes spoke Spanish to Spanish-speaking families. Additionally, the RSCO catalog, which provides information about Hartford’s magnet schools, is available online in Spanish.

LS, at the RSCO fair, observed one booth for a while and “noticed that the presenter’s spiel was different based on who came over to the booth.” He observed that when a black, seemingly lower class family came over, transportation was extensively focused on, while when a white family came, the rep skipped the transportation portion of his spiel and instead focused more on curriculum. Thus, these Hartford magnet schools are not targeting their advertisements for or against a particular group, as Welner implied in “Mad men”, but are tailoring them to fit the needs of each of the many target populations, likely to adhere to the Sheff standards.

Application and Enrollment Requirements 

Welner suggests that charters sometimes place conditions on applications, with lengthy applications and mandatory visits. In Hartford, each charter requires its own application, while there is a single application for all magnets, managed by RSCO, in which up to five magnet schools can be ranked. This lengthy application  appears daunting at first, but only asks for basic information, and rankings of either open choice or magnet programs. Jumoke Academy, a charter school, requires five student essays on top of similar information, and Explorations Charter School requires incoming students to submit two essays. Odyssey Community School, another charter, requires interested students to attend an open house. Requiring essays and attendance at events weeds out unmotivated families with likely lower-achieving kids, and lower-income working parents who find it difficult to attend open houses and help their child write five essays. No such essays or visits are required to apply to any magnet schools. Auditions are not even required for the Hartford arts magnets, making them more accessible to lower income students who cannot afford private lessons. Thus, Hartford charters, with more extensive, more complicated applications that are unique to each school seem to make more use of this “Hooping it up” strategy than magnets with their simpler, single application.

No evidence was found for Welner’s “Illegal and Dicey Practices” approach, in which charters may ask for Social Security cards or birth certificates, even though these cannot be required by law. Nowhere on the RSCO application was there a request for social security numbers or birth certificates. This held true for the easily accessible Hartford charter school applications, indicating that Hartford choice schools may not employ this “dirty” approach.

There is also no apparent evidence of Welner’s “Send us your best” strategy in the RSCO application, in which conditions like needing a certain GPA or prerequisites are placed upon enrollment. Although few charter applications could be accessed because the application period recently closed, Explorations Charter School did employ this tactic, by requiring that students entering the high school not as freshmen already have certain number of credits. Once enrolled, students must pass 80% of their courses and be present 90% of the time. Again, although little data is available, Hartford charters may more readily place conditions upon enrollment.

Steering Away 

Charters also may use Welner’s “bum steer,” in which schools steer away less desirable students. This indirectly appeared in the field notes, but in a more positive way, with magnets emphasizing finding the right fit. IF explained that one magnet “offers a program in which a prospective and/or accepted student can shadow a current student because the school only wants students who want to be there.” EK, at the RSCO fair, observed, “several schools also encouraged parents to have their child experience a day at their school and decide for himself/herself if it would be a good fit.” Rather than the school representatives themselves steering away students who may not be the best match, they encourage students to make this “fit” judgment themselves. Thus, the magnets are, at least in theory, getting the students who are a good fit for the school without using a manipulative approach.

Relatedly, charters may use Welner’s “not in service” approach by simply not readily providing services for a group of higher-needs students. AM, at a magnet open house, explained, “these special arts programs received a lot of airtime when things like special education and ELL programs were skimmed over.” While state law requires schools enrolling more than twenty English language learners (ELL) to offer a school-wide bilingual education program, there is no requirement that choice schools offer such a program if ELL enrollment is under this threshold (Cotto & Feder, 2014). The school’s failure to mention any services for ELL students was possibly an attempt to discourage these students from applying, saving the school from bearing the financial burden of implementing these services. ELL students in Hartford are less likely to attend magnet and charter schools than local public schools (Cotto & Feder, 2014), perhaps due to the “not in service” approach.  However, as discussed above, magnet schools did make efforts to cater to ELL students by advertising in Spanish.

ELL students are the most underrepresented in charter schools, followed by magnet schools. (Source: Cotto & Feder, 2014)
In Hartford, there is the smallest percentage of ELL students in charter schools, followed by magnet schools. (Source: Cotto & Feder, 2014)

Discipline 

Welner’s “discipline and punish” tactic involves charters using harsh discipline regimes, leading to high expulsion rates. While data was unavailable for expulsion rates, a feature on CT Mirror compares disciplinary incidents at a given school to the statewide average. Data for the available Hartford magnet schools was perplexing; many schools reported zero disciplinary incidents in 2012-2013, however, even more schools reported numbers higher than the state average, most frequently school policy violations.  This could either indicate great variation in school policies and disciplinary strategies between Hartford magnets, or some magnets not reporting this information. Many charters with accessible data were also above the state average, again with the majority being for policy violations. While the data does not indicate if these incidents led to expulsions, the high numbers suggest that some of Hartford’s choice schools may employ harsh discipline regimes, perhaps in an attempt to remove disruptive students, as Welner suggested.

CT Mirror data for the Sport and Medical Sciences Academy, with the highest number of disciplinary incidents of all Hartford magnet schools for which data was available.
CT Mirror data for the Sport and Medical Sciences Academy, with the highest number of disciplinary incidents of all Hartford magnet schools for which data was available.(Source: CT Mirror)

Approaches with Limited Data 

Welner discusses additional approaches, however limited data for these is available. Such strategies include “flunk or leave”, in which school officials threaten to hold the student back a grade if they remain in the school, and “the fitness test,” in which parents of less successful students are counseled to consider alternative options. It cannot be determined if these apply to Hartford magnets. There is also little data available for Welner’s “going mobile (or not)” strategy, in which charters decide whether or not to backfill the students they lose, either during the year or for higher grades. AG and RU, at a magnet open house, explained that openings in grades other than the school’s starting grade “depended on how many people leave,” suggesting they do replace students the following year. However this is an elementary magnet, so it is not known if magnets backfill in higher grades or allow new students to enter mid-year.

Magnet Themes 

Welner explains that charters decide early on what types of students to cater to when determining what niche the school is designed to fill, such as focusing on rigorous academics or special needs students. Expanding on this approach, magnets more indirectly influence enrollment with their special curricular themes. Hartford magnet themes include arts and humanities, STEM, college prep, vocational, and character education. These themes, which are intended to attract students, may actually attract certain students while repelling others.

STEM schools, for instance, may attract more higher-income, well-educated families who understand the importance of such curriculum. LS, observing a STEM magnet booth at the RSCO fair, described how an Asian mother from an affluent suburb had already researched the school, and asked the representative about specific opportunities and “what the school would offer her son.” In contrast, a black mother from Hartford asked more general and “practical questions, including after school care options and transportation.” Although both expressed interest in the school, the class difference likely explains this difference in questions, and the Hartford mother’s focus on after-school care and transportation suggests that practicality, not special programs, is most important to her family. While the curricular theme may be the selling point for an affluent family, lower-income families may have to settle for a more convenient school. AL and SG, at the RSCO fair, also commented, “despite the fair being particularly minority heavy in attendance, the individuals looking at the specialized schools, whether performing arts or science based, were predominantly white.” Magnet schools serve the lowest percentage of free and reduced lunch eligible students in Hartford (Cotto & Feder, 2014).  Whether or not this holds true for STEM schools, the specialized themes may partly explain why the least low-income students enroll in magnet schools.

Hartford magnet schools enroll the lowest percentage of students eligible for free or reduced price meals. (Source: Cotto & Feder, 2014)

Magnets also influence enrollment by not offering particular themes. For instance, there are no Hartford magnets with a dual language theme, which also may explain the lower ELL enrollment in Hartford magnets than local public schools (Cotto & Feder, 2014). Perhaps if magnets expanded the breadth of their themes, a wider population will be attracted.

Availability of Information 

Another bias in choice schools not accounted for by Welner is the availability of information about the schools. Information can often be found online on school websites. However, not every family in Hartford owns a computer, or knows how to use one, creating a bias against low-income families and families with illiterate parents, also biasing against likely lower achieving children. Valuable information is also gathered from attending open houses and school fairs that some parents cannot easily attend. HH, at the RSCO fair, noted “some parents expressed concern that they may not be able to make it to the specific info sessions offered by some schools due to the fact that those sessions are normally offered during weekdays.”  Working, lower-income parents likely have less flexible hours, or are unable to afford childcare, and cannot attend open houses to get the important information. Although this likely impacts student enrollment, this is probably unintentional, and thus more “accidental” than “dirty” in biasing access to choice schools.

Conclusion 

Many of these approaches mentioned in “The Dirty Dozen” that charter schools may use seem to be less readily employed by Hartford magnet schools. With the magnets’ inclusive approaches in advertising and transportation and a convenient application, for instance, magnets seem to be well-intentioned and trying to create a diverse student body catering to different types of families and students rather than purposely trying to exclude certain types of students. However, the attempts do not always accomplish this inclusiveness, and some factors, like themes and availability of information, may unintentionally leave some students behind. While magnets may advertise in Spanish, for instance, they still enroll a smaller ELL population than the neighborhood schools. This indicates that magnets do not intend to exclude this population, but other factors play a role. If choice schools wish to prevent these “accidental” factors that make certain students less likely to enroll from occurring, these populations must be identified so that choice schools can better recruit these students.

(Note from the instructor: Students were ask to write essays no more than 2500 words, which would be about here. Evaluators may read as much as they wish, but should not rate the essay beyond this point.)

References

Attend and Apply (2015). Explorations Charter School. Retrieved from http://explorationscs.com/attendapply.html Charter School Questions and Answers. (2015).Connecticut State Department of Education. Retrieved from http://www.sde.ct.gov/sde/lib/sde/pdf/equity/charter/faqs.pdf

Cotto, R. & Feder, K. (2014). Choice Watch: Diversity and Access in Connecticut’s School Choice Programs. CT Voices for Children. Retrieved from http://www.ctvoices.org/sites/default/files/edu14choicewatchfull.pdf

Dougherty, J., Zannoni, D., Block, M., & Spirou, S. (2014). Who Chooses in Hartford? Report 1: Statistical analysis of Regional School Choice Office applicants and non-applicants among Hartford resident HPS students in grades 3-7, Spring 2012. Trinity College Digital Repository. Retrieved from http://digitalrepository.trincoll.edu/cgi/viewcontent.cgi?article=1045&context=cssp_papers

Dougherty, J. (2015). A Vocabulary for Understanding School Choice in Connecticut. Presentation for CSPL 341: Innovation in Education- Choice Seminar.

How to Apply (2015). Odyssey Community School. Retrieved from http://www.odysseyschool.org/about-odyssey/admission-information

Explorations Charter School Application (2015). Retrieved from http://explorationscs.com/images/2015-2016_Application_Long_Form_.pdf

IF, SS, JC, AL, SG, AM, EK, LS, HH, AG, RU (2015). Class Field Notes.

Jumoke Academy Application (2015). Retrieved from http://jumokeacademy.org/wp-content/uploads/2014/09/JumokeAcademyApplication2015-2016.pdf

RSCO Catalog (English). (2015). The Regional School Office. Retrieved from http://www.choiceeducation.org/javascript/tiny_mce/plugins/filemanager/files/RSCOcatalogFINALNov19.pdf

RSCO Catalog (Spanish). (2015). The Regional School Office. Retrieved from http://www.choiceeducation.org/javascript/tiny_mce/plugins/filemanager/files/RSCOcatalogSPANISH_web.pdf

RSCO Lottery Application (2015). The Regional School Choice Office. Retrieved from http://www.choiceeducation.org/javascript/tiny_mce/plugins/filemanager/files/RSCOlotteryapp201516_FINALDRAFT.pdf

The RSCO Transportation Zone. (2015). The Regional School Choice Office. Retrieved from http://www.choiceeducation.org/javascript/tiny_mce/plugins/filemanager/files/rsco_transportationzone.pdf

Transportation. (2015).CREC Schools. Retrieved from http://www.crecschools.org/for-parents/transportation/

Video. (2015).  Hartford Magnet Trinity College Academy. Retrieved from http://hmtca.hartfordschools.org/

Welner, K. G. (2013). The Dirty Dozen: How Charter Schools Influence Student Enrollment. Teachers College Record. [online], http://www.tcrecord.org

Your School (2015). The CT Mirror. Retrieved from http://projects.ctmirror.org/yourschool/index.php