A few weeks ago, attorney Wendy Lecker asked me in an interview for the Stamford Advocate, “Do Connecticut charter schools outperform district schools?” My answer was, “Not exactly”.
As my Choice Watch report (Cotto & Feder, 2014) demonstrated, charter schools in Connecticut tend to serve a relatively more advantaged group of (mostly) Black and Latinx children including fewer children with disabilities, emerging bilingual children, and children eligible for free and reduced priced meals compared to the students in local public schools in the same cities as the charter schools. As a result, comparing the test results of charter schools with local public schools is like comparing “apples to oranges” because they often serve very different groups of children.
However, using a simple scatterplot chart, it is fairly easy to show that charter schools’ mean test results are not overwhelmingly better when compared with public school districts that have similarly-situated students in terms of a rough income indicator. Other scholars, such as Bruce Baker (2012) at Rutgers University, have constructed scatterplots of income vs. 7th grade math test results to demonstrate similar observations about charter and public schools.
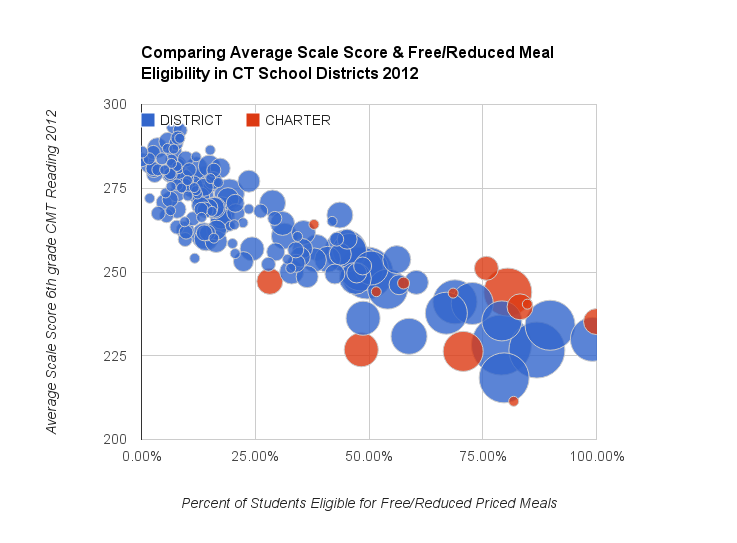
For example, below I constructed an interactive scatterplot that compares 6th grade average scale scores on the CMT reading (2012) versus percentage of children eligible for free and reduced priced meals (FRPM) at the district level (Google sheet data here). This scatterplot data visualization has three major data points. First, each public district and charter school is positioned by the the overall percent FRPM (x-axis). Second, each district is positioned on the y-axis by its mean scale score on 6th grade CMT reading. Third, the size of the dots correspond to the percentage of emerging bilingual children (crudely labeled as “English Language Learners” by the State).
You can scroll over the dots to see the public school district or charter school name and their demographics and test data. Public school districts are in blue dots and charter schools are in red dots. By placing these data points on a scatterplot, we can more easily compare the average test results of districts and charter schools that are similar in terms of district-wide free and reduced meal eligibility. (See the end for notes on limitations of this data and method.)
Source: CT State Department of Education, 2015.
So what does this scatterplot show? Here are some observations:
- There is a strong negative linear relationship (r= -.869) between this rough income indicator (eligibility for free and reduced priced meals) and average scale score on 6th grade CMT reading. (i.e. as free and reduced priced meal eligibility increases, average reading scores decrease)
- When compared to similar districts by income, some (4) charter schools appear to have higher than average test results, some (4) have lower than average test results, and some (4) are right in the middle of the pack, or near the average.
- If charter schools (red dots) had overwhelmingly higher test results, then we would expect more of their average scores to be above the majority of blue dots at their % FRPM level.
Want a closer look?
This second scatterplot chart only compares charter schools with the public school districts where they are located. The same pattern appears.
For example, Bridgeport Public Schools enrolled children that were 99% eligible for FRPM and 12.6% emerging bilingual (ELL). By comparison, all Bridgeport charter schools had higher average scale scores in reading, but lower rates of children eligible for free and reduced priced meals (68-85%) and emerging bilingual students (0-4%). There are exceptions, of course, such as Amistad Academy, which often appears comparable to New Haven Public Schools in terms of %FRPM, %ELL, and higher in average scale score.
And there are examples on the other end of the spectrum. The hypersegregated Stamford charter schools contain larger proportions of Black and Latinx students, those eligible for free/reduced price meals, and those with disabilities compared to the local Stamford public school district. They also appear to be outliers in terms of having very low average scale scores.
Source: CT State Department of Education, 2015.
This test result (“performance”) question is important because it is at the center of claims made about charter schools in Connecticut. The claim that charter schools achieve superior test results as a result of effort, choice, accountability, educational program, governance structure, or some other reason, is frequently cited by charter school lobbyists at the legislature and the CT State Department of Education.
The simple claim hinges on a statement like this one from a presentation on charter schools by the CT SDE: “Of the 14 charter schools that administered the spring 2013 Connecticut Mastery Test, 12 schools (or 86%) outperformed their host district with their overall SPI.” (CT SDE, 2015) With this statistic, we are left to conclude (or told by the charter school lobby) that charter schools are supposedly excelling compared to local public schools.
The CT SDE presentation (below) offers similar statistics and a chart highlighting some demographics of charter schools versus “alliance” and all other districts, but it does not caution the reader these characteristics could impact test results and comparisons. What the CT SDE and charter school lobbyists are not explicitly telling you in these claims is that charter schools often serve a relatively more advantaged group of Black and Latinx children compared to the local public schools where they are located and these children are likely to do relatively better on standardized tests because standardized tests favor more advantaged groups of people. Therefore, it is not a fair comparison to directly compare charter schools test results to those in local public school districts without some sort of modification (e.g. compare districts similar in income levels and/or other characteristics).
 Source: CT State Department of Education, 2015.
The State is comparing “apples (public schools) to oranges (charter schools)” on test results, despite knowing (it’s their data!) that the massive demographic differences that make these simple comparisons very misleading. To be sure, the CT SDE assists in making these same simplistic comparisons of test results between urban and suburban schools districts as well. This type of misleading comparison of test results persists and is now baked into the CT State Department of Education policy on reviewing and renewing charter schools.
All of this is meant to say that using blunt comparisons of test results does not prove that charter schools or public schools are any better or worse than each other in terms of academic performance, or any other characteristic. Instead, I am arguing that comparisons of test results must account for often massive demographic differences. This was a major recommendation of the Choice Watch (2014) report. I would also add, as I’ve written elsewhere, that school performance should be thought of in broader terms than standardized tests. Simple comparisons of standardized test results will always favor schools with barriers to entry and participation (e.g. charter, magnet, vocational technical schools) and advantaged districts where families must buy or rent homes to attend local schools (affluent, suburban).
So when somebody asks the question, “Do Connecticut charter schools outperform public school districts?”, how will you answer?
Notes: 1. There are many other and better ways of analyzing this question about charter and public schools. My observations above are based on scatterplot charts that crudely “account” for income (FRPM). 2. The data above comes from 2012, the most recent data in which average scale score on State tests can be compared to other demographic information. 3. Finally, the %FRPM applies to all grades in the district, while the average scale score applies to all students in a district in the 6th grade taking the standard version of the test. The State does not share %FRPM data at the grade level. 4. Average scale scores are a better measure of central tendency compared to percent of students at proficient or goal because scale scores do not lump students status levels at arbitrary cut points.