
Based upon the nature of my hashtag, I believe that the place that I will see the most discussion regarding my topic will be inside the United States. Due to the fact that this hashtag pertains to the political and social standing within the United States, I think tweets will be generated by users in the U.S. If we are being even more specific I think that there will be a lot of discussion in mainly blue states. The section of the globe that I believe will also be generating data would be around our capital, which is around 40 degrees North and 90 degrees West.
I had a total of 21508 tweets and of those 21508 tweets only 16 of them were mappable. When calculating this percentage, I found that 16/21508= .074391%.
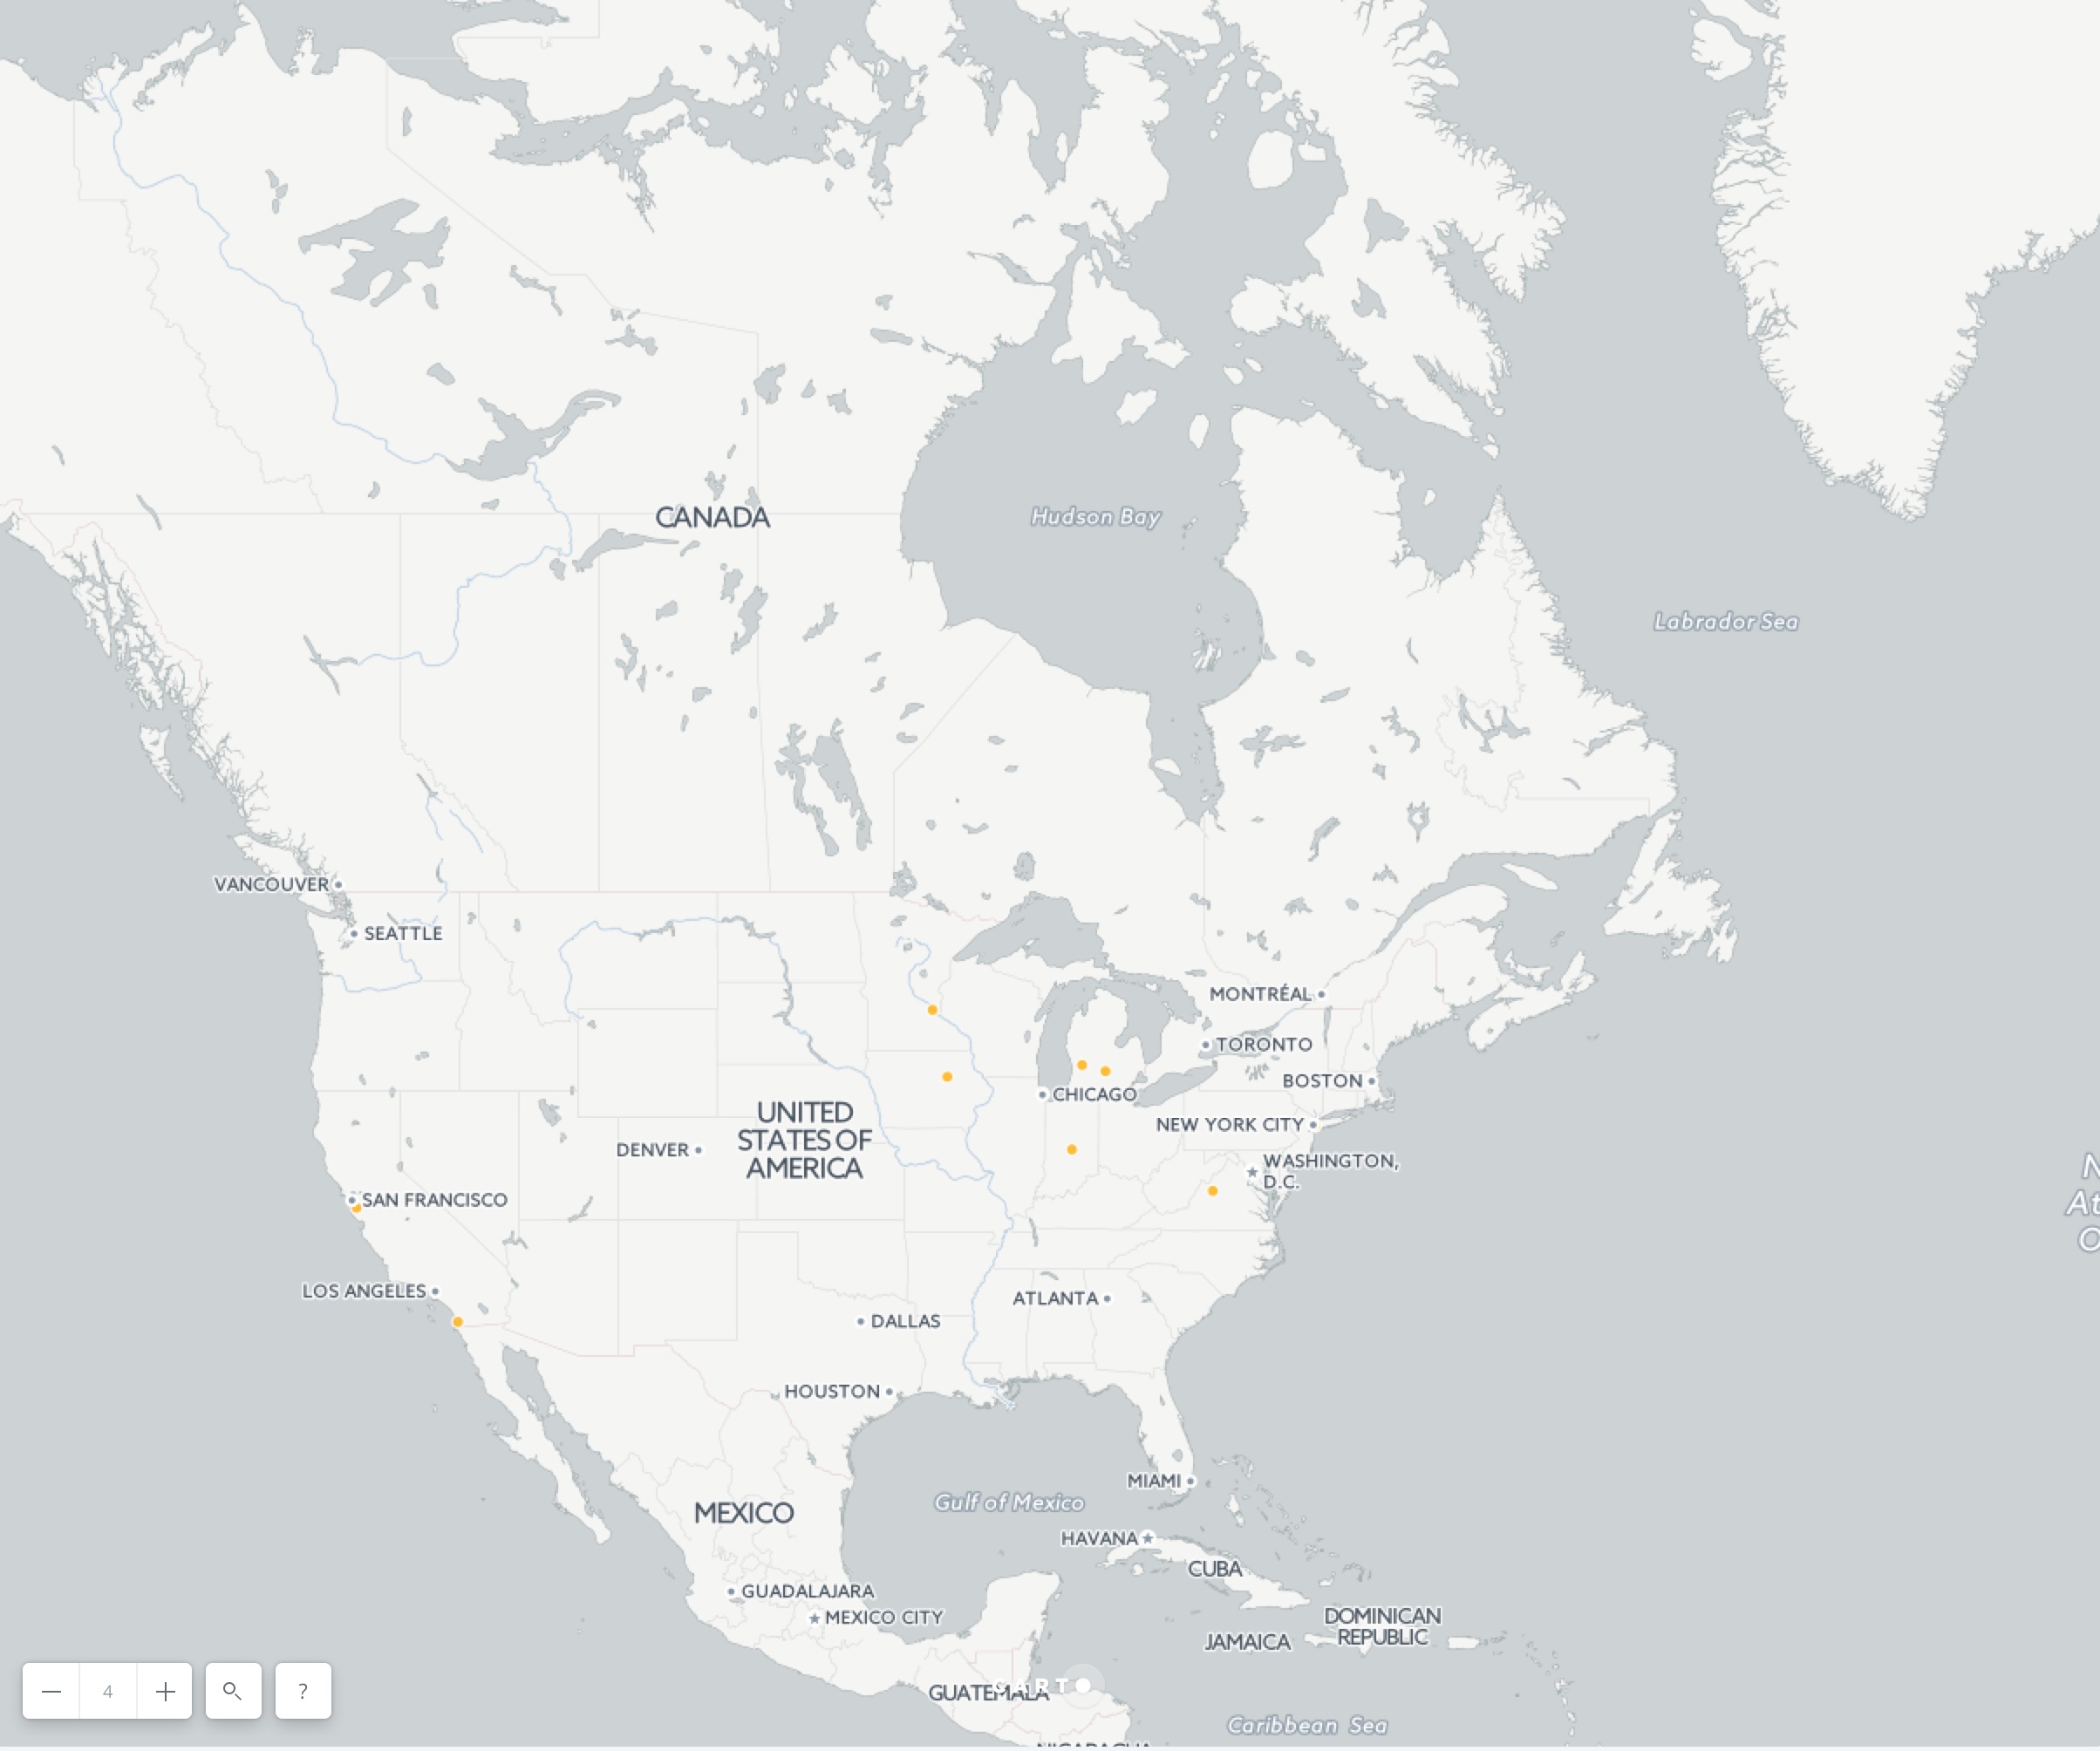
When understanding data visualizations and why it matters, Yau explains how effective visualizations are able to enable users a way in which they can analyze data in a more meaningful way. By creating visualizations one is able to communicate this information in a way that allows for a better evaluation of the overall data and what it represents. When mapping out my own data based upon location I found that most tweets were located anywhere between 32-44 degrees North and 73-122 degrees West. When looking at my initial hypothesis this fits in exactly where I had planned it would be. I am not surprised to see that all of these tweets were being generated from inside the United States and that many were from major places such as New York and San Diego. When looking at these users based upon their language it appeared that they all spoke english. This also did not surprise me, as I know this is an issue that is surfacing throughout the United States thus I would believe that most if not all would be english speakers.
When considering the definition of big data and evaluating the data that my hashtag currently has, I would not consider my data to be big data. According to Boyd and Crawford “Big Data not only refers to very large data sets and the tools and procedures used to manipulate and analyze them, but also to a computational turn in thought and research.” Although my data does display an intense discussion regarding a very controversial topic, I am not sure that my data is large enough yet to display a turn in thought and research. When defining big data, one must consider its volume, veracity, variety, and its velocity. First off, when considering its volume, big data would refer to data that would be more than a personal computer can process. Although my hashtag is generating a lot of discussion, when seeing the tweets that are mappable I was only able to collect 16 tweets total, which is far off from what would be considered “big” on a quantitive level. When considering veracity it is more difficult to assess my data as accurate or inaccurate due to its more of a subjective topic. When looking at its variety, there is some variety, but most of the tweets are similar in nature and many even contain the exact same context. Finally, when looking into the velocity, there are tweets being produced at a pretty fast speed, but not one that would allow it to be considered “big data.” Overall, I believe that right now although my hashtag is generating interesting discussion, it cannot yet be considered big data. The topic is provoking but does not display the type of turn in thought and research that Boyd and Crawford point at. I do think, however, that with our current political standing something will occur during the semester that will cause an eruption with my hashtag that could allow for big data.
Of my 21508 tweets only 16 of them were mappable, displaying .074391% of my tweets can be mapped. When looking at the other members of my group I found that my hashtag generated the second highest percentage. Naty’s hashtag #makeamericagayagain had 1% of the 748 tweets and Olivia’s hashtag #lgbtqrights had 3/2036= .0014%. I was not surprised that all of us had very similar percentages of mappable tweets. It is interesting to note that although Naty’s hashtag generated the highest percentage of mappable tweets, it had the least amount of tweets overall. I am most surprised at this due to the similarity between her and Olivia’s hashtag. I feel as though both Olivia and my hashtag represent a larger sum of people, thus more people are engaging in their conversation. Also, the community that Naty’s hashtag speaks to is also included in Olivia’s hashtag, but Olivia’s also pertains to other groups as well. This could be why we were able to generate more overall tweets despite the fact that they were the same percentage of mappable ones, which could just be due to the nature of this communities location services and privacy settings- assuming that we have a similar population of users.
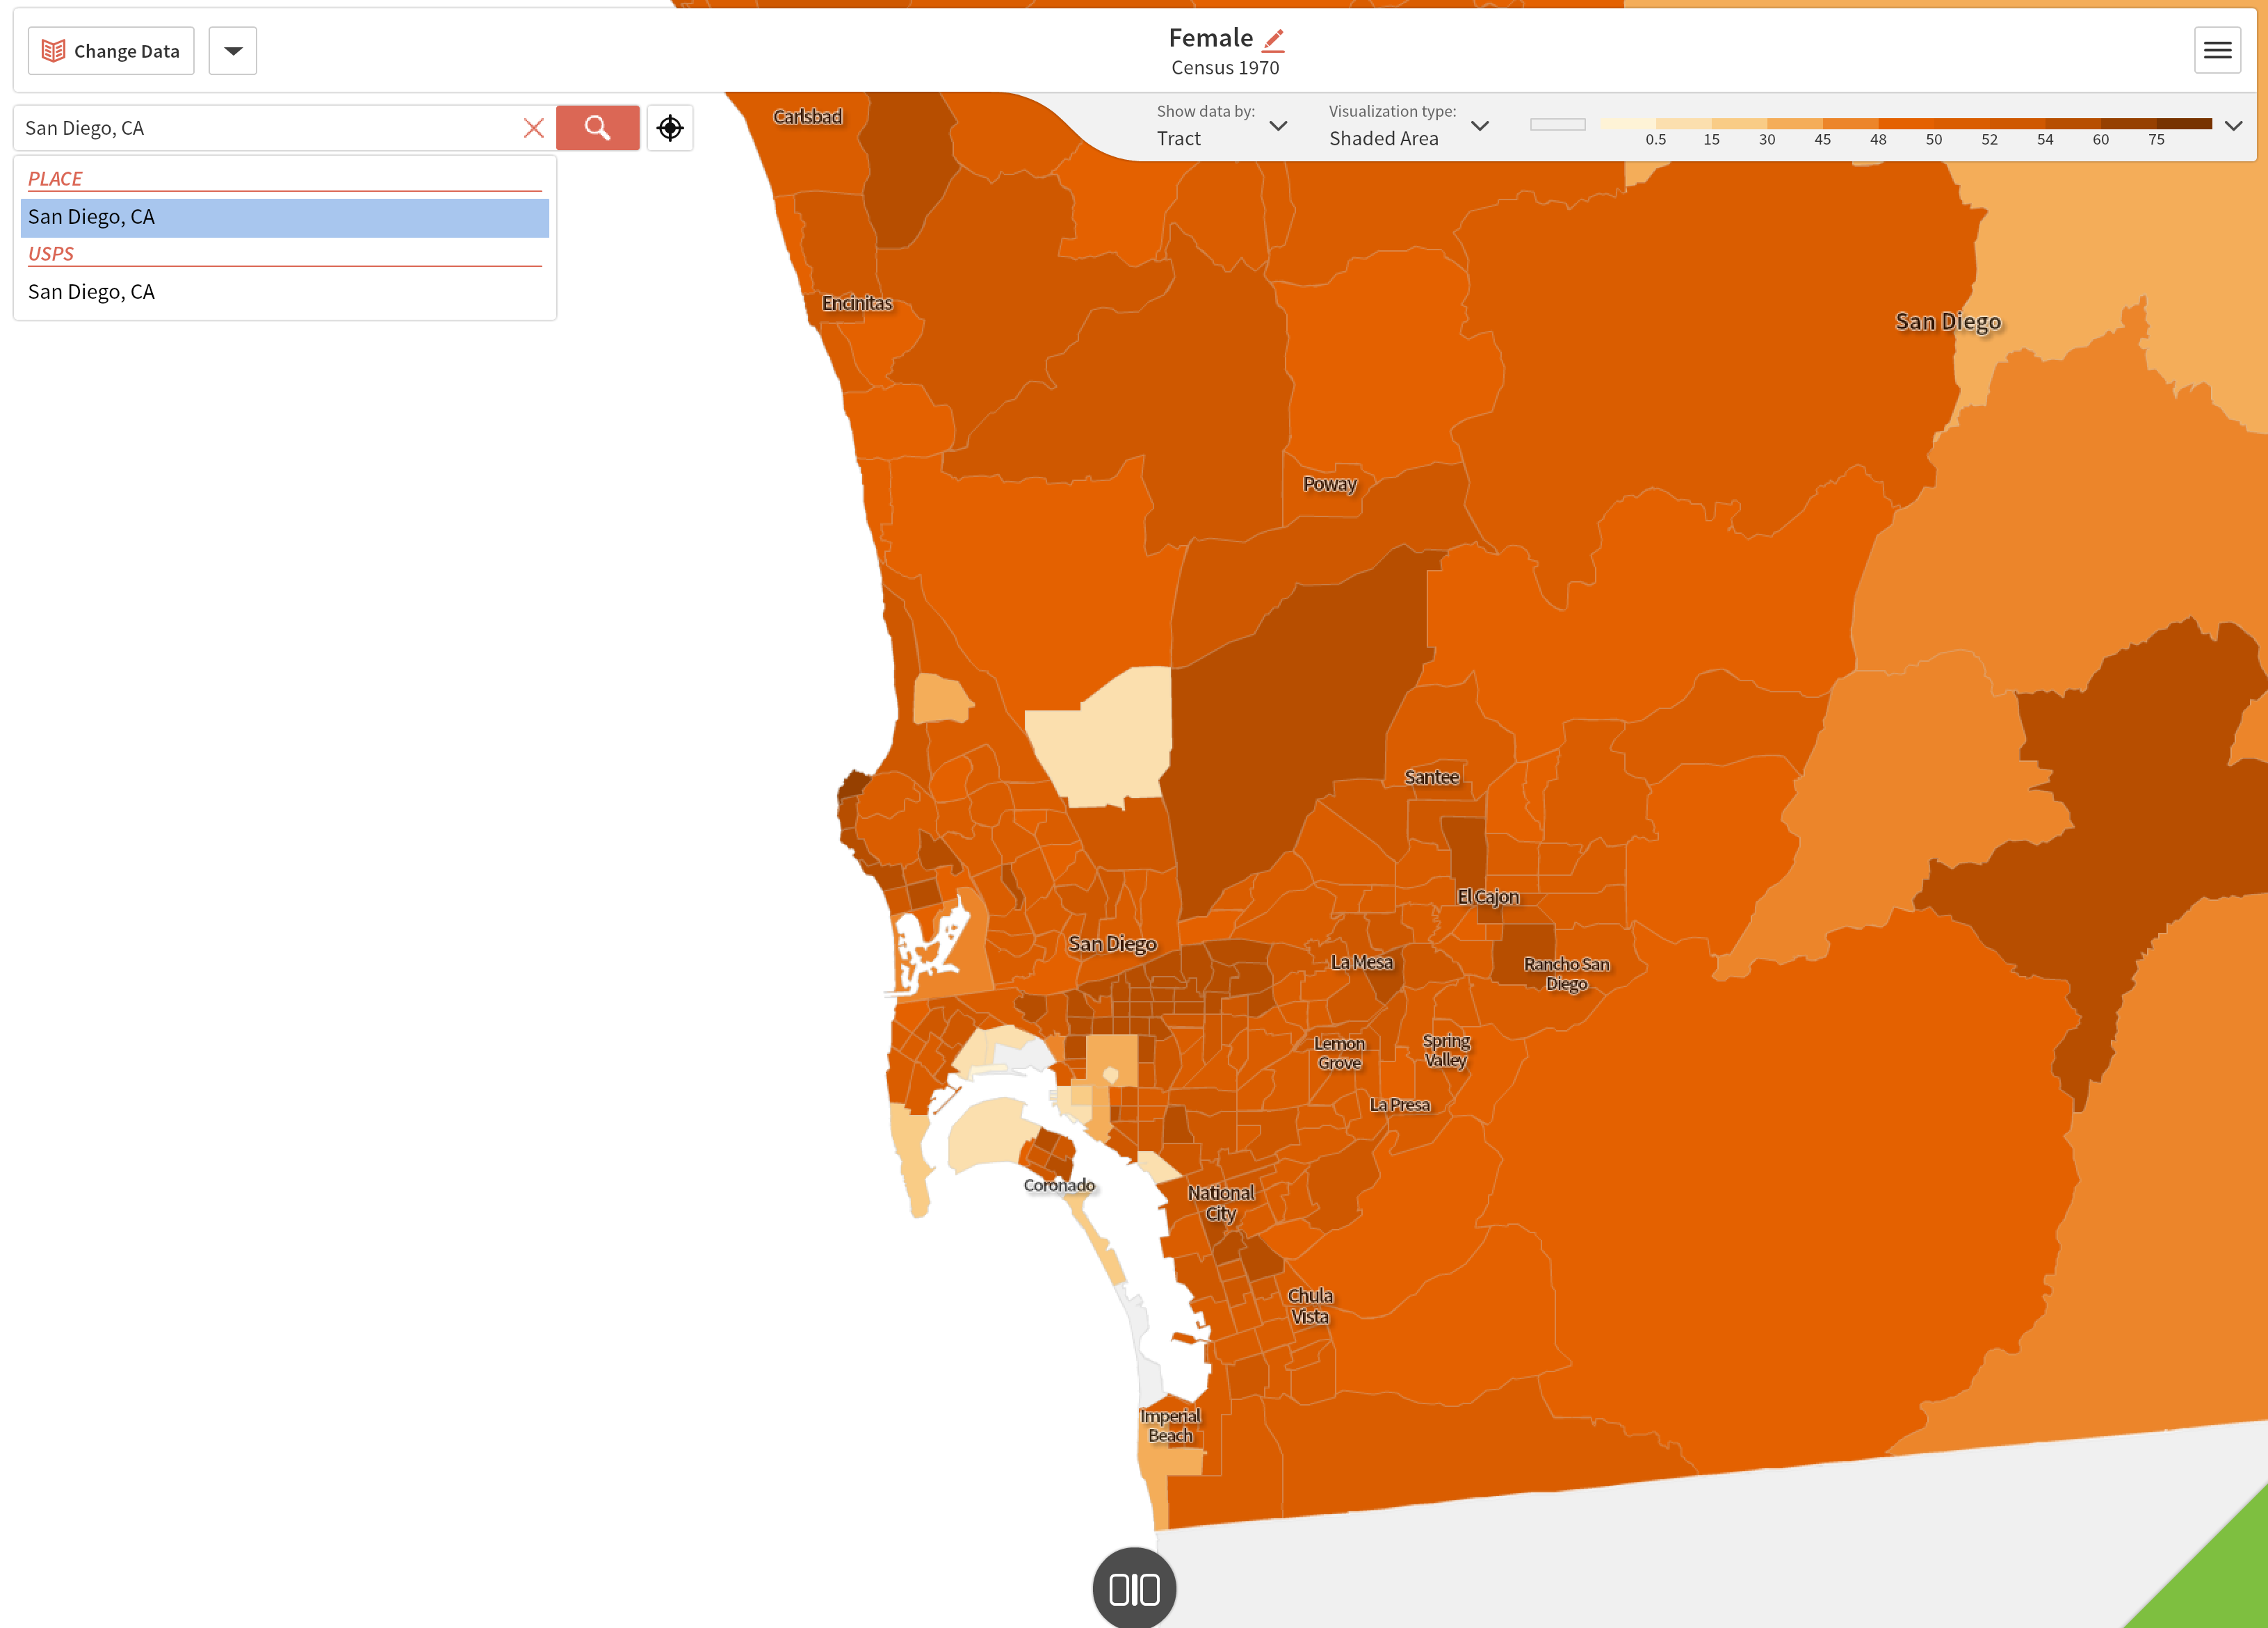
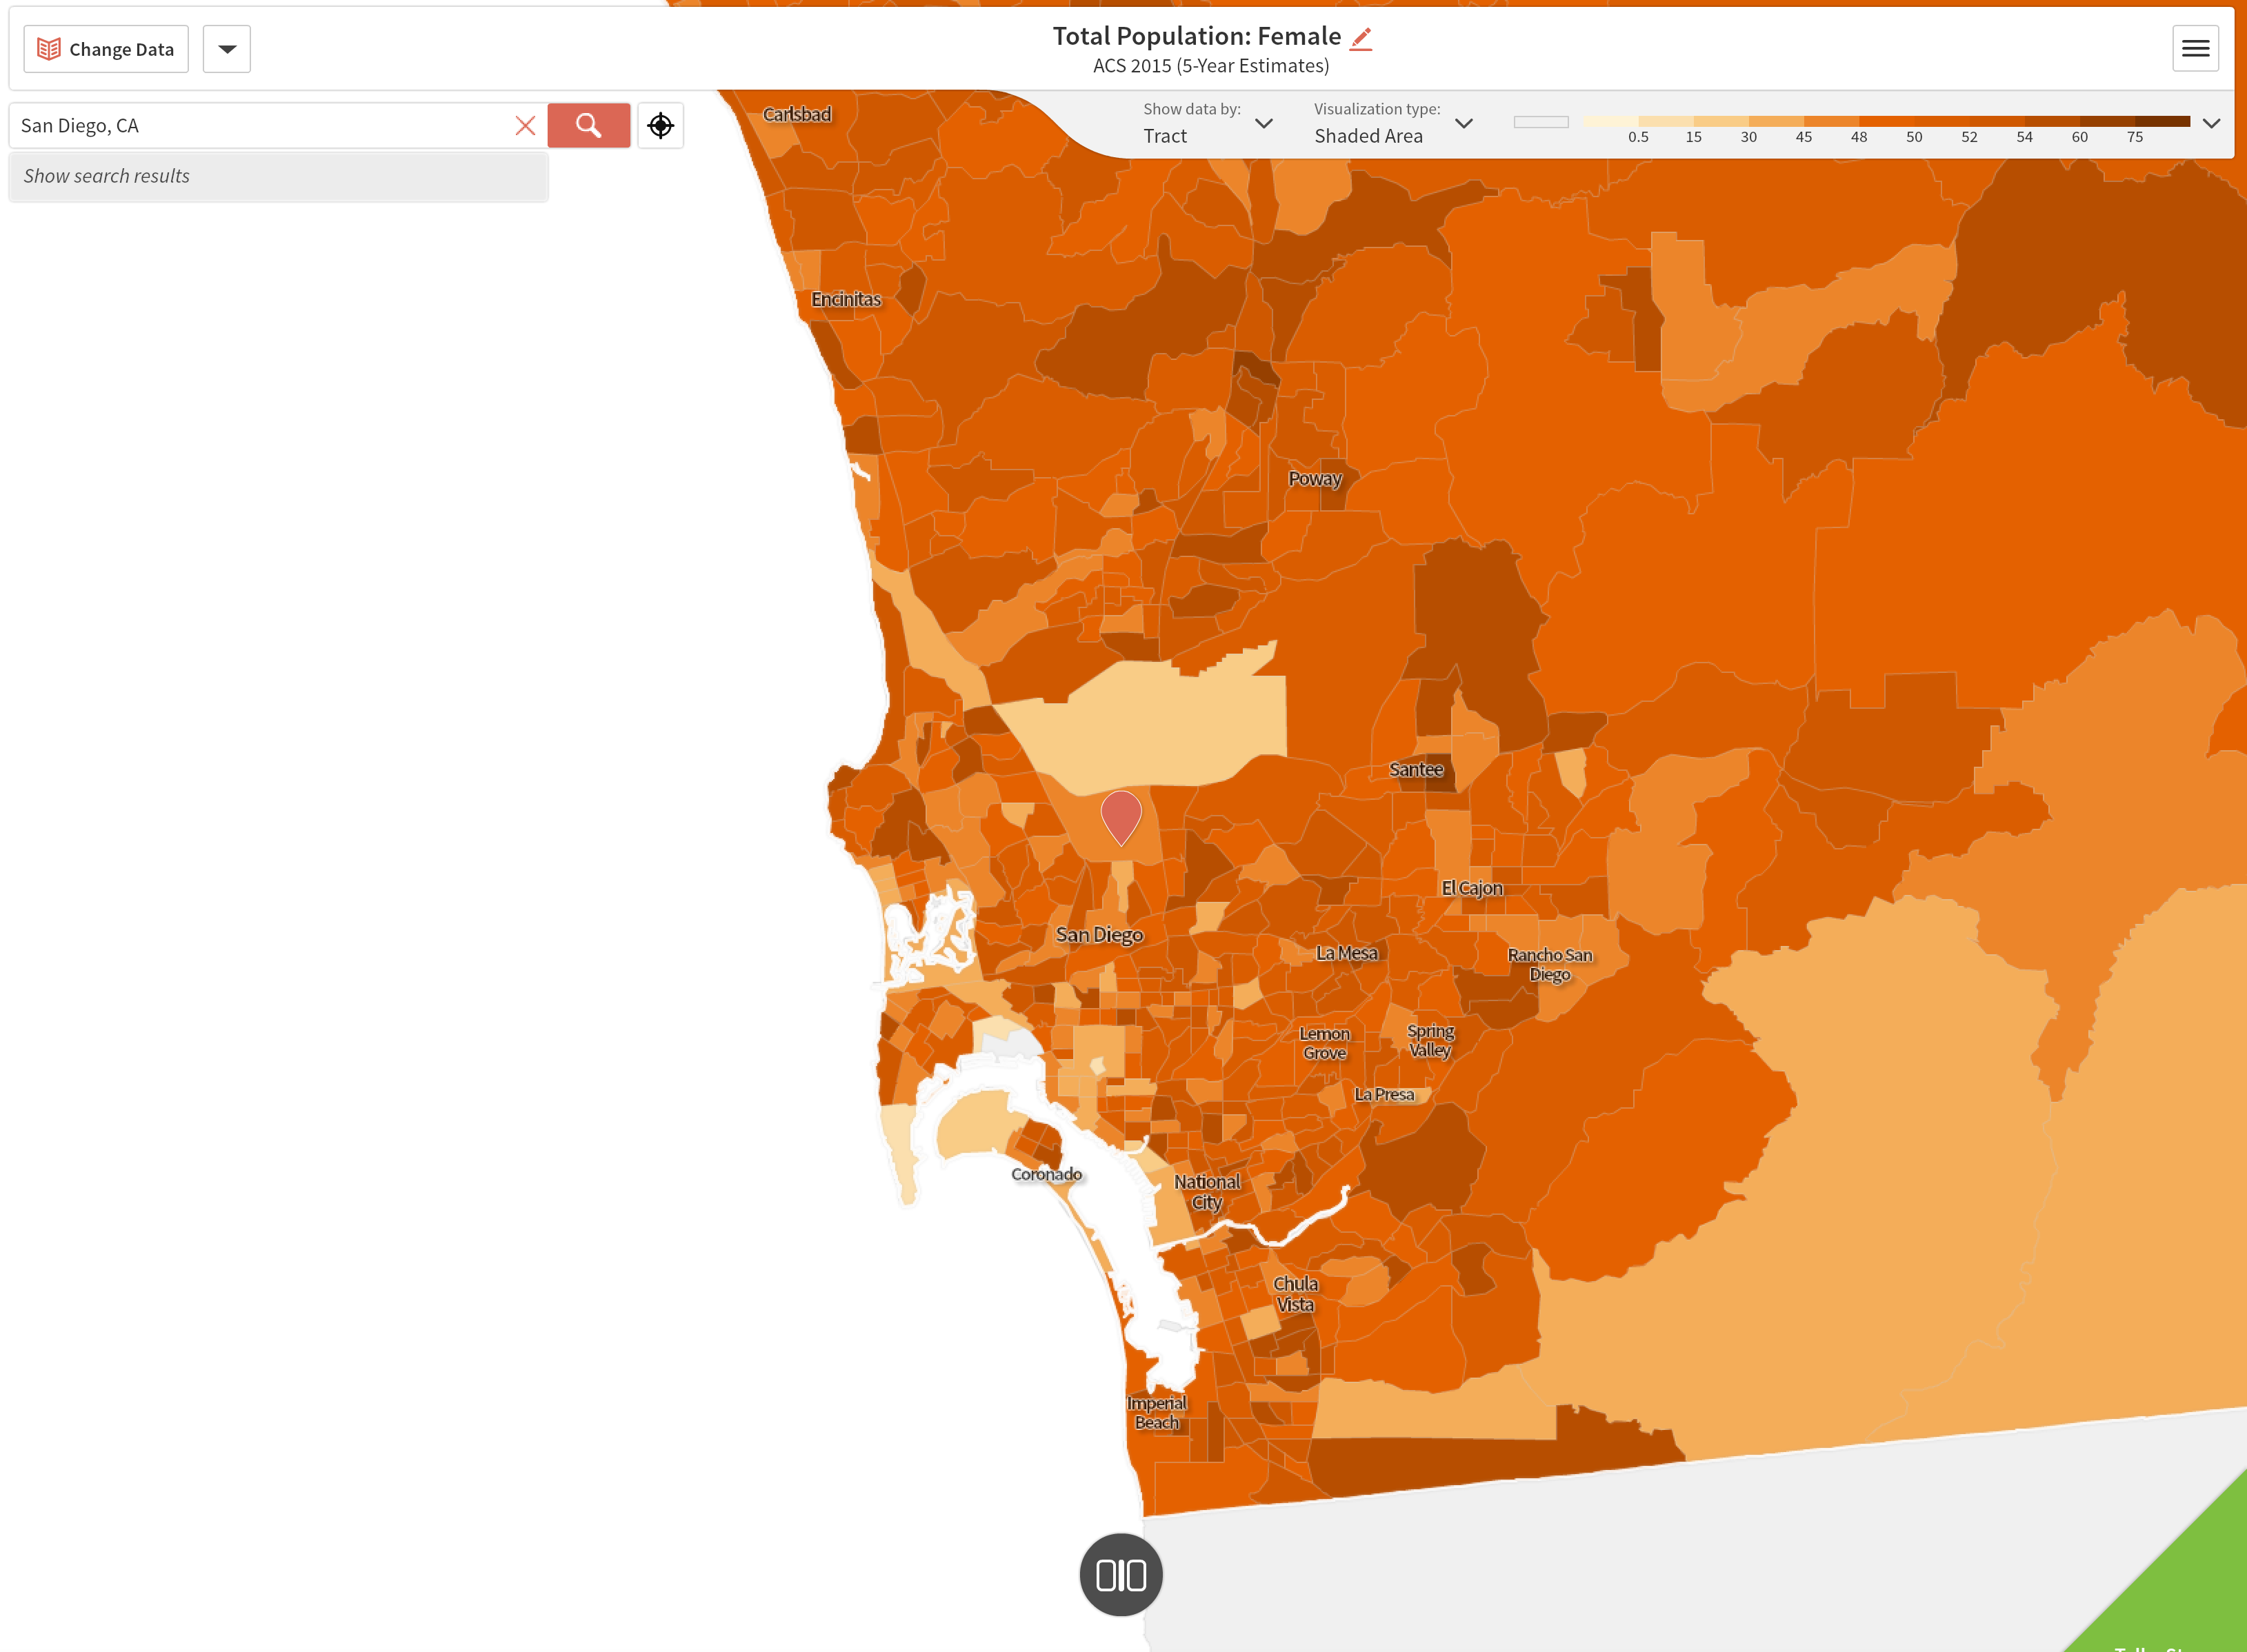
San Diego, California: Total Female Population 1970 Census 50.51%
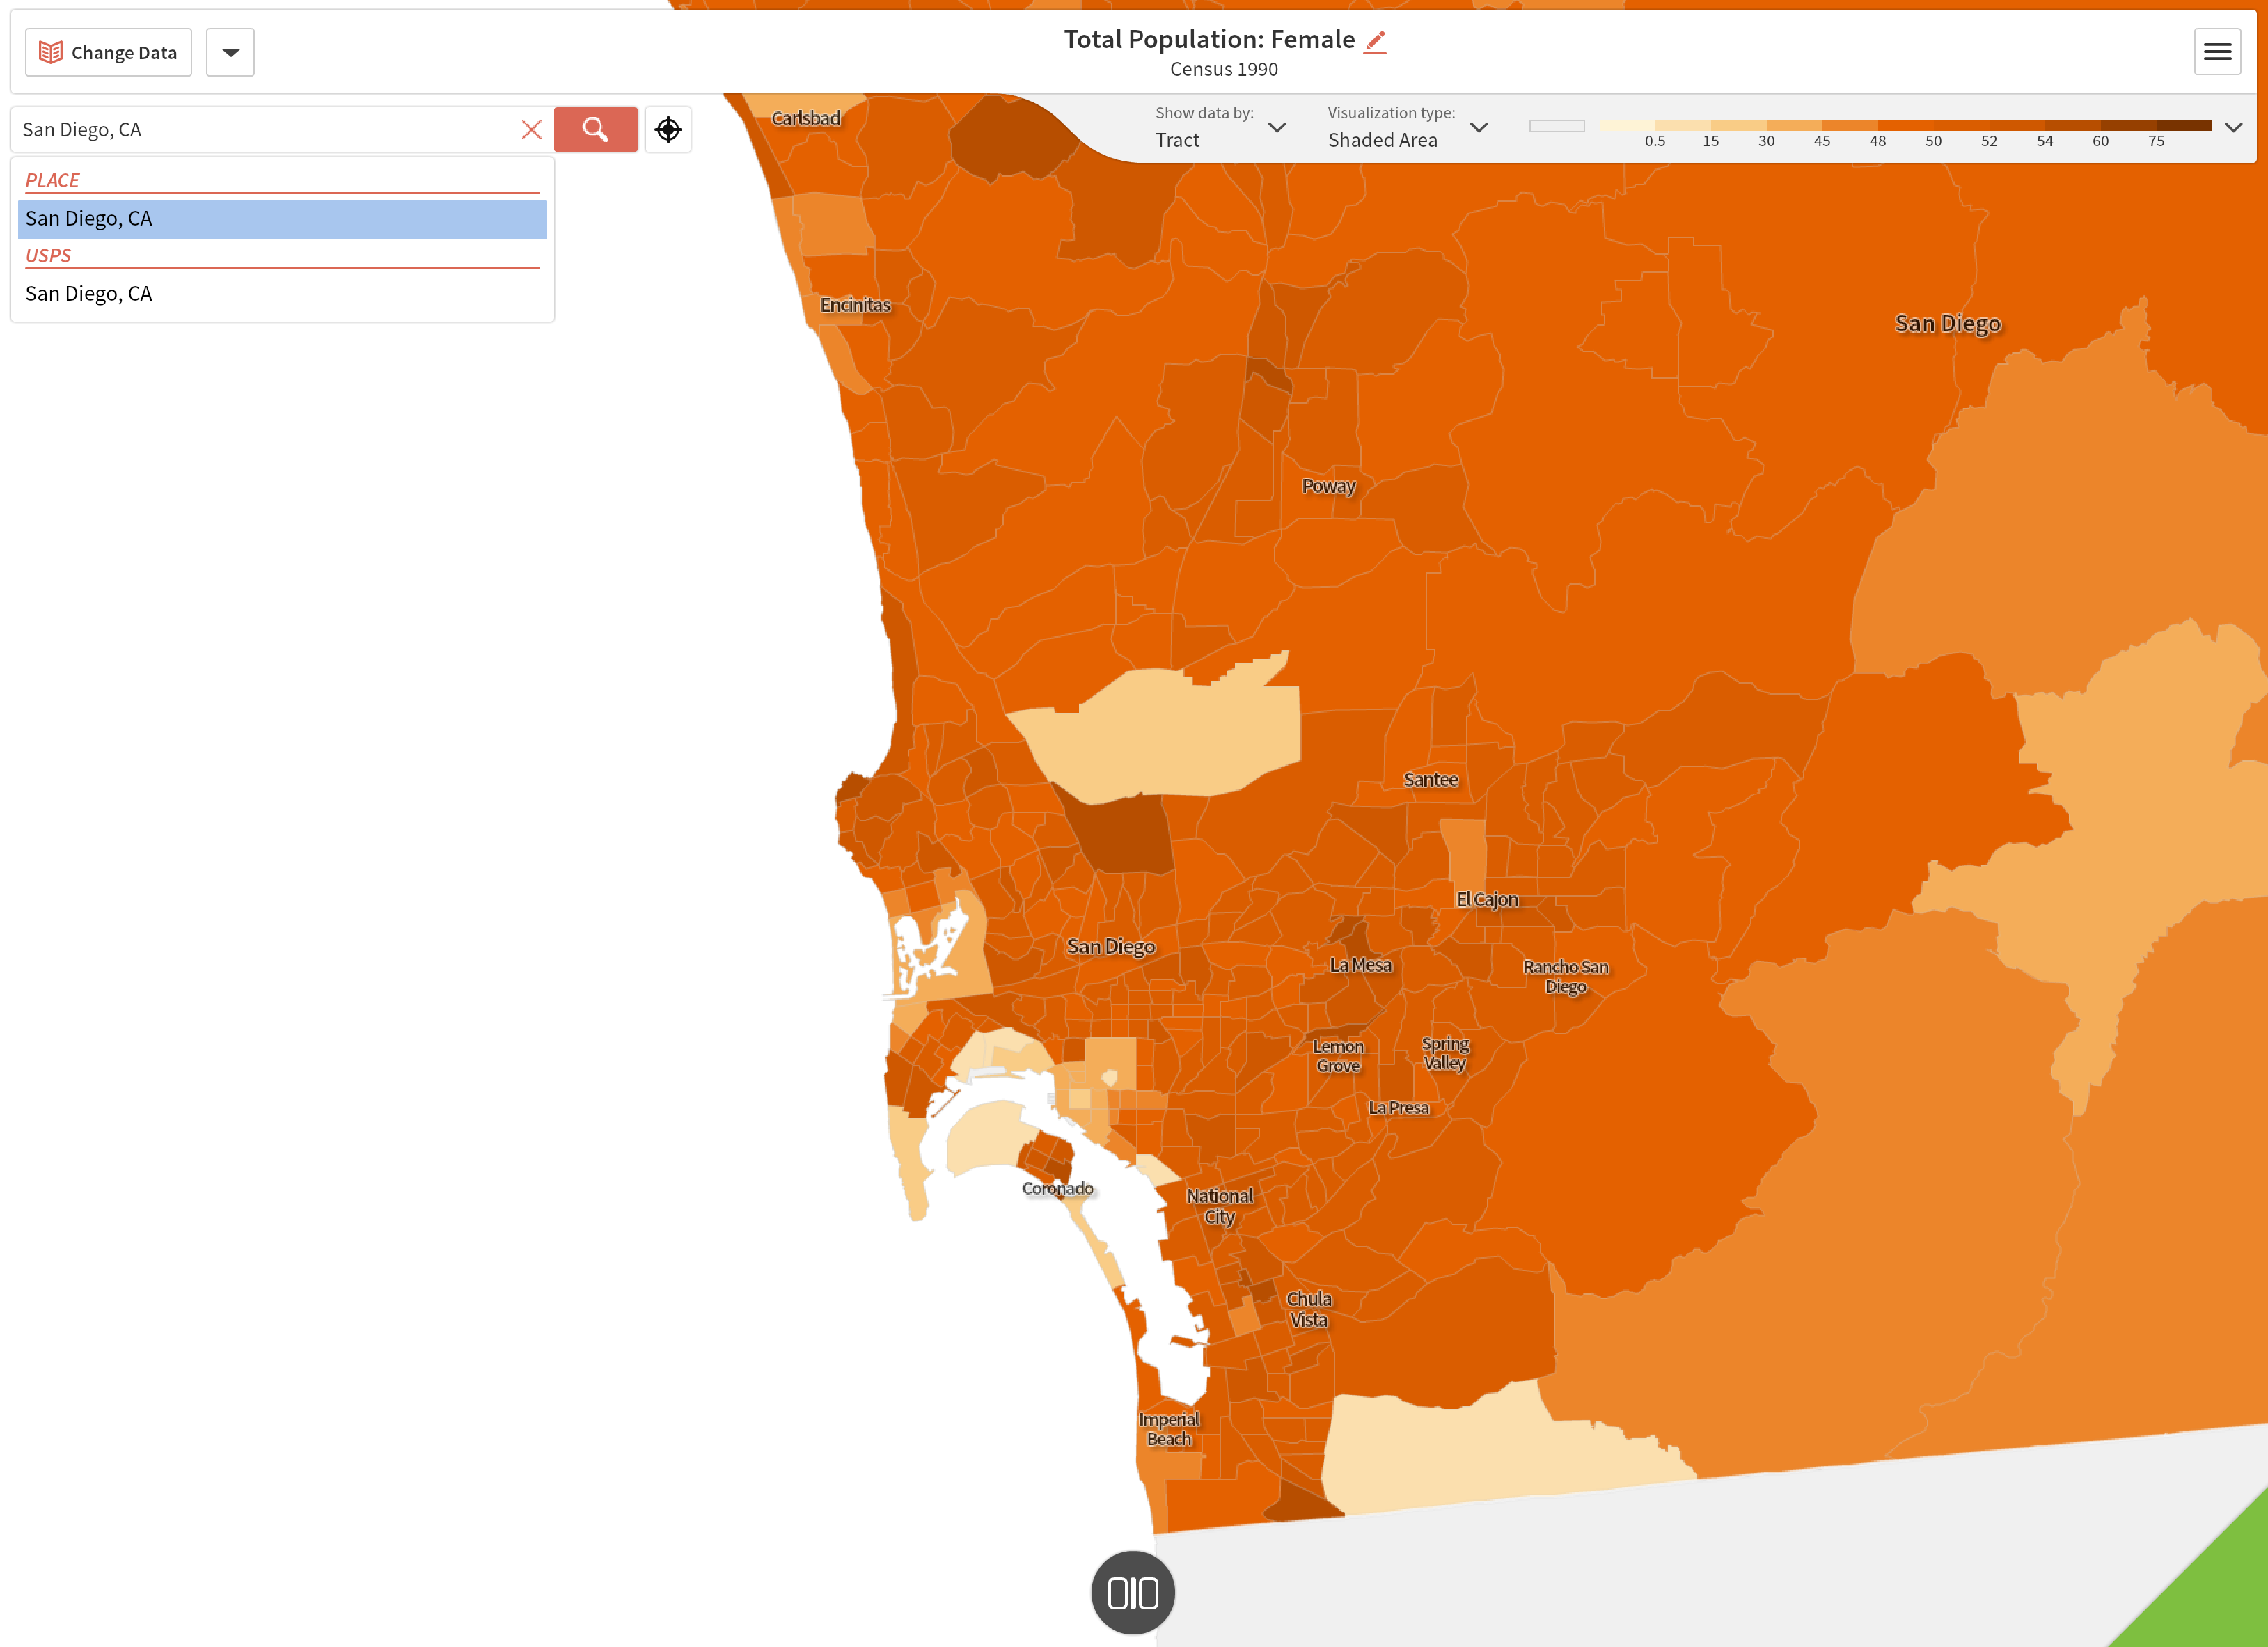
San Diego, California: Total Female Population 1990- Census 49.13%
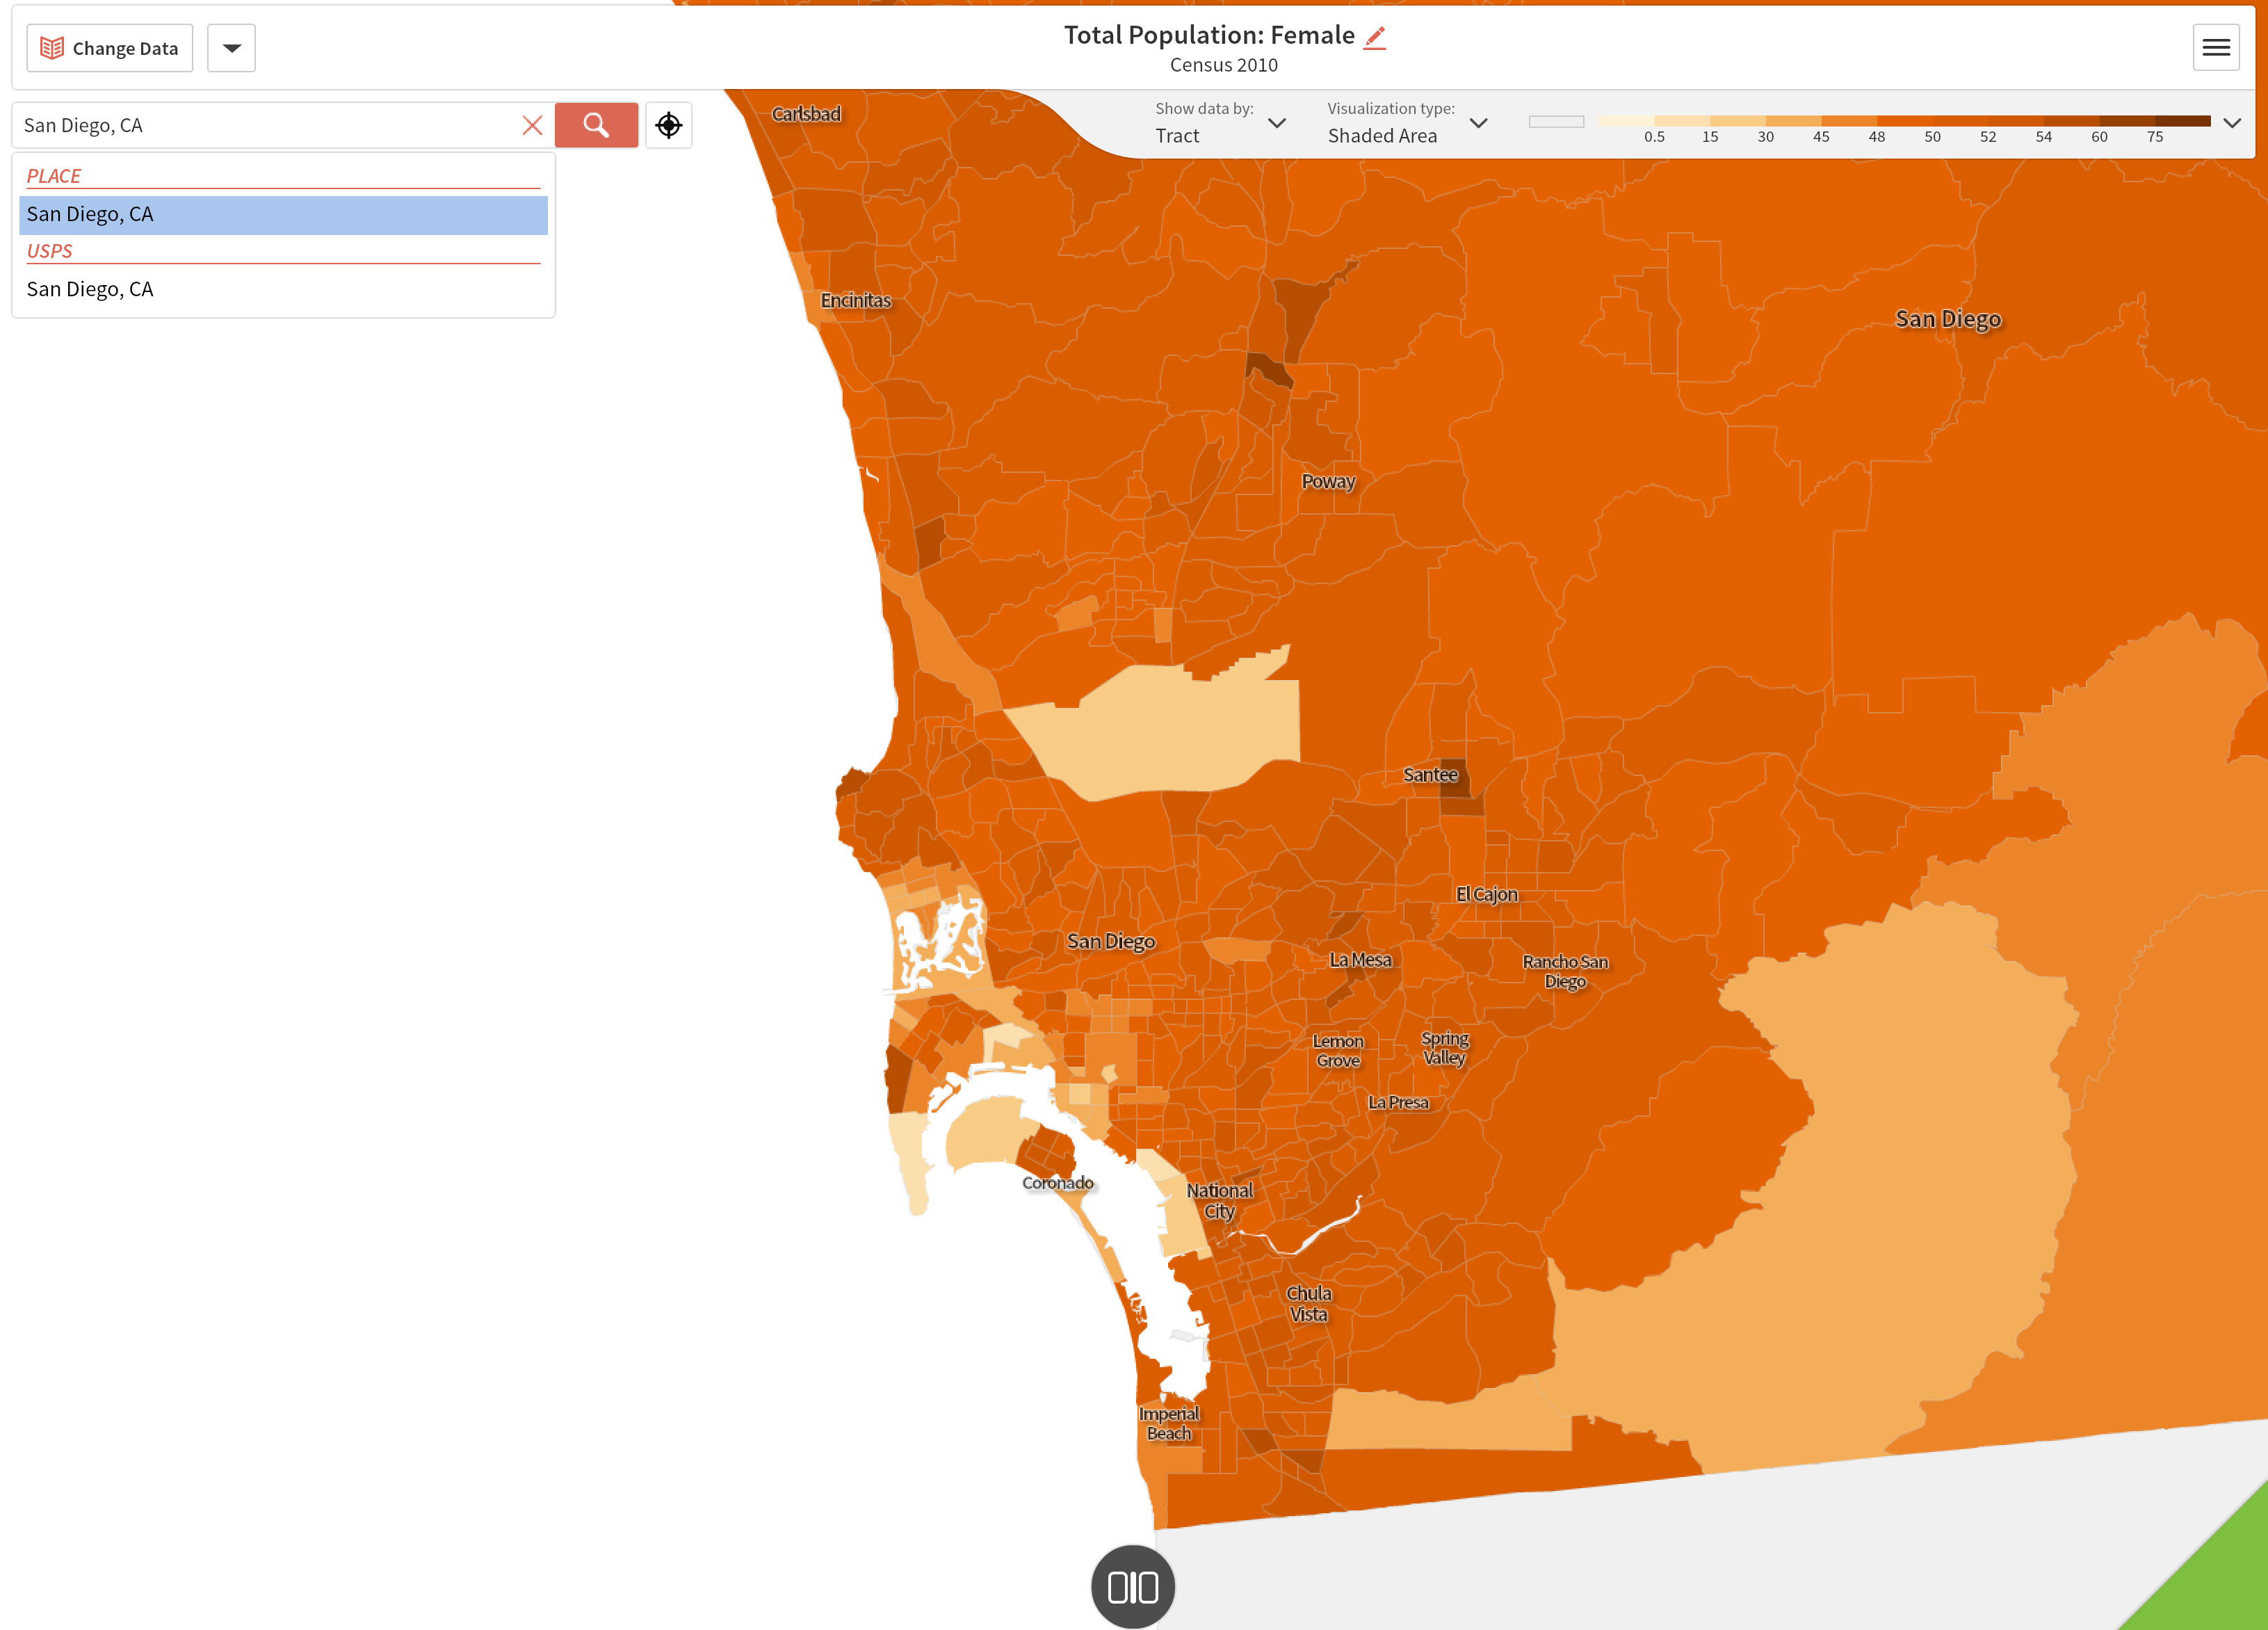
San Diego, California2010 49.71%
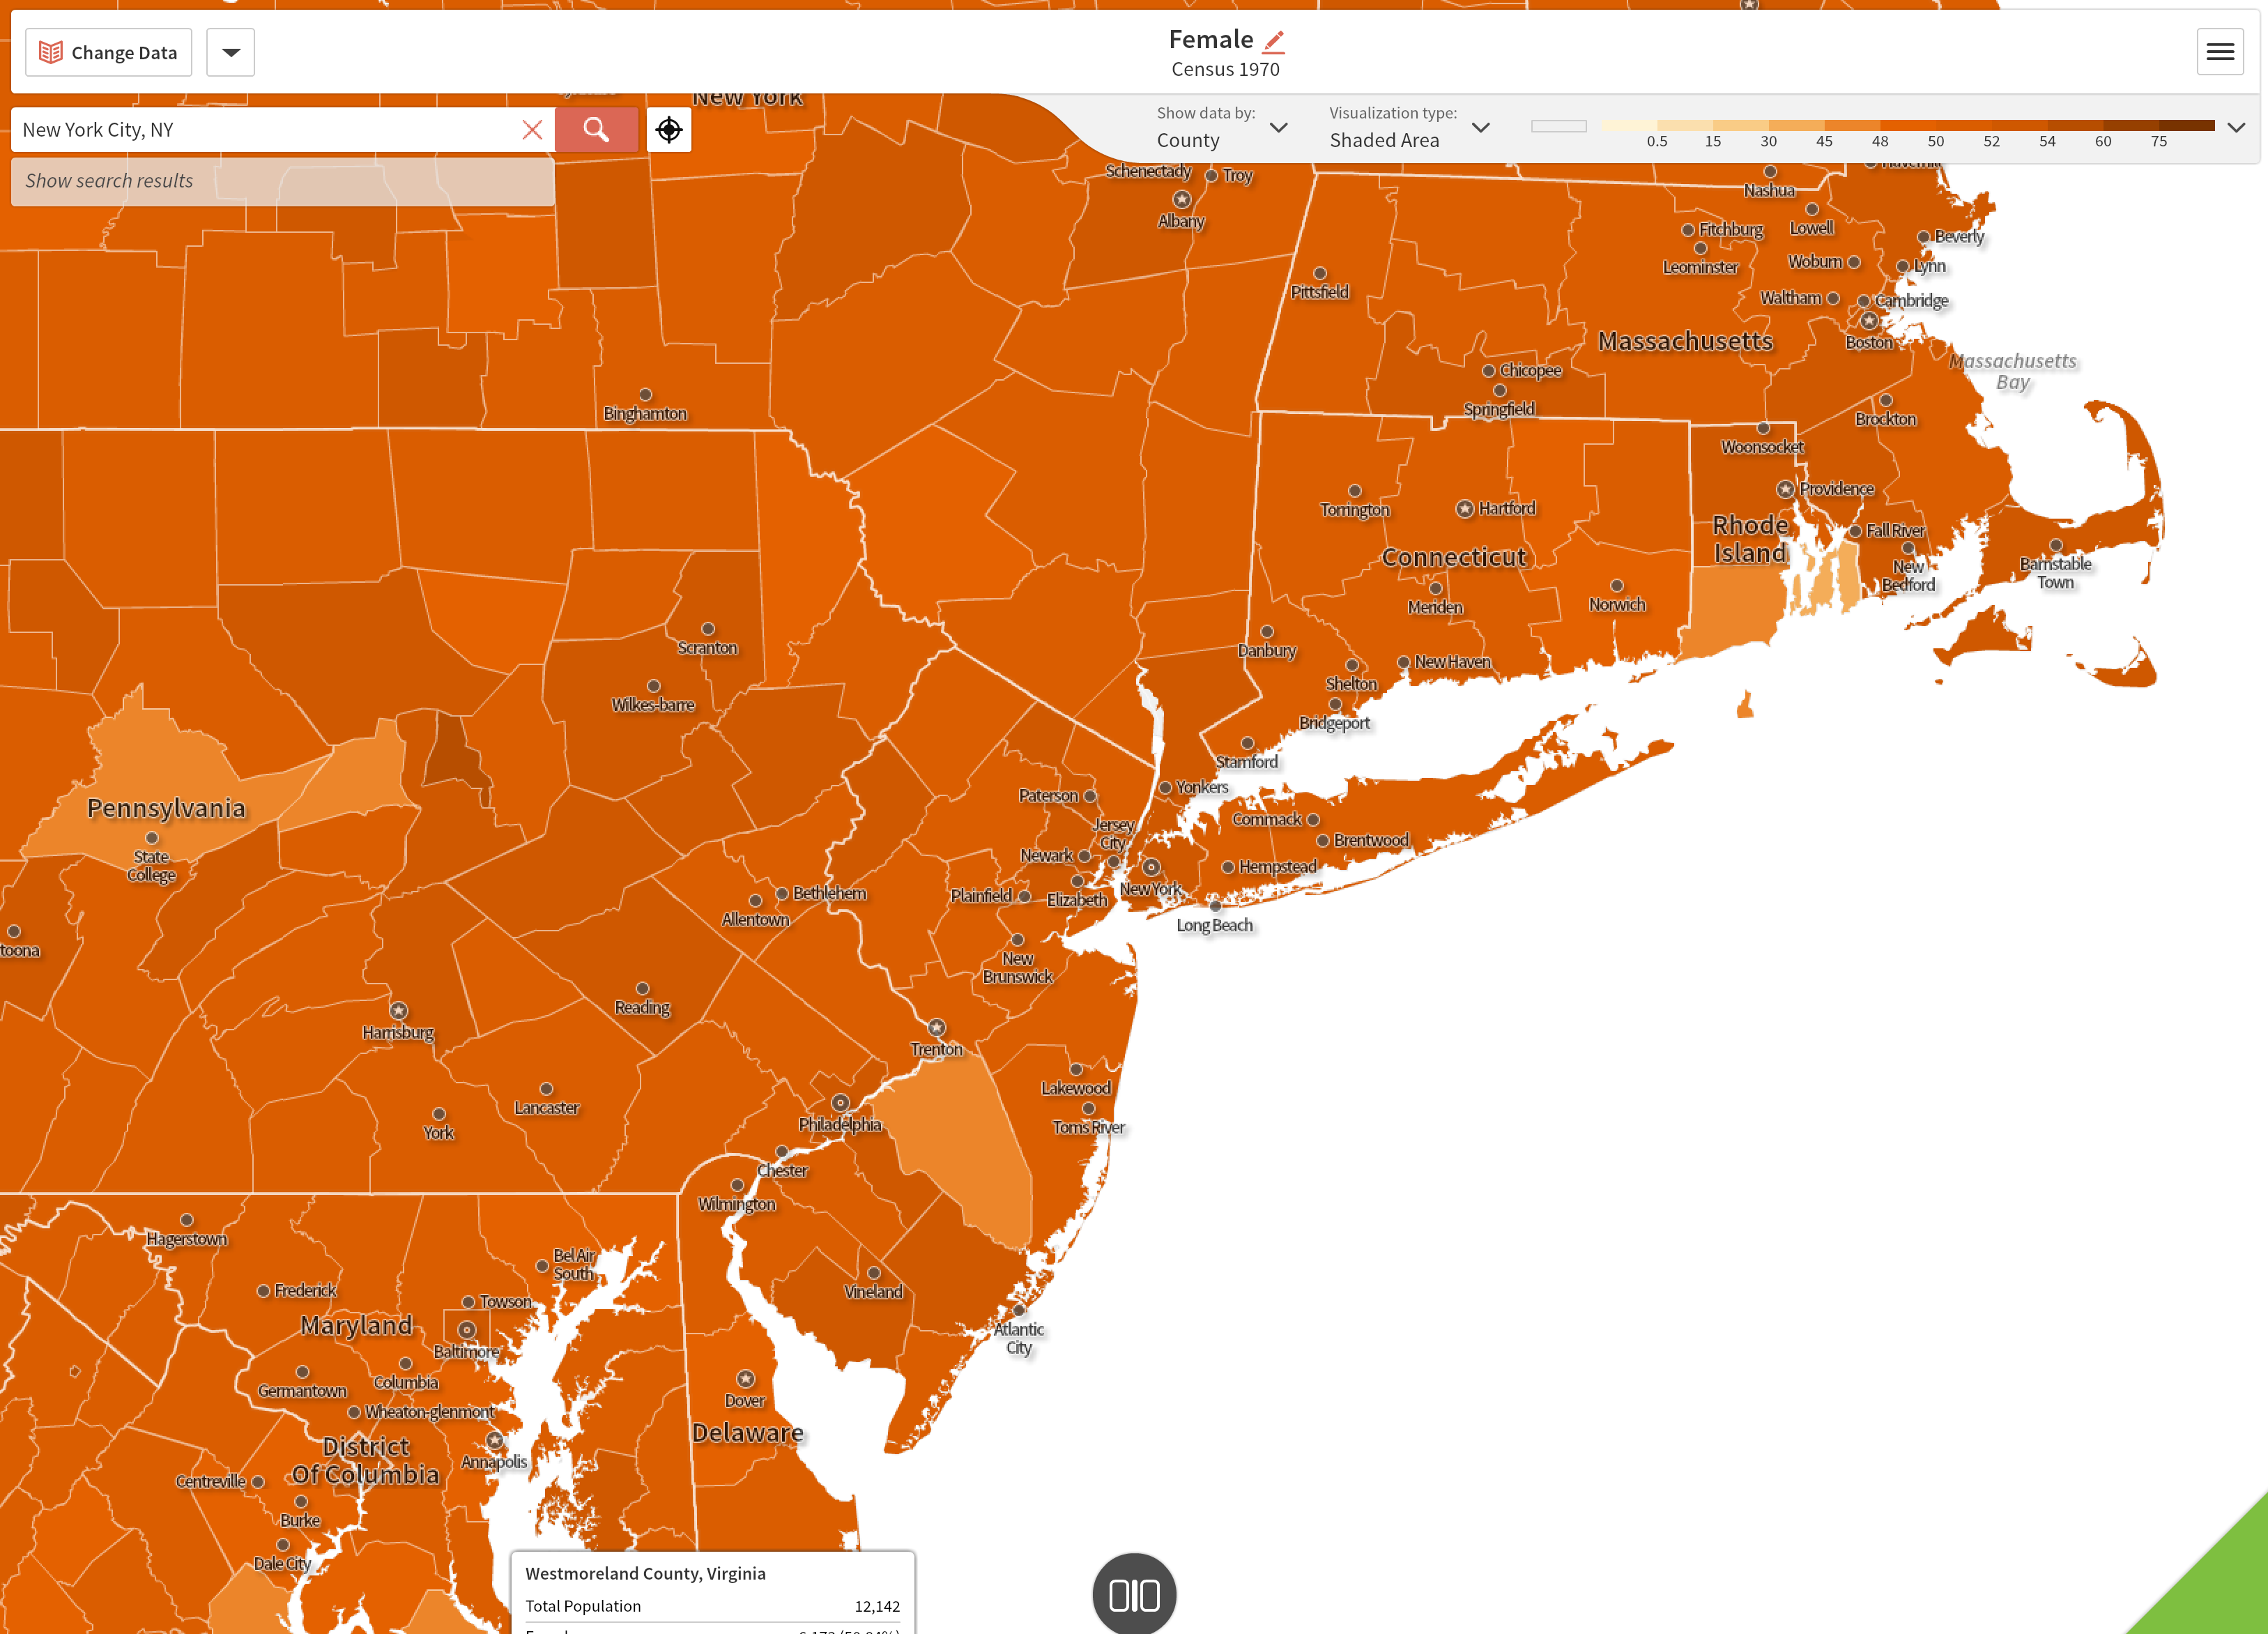
New York County, NY: Total Female Population 1970 Census 53.41%
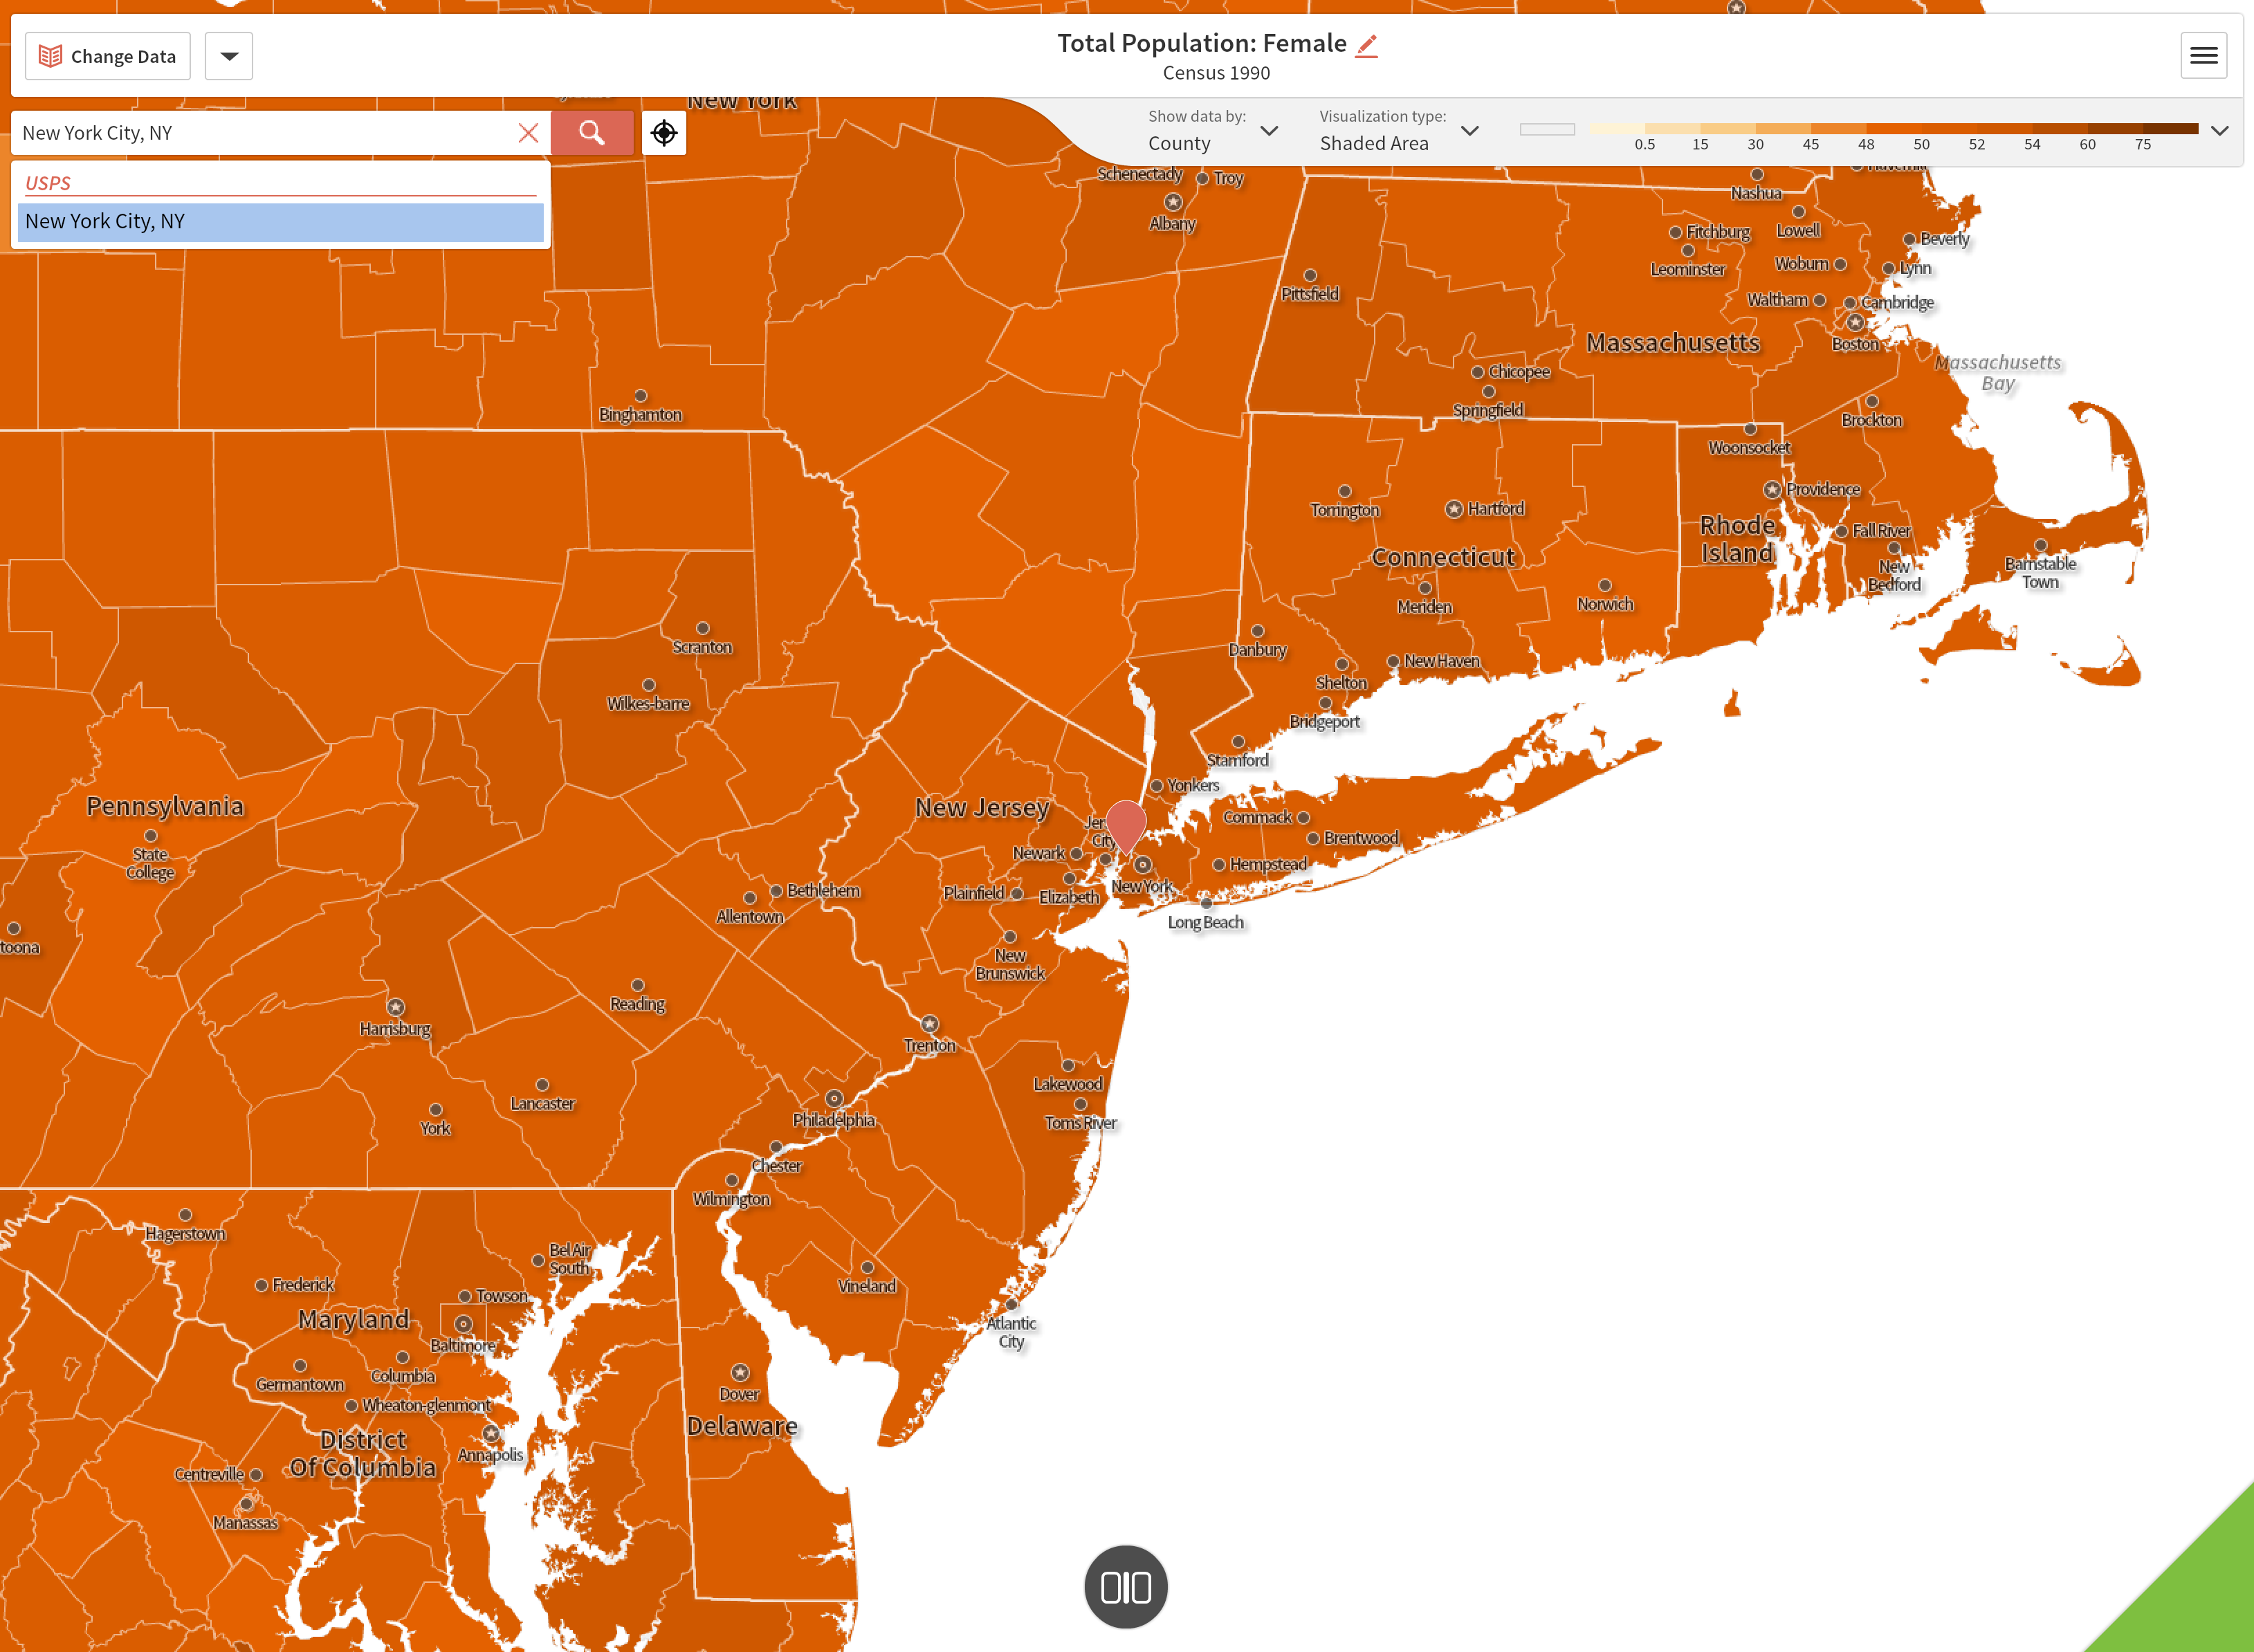
New York County, NY: Total Female Population 1990 Census 49.71%
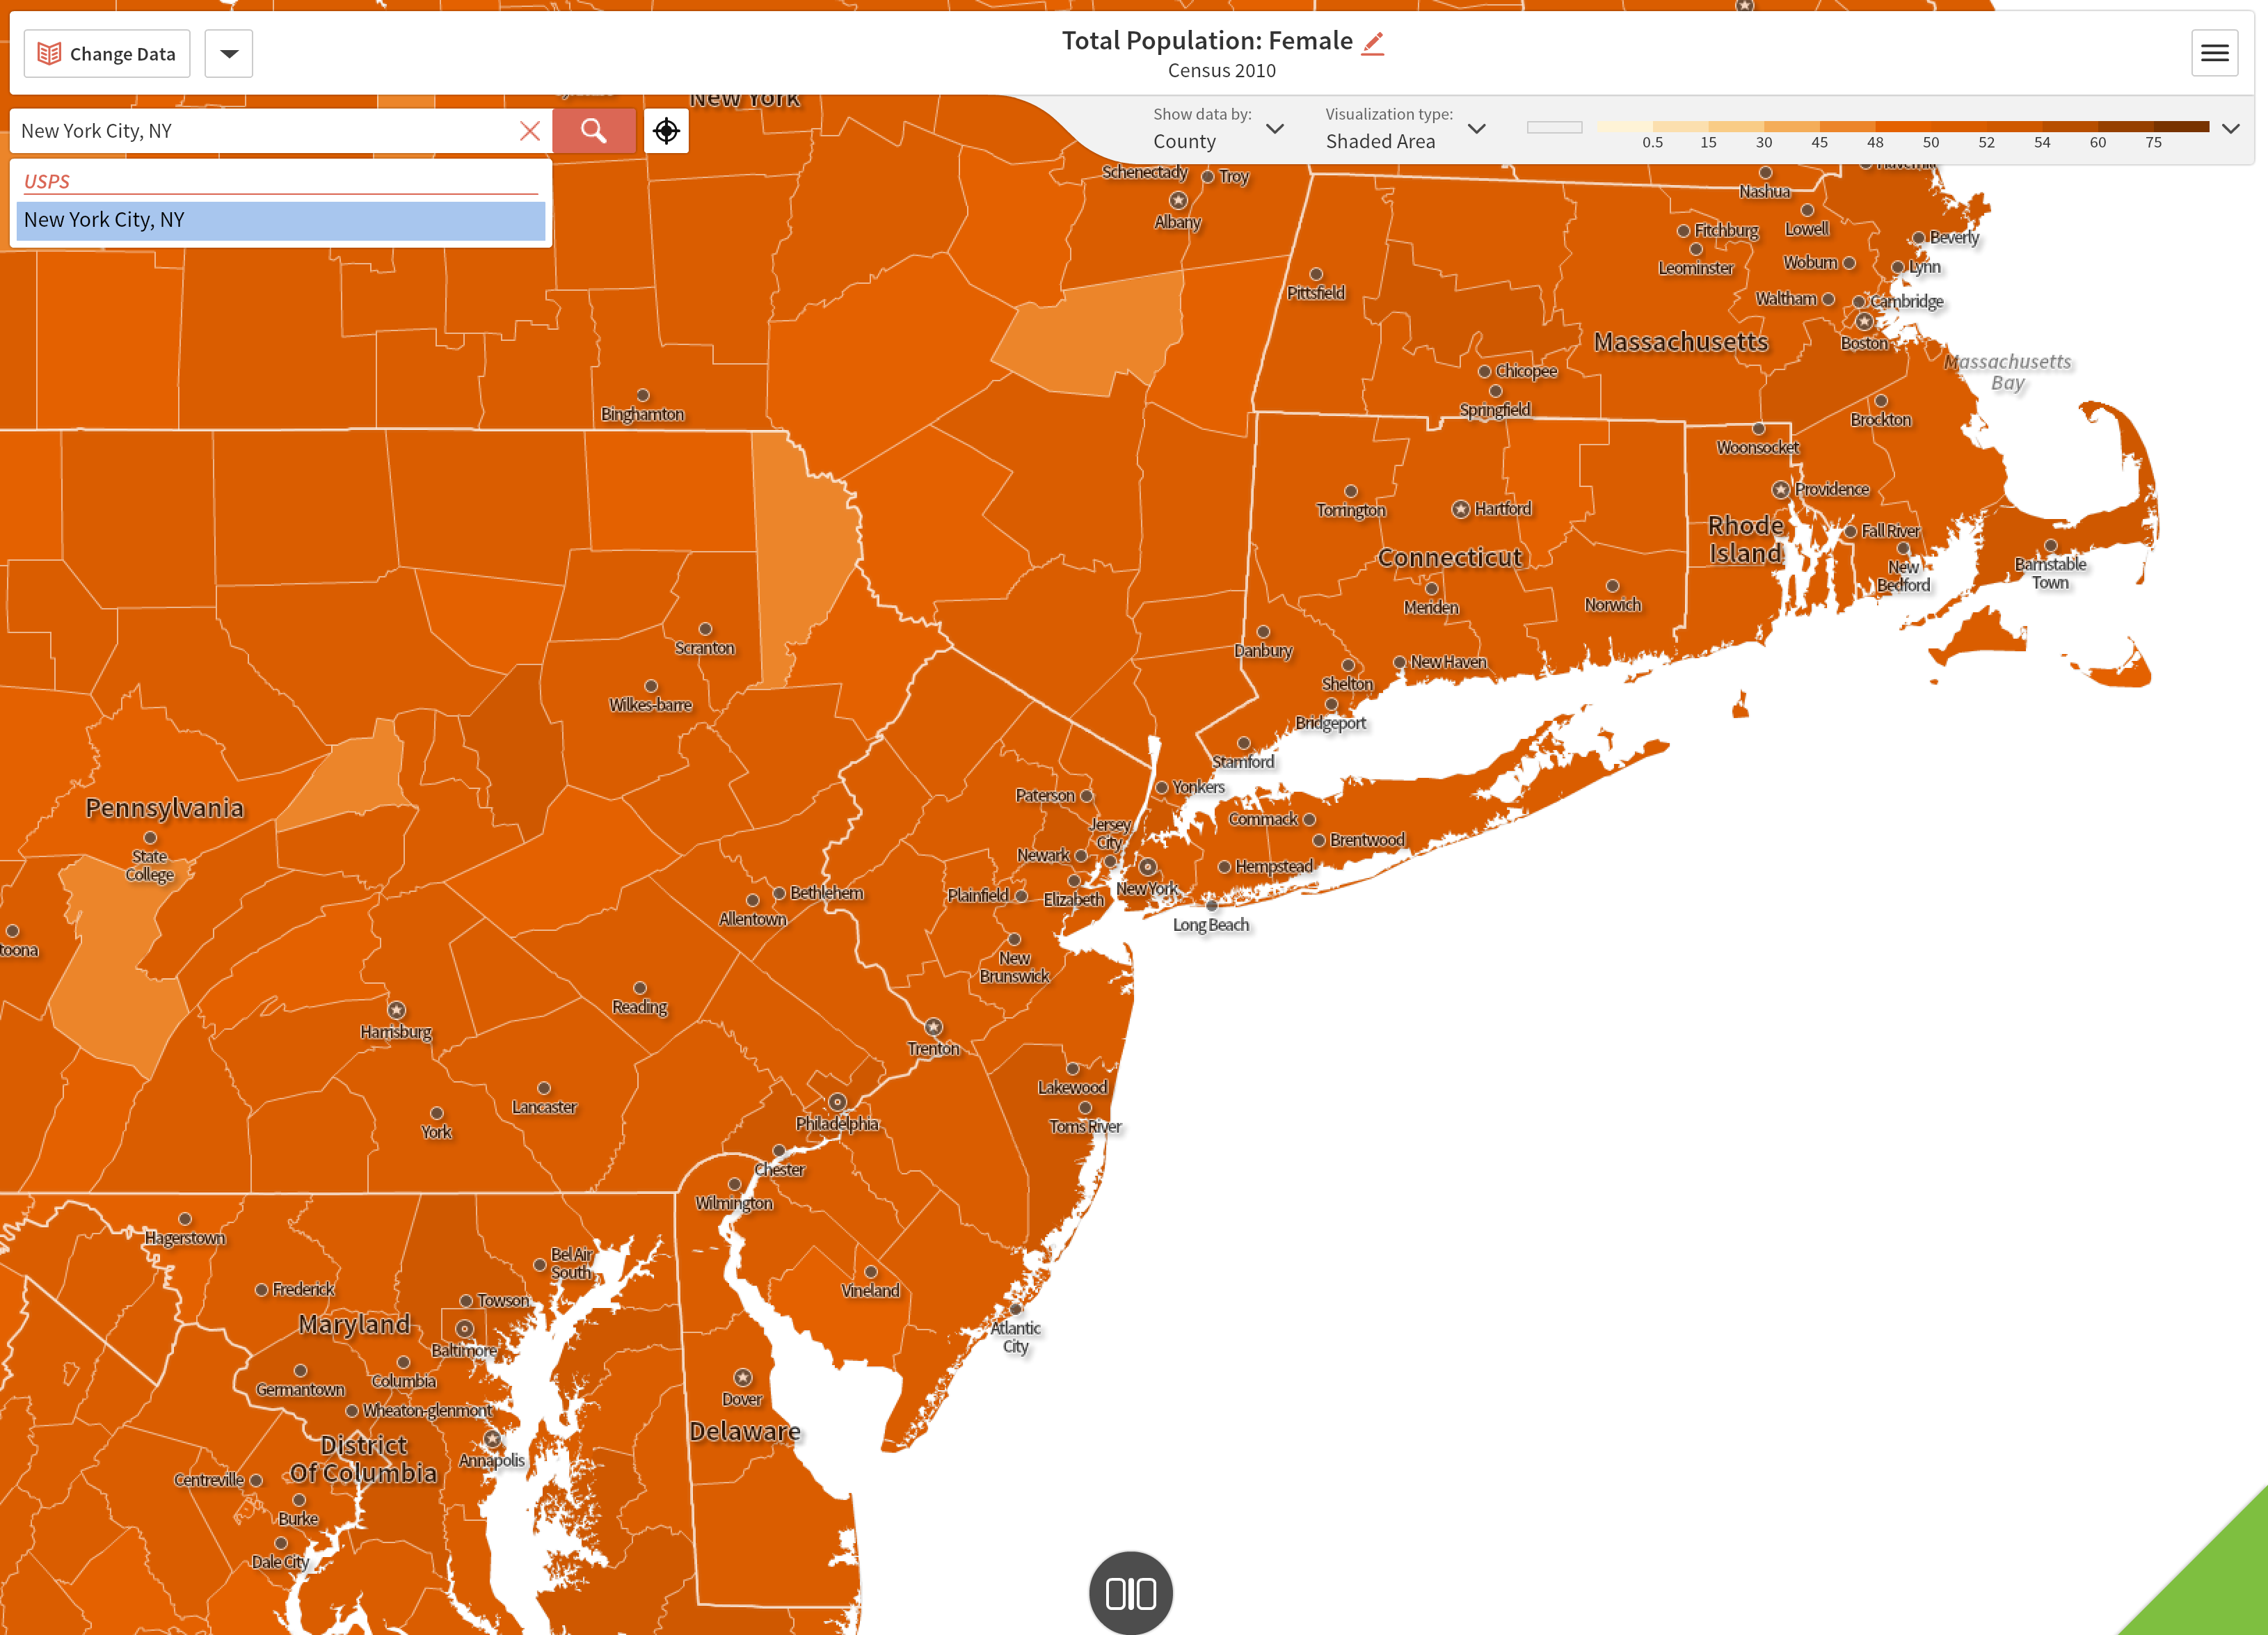
 New York County, NY: Total Female Population 2010 Census 53.508%
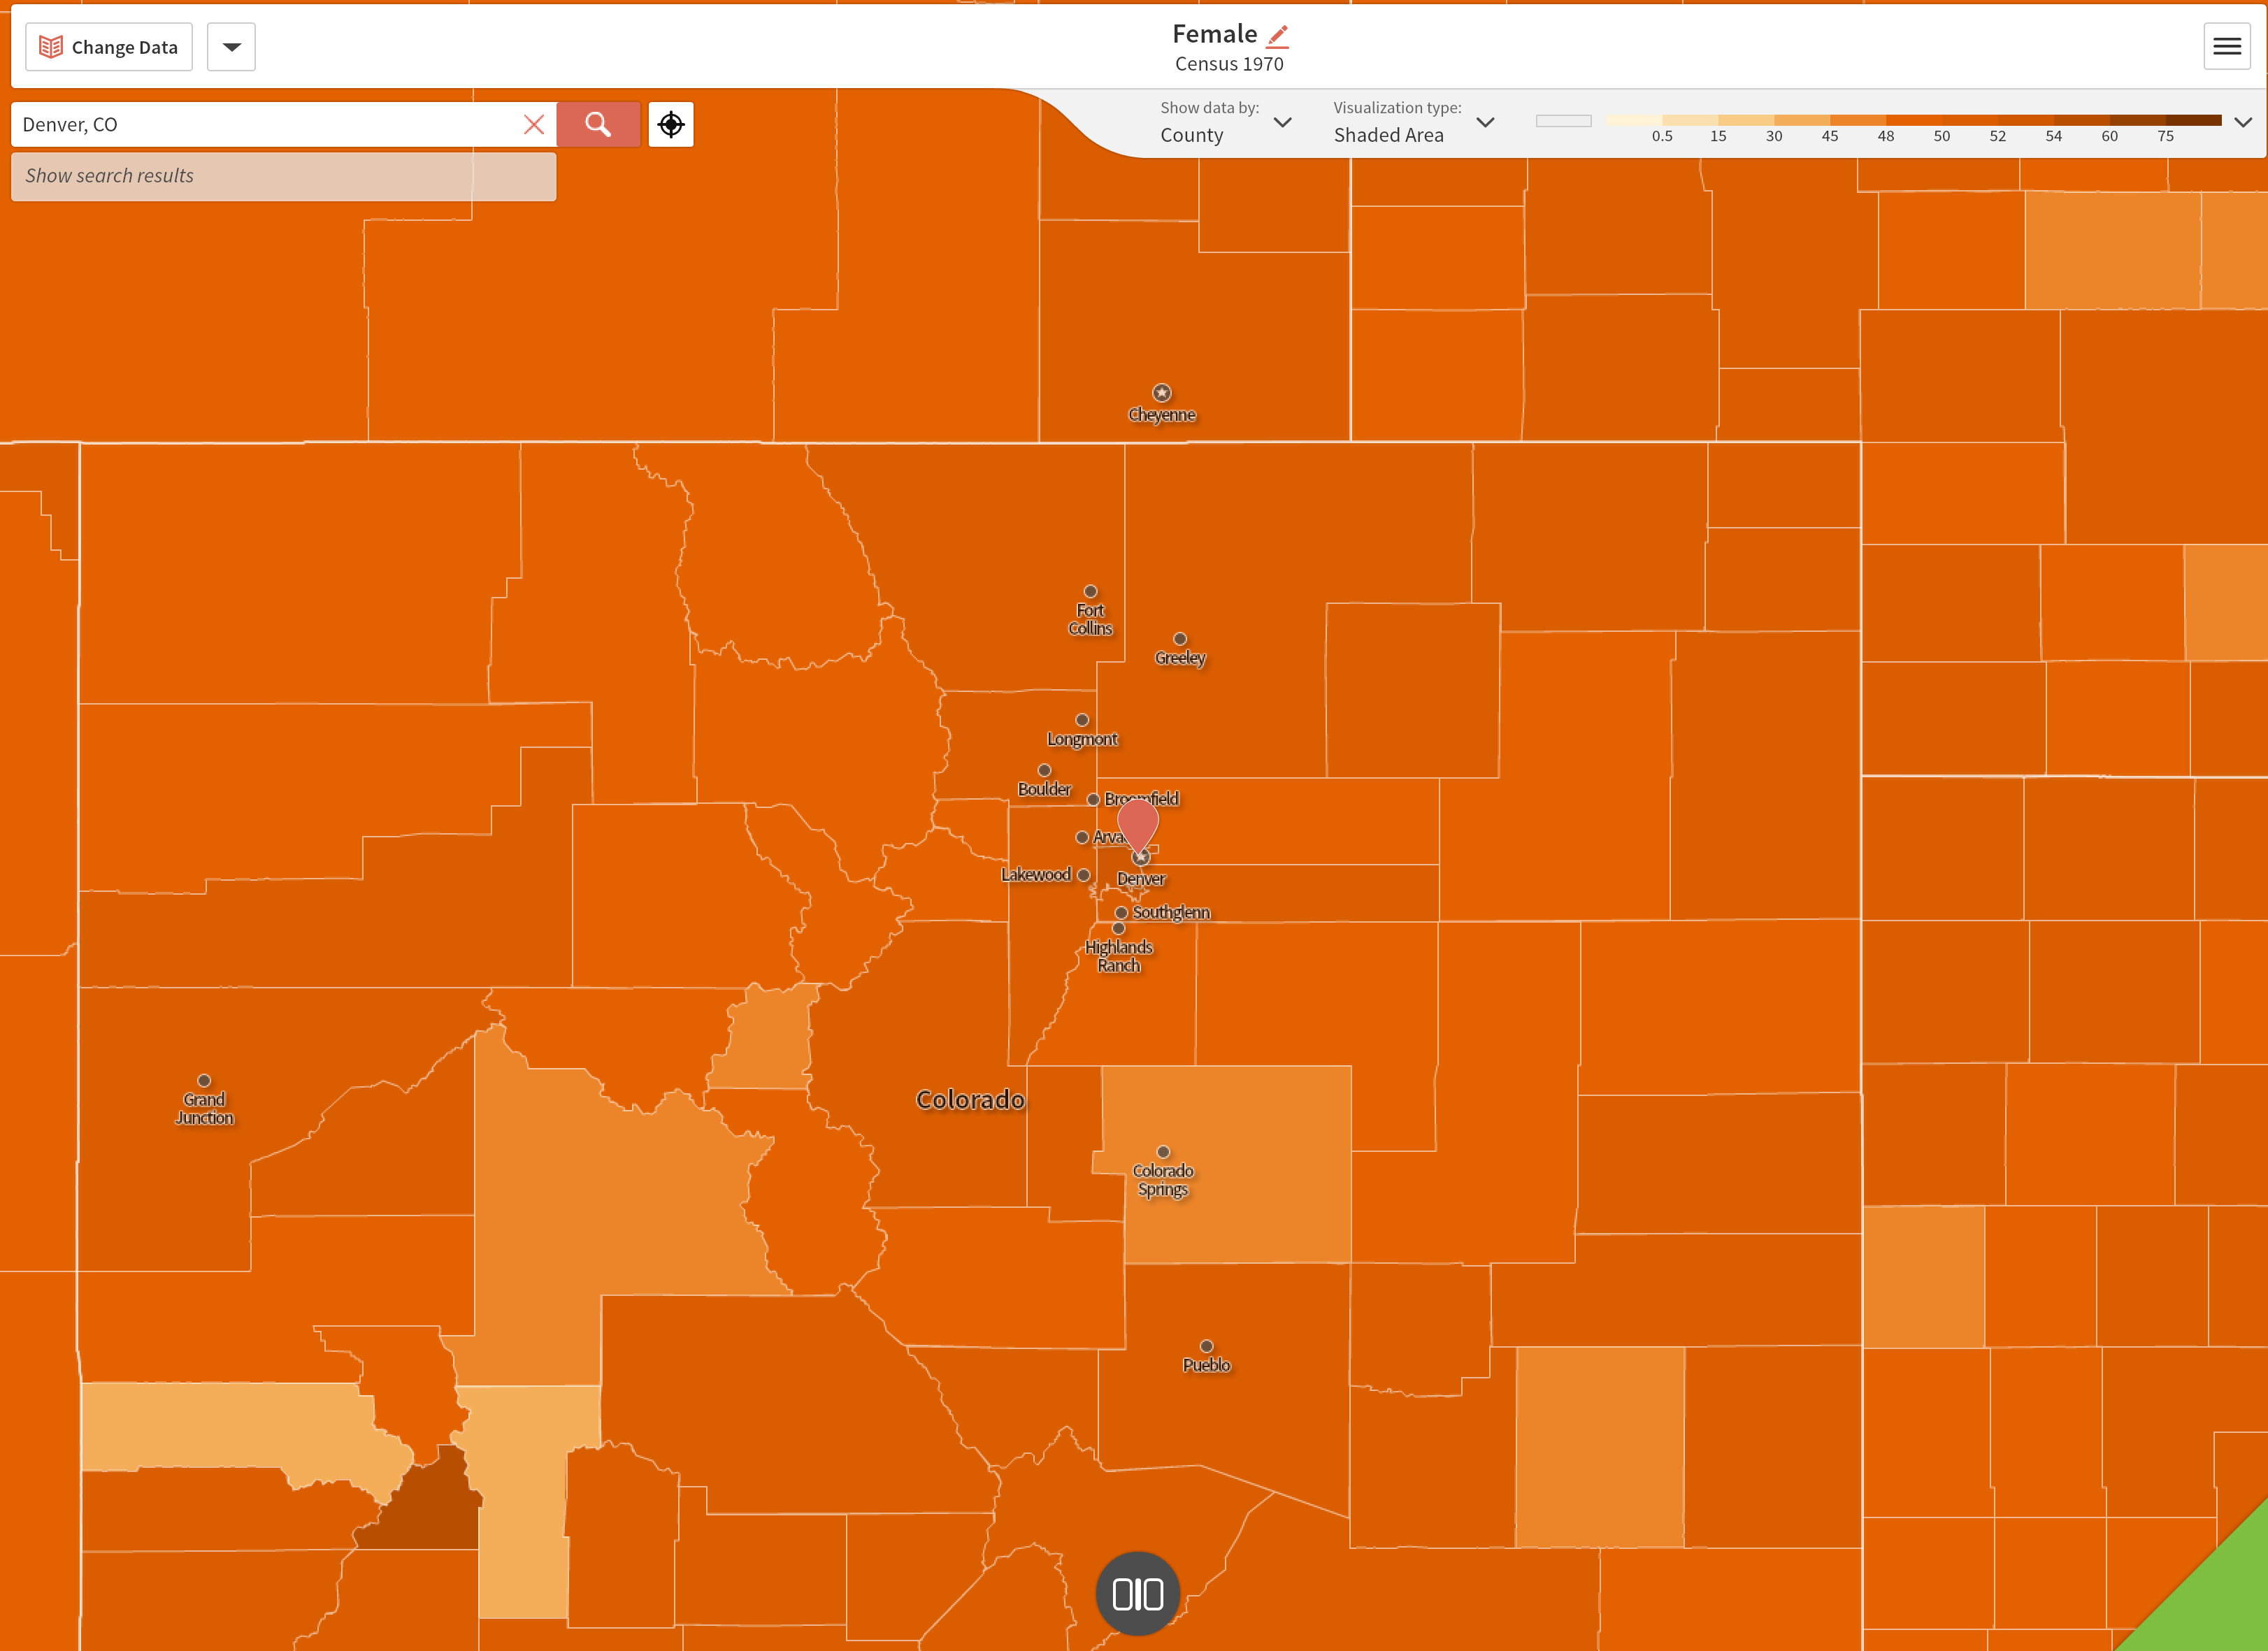
Denver, CO: Total Female Population 1970 Census 52.67%
Denver, CO: Total Female Population 1990 Census 51.345%
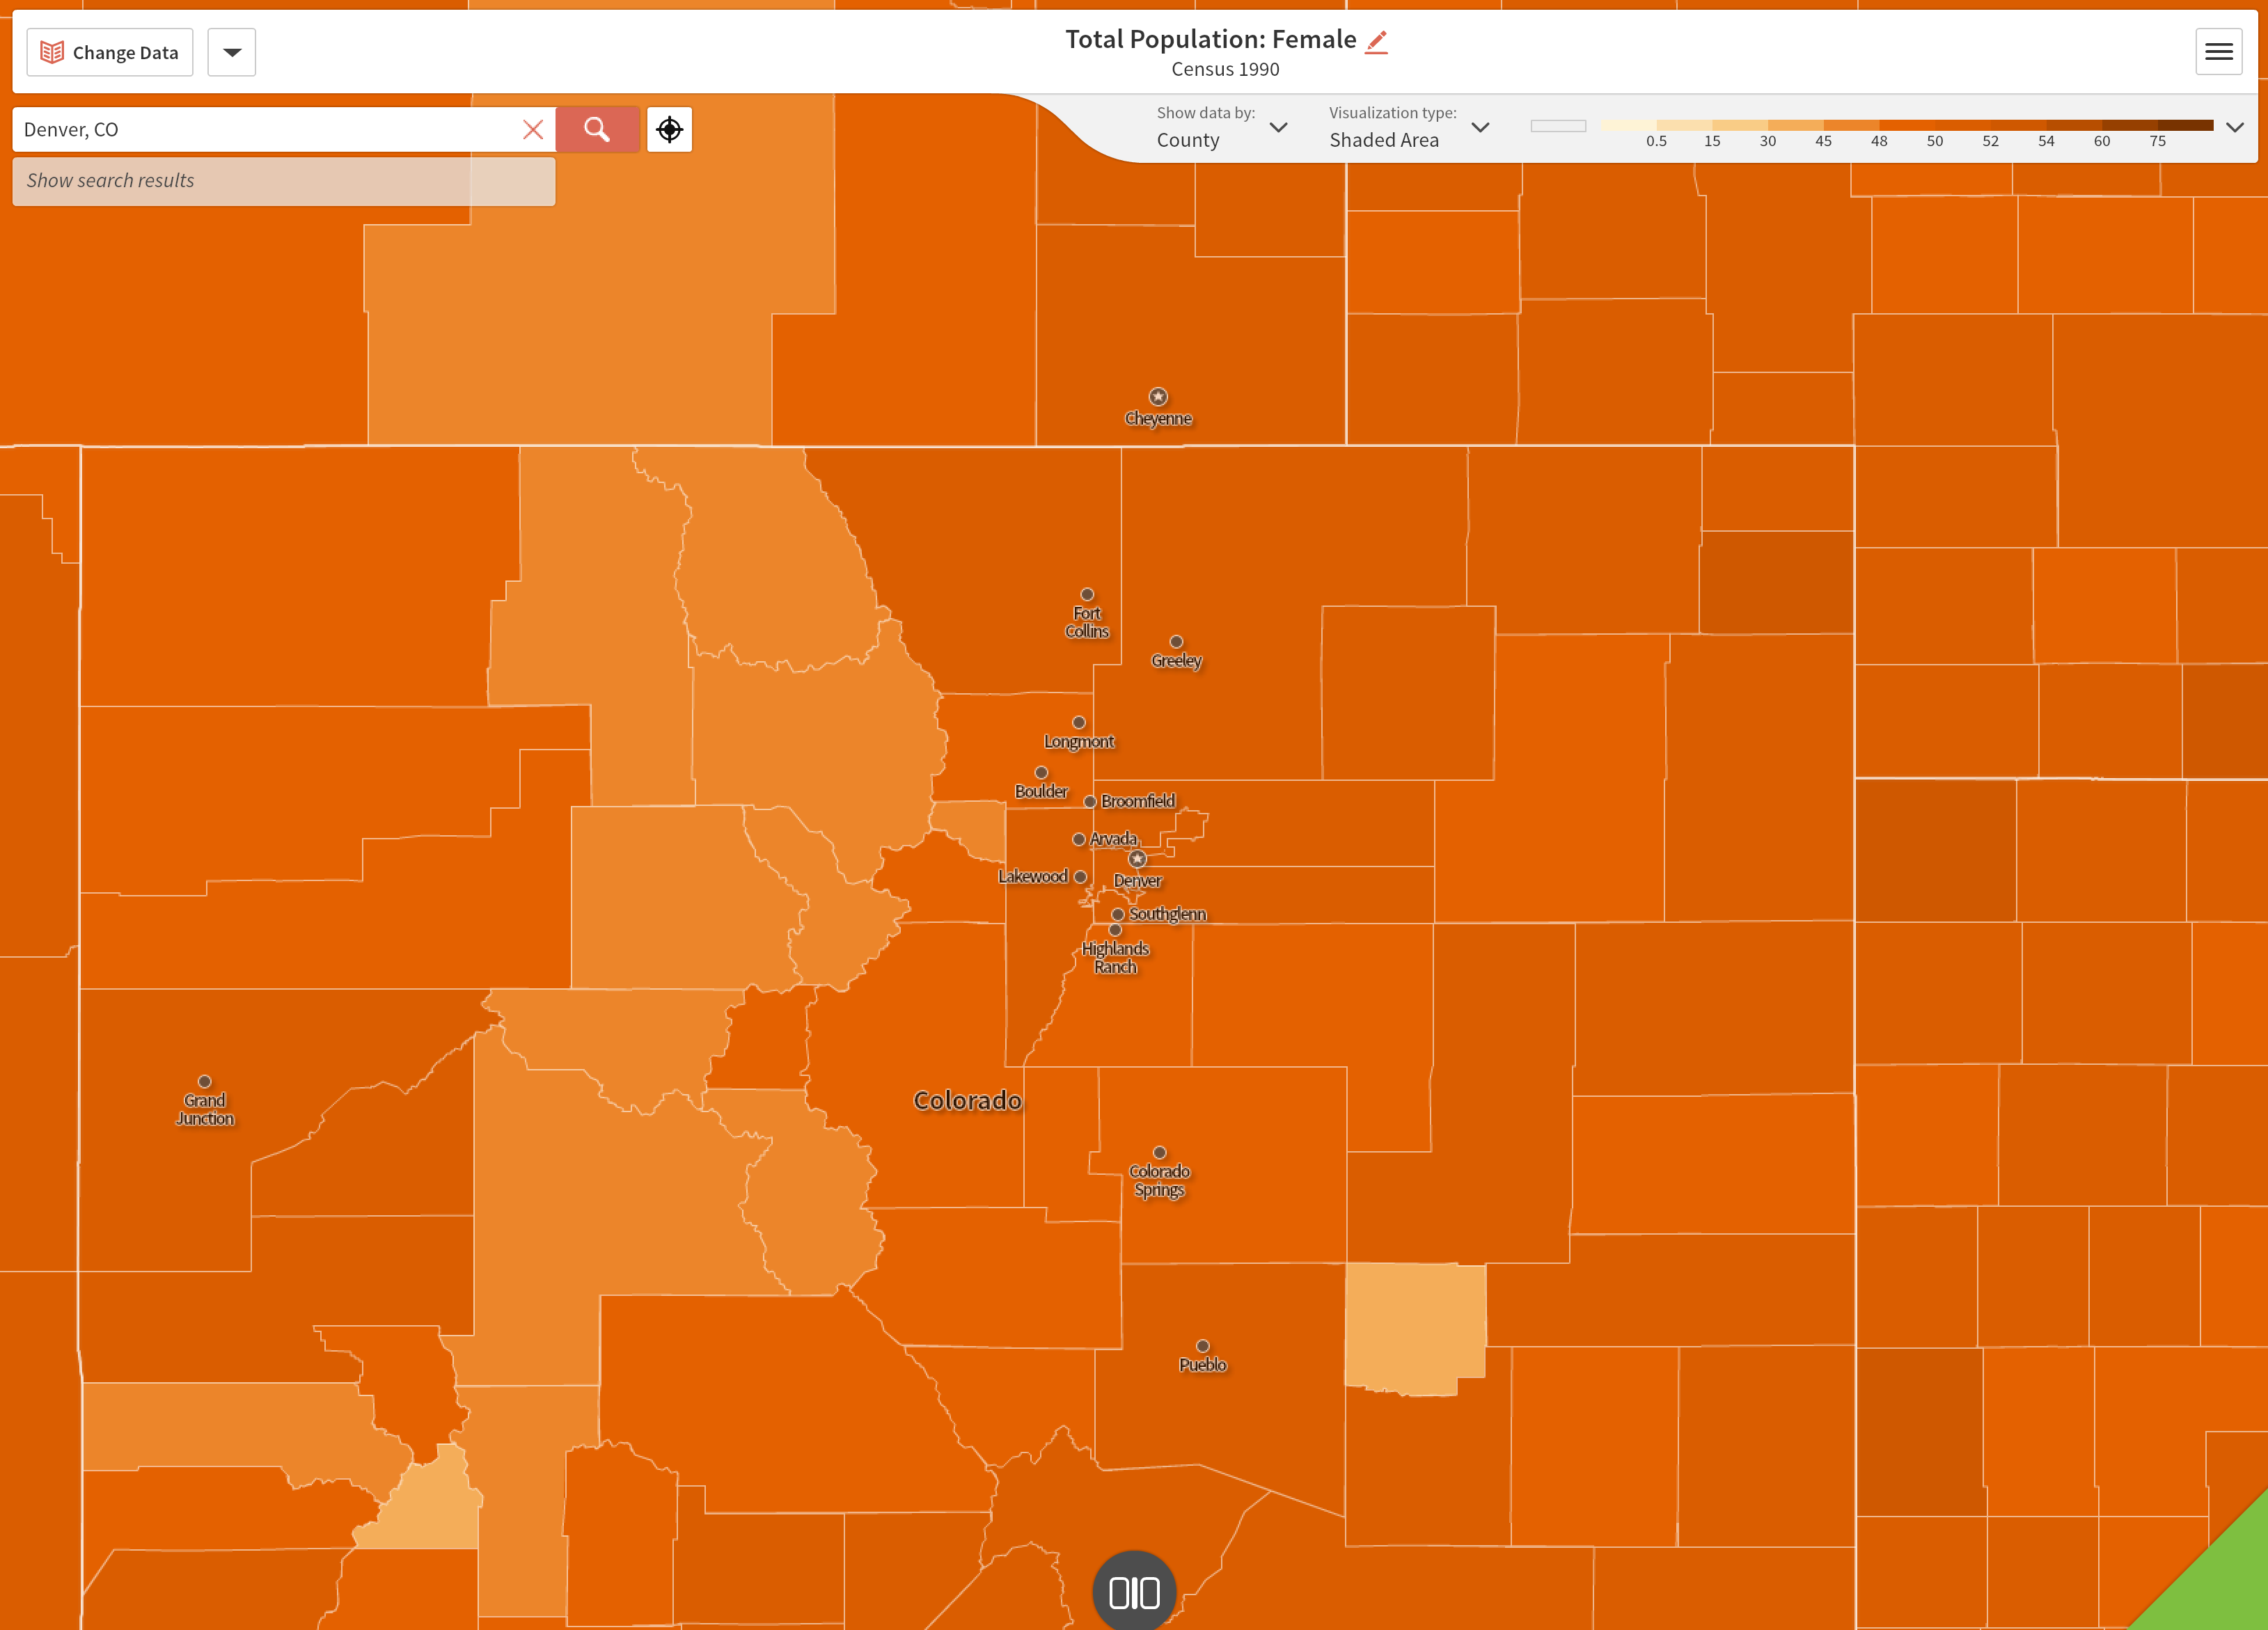
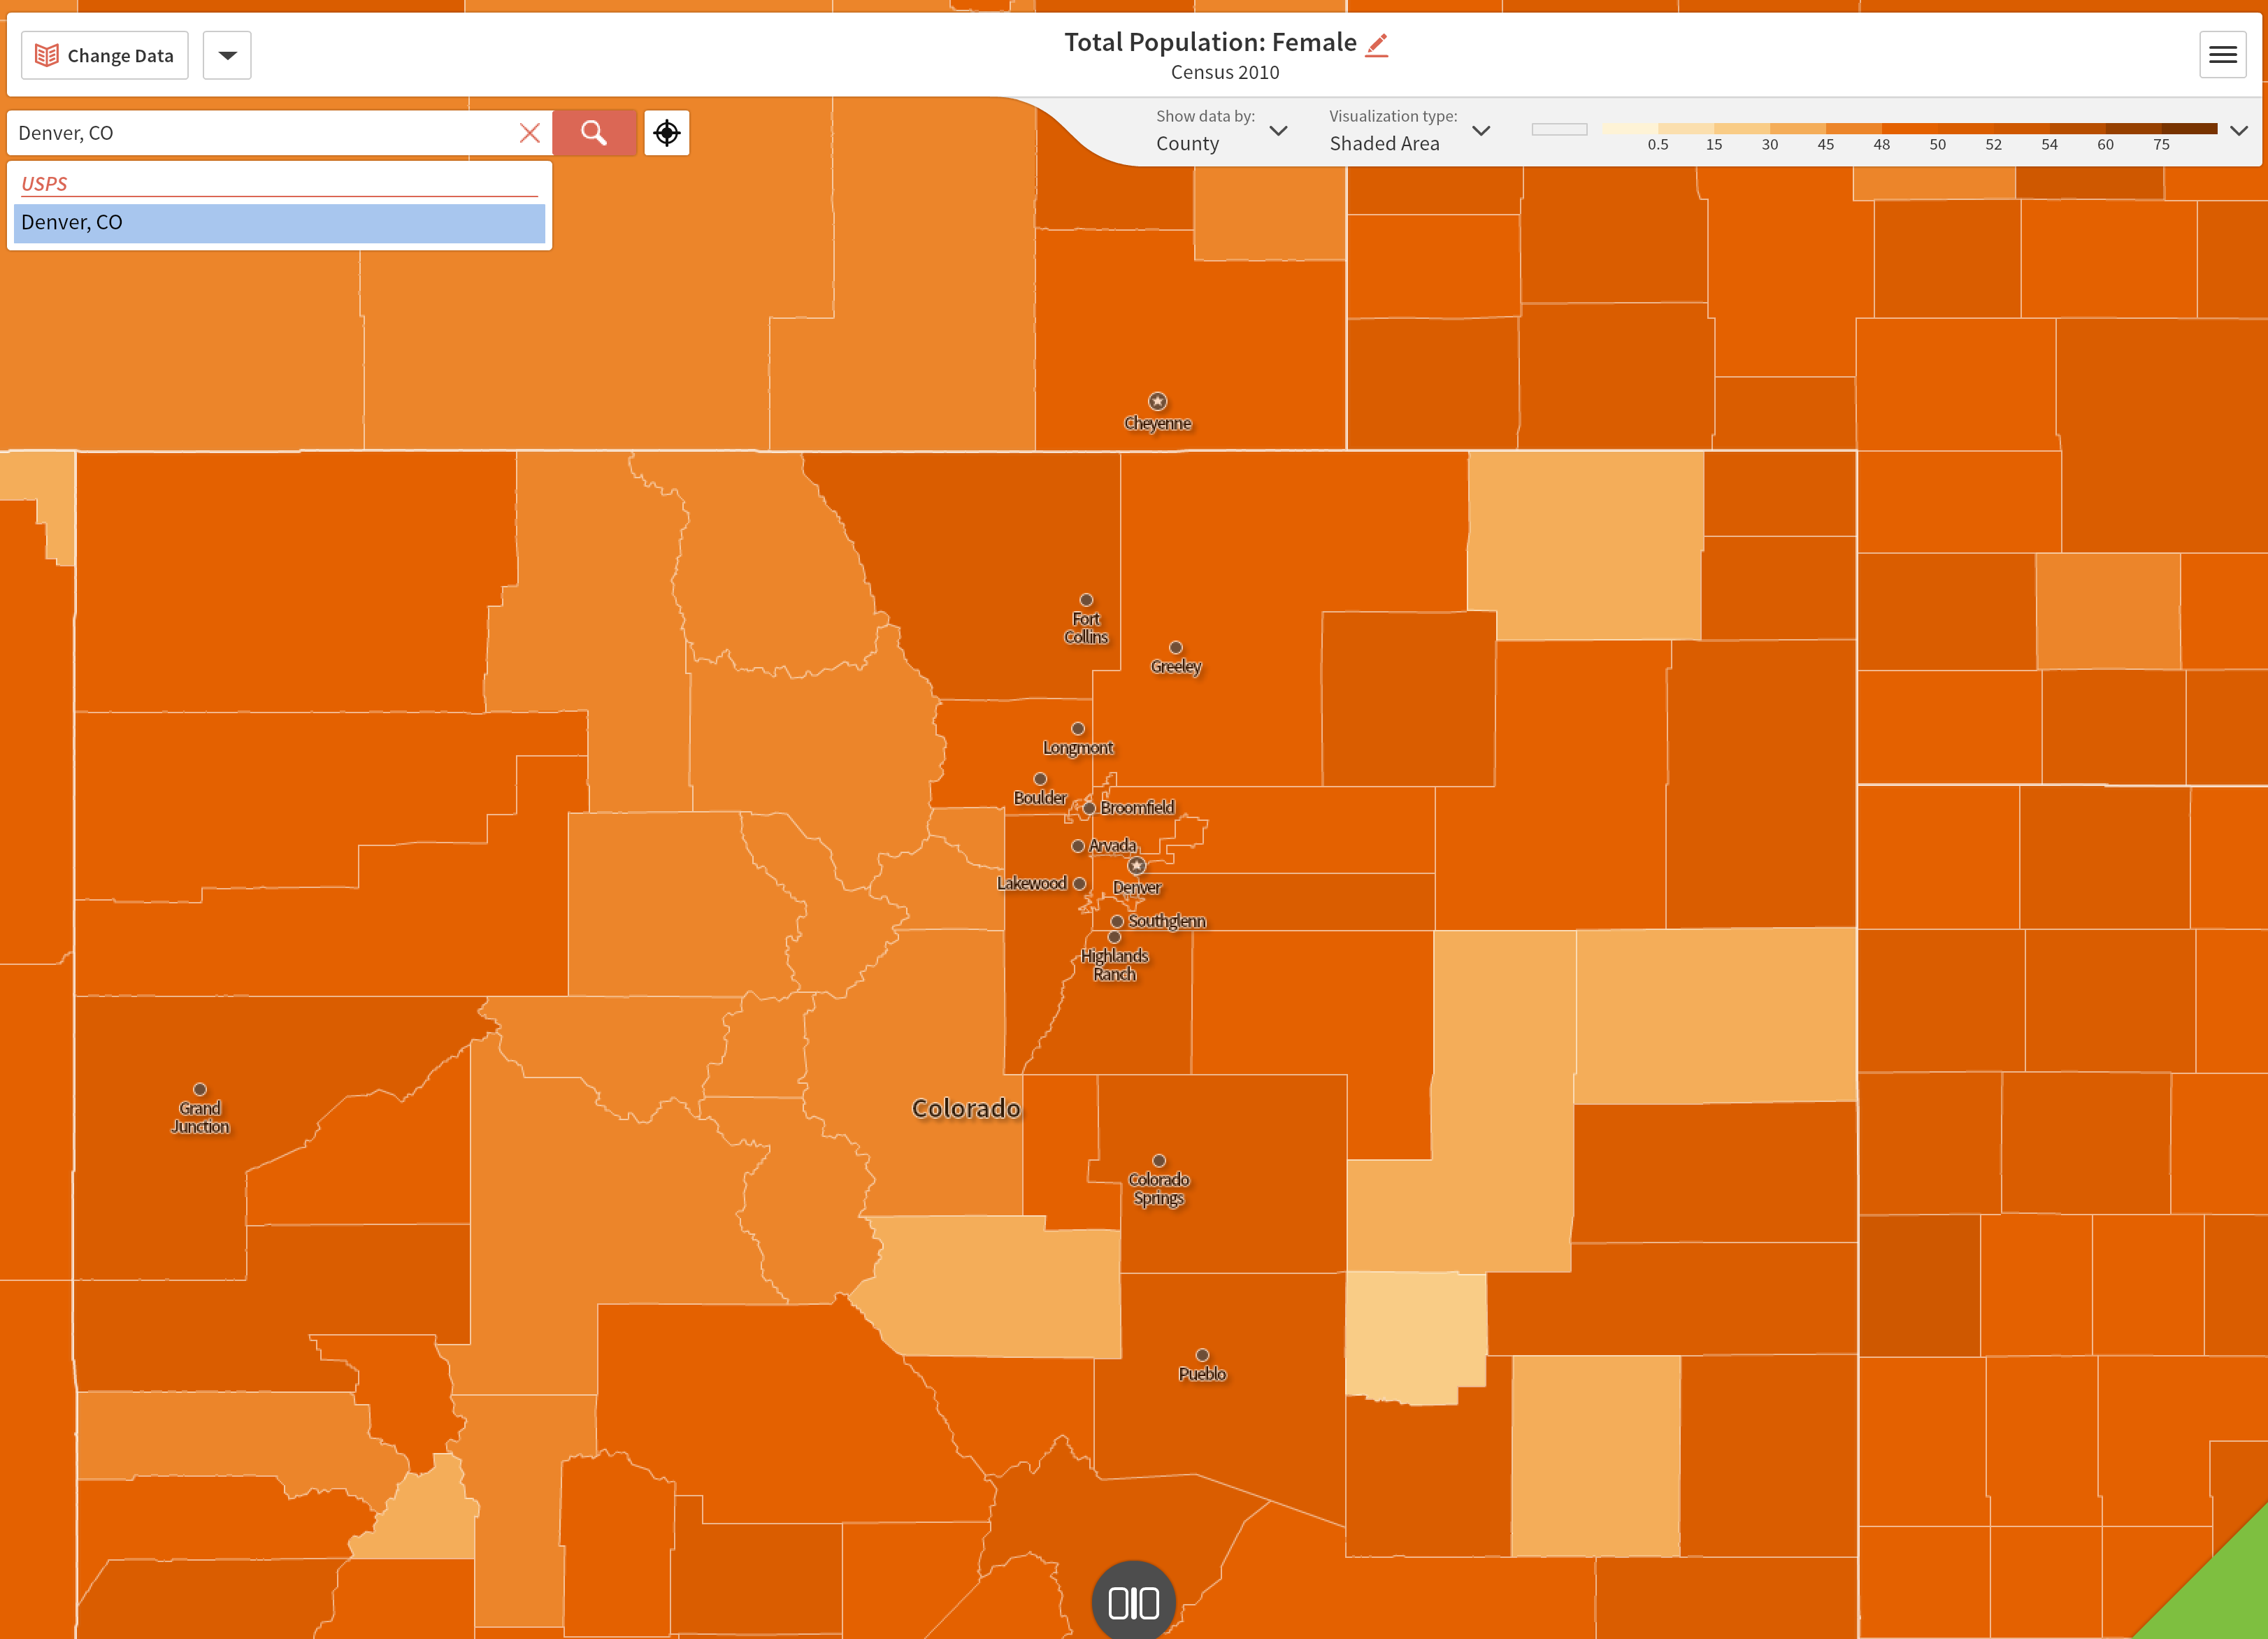
Denver, CO: Total Female Population 2010 Census 49.998%
San Diego, California: Total Female Population 2015 (5 year estimate)
New York, NY : Total Female Population 2015 (5 year estimate)
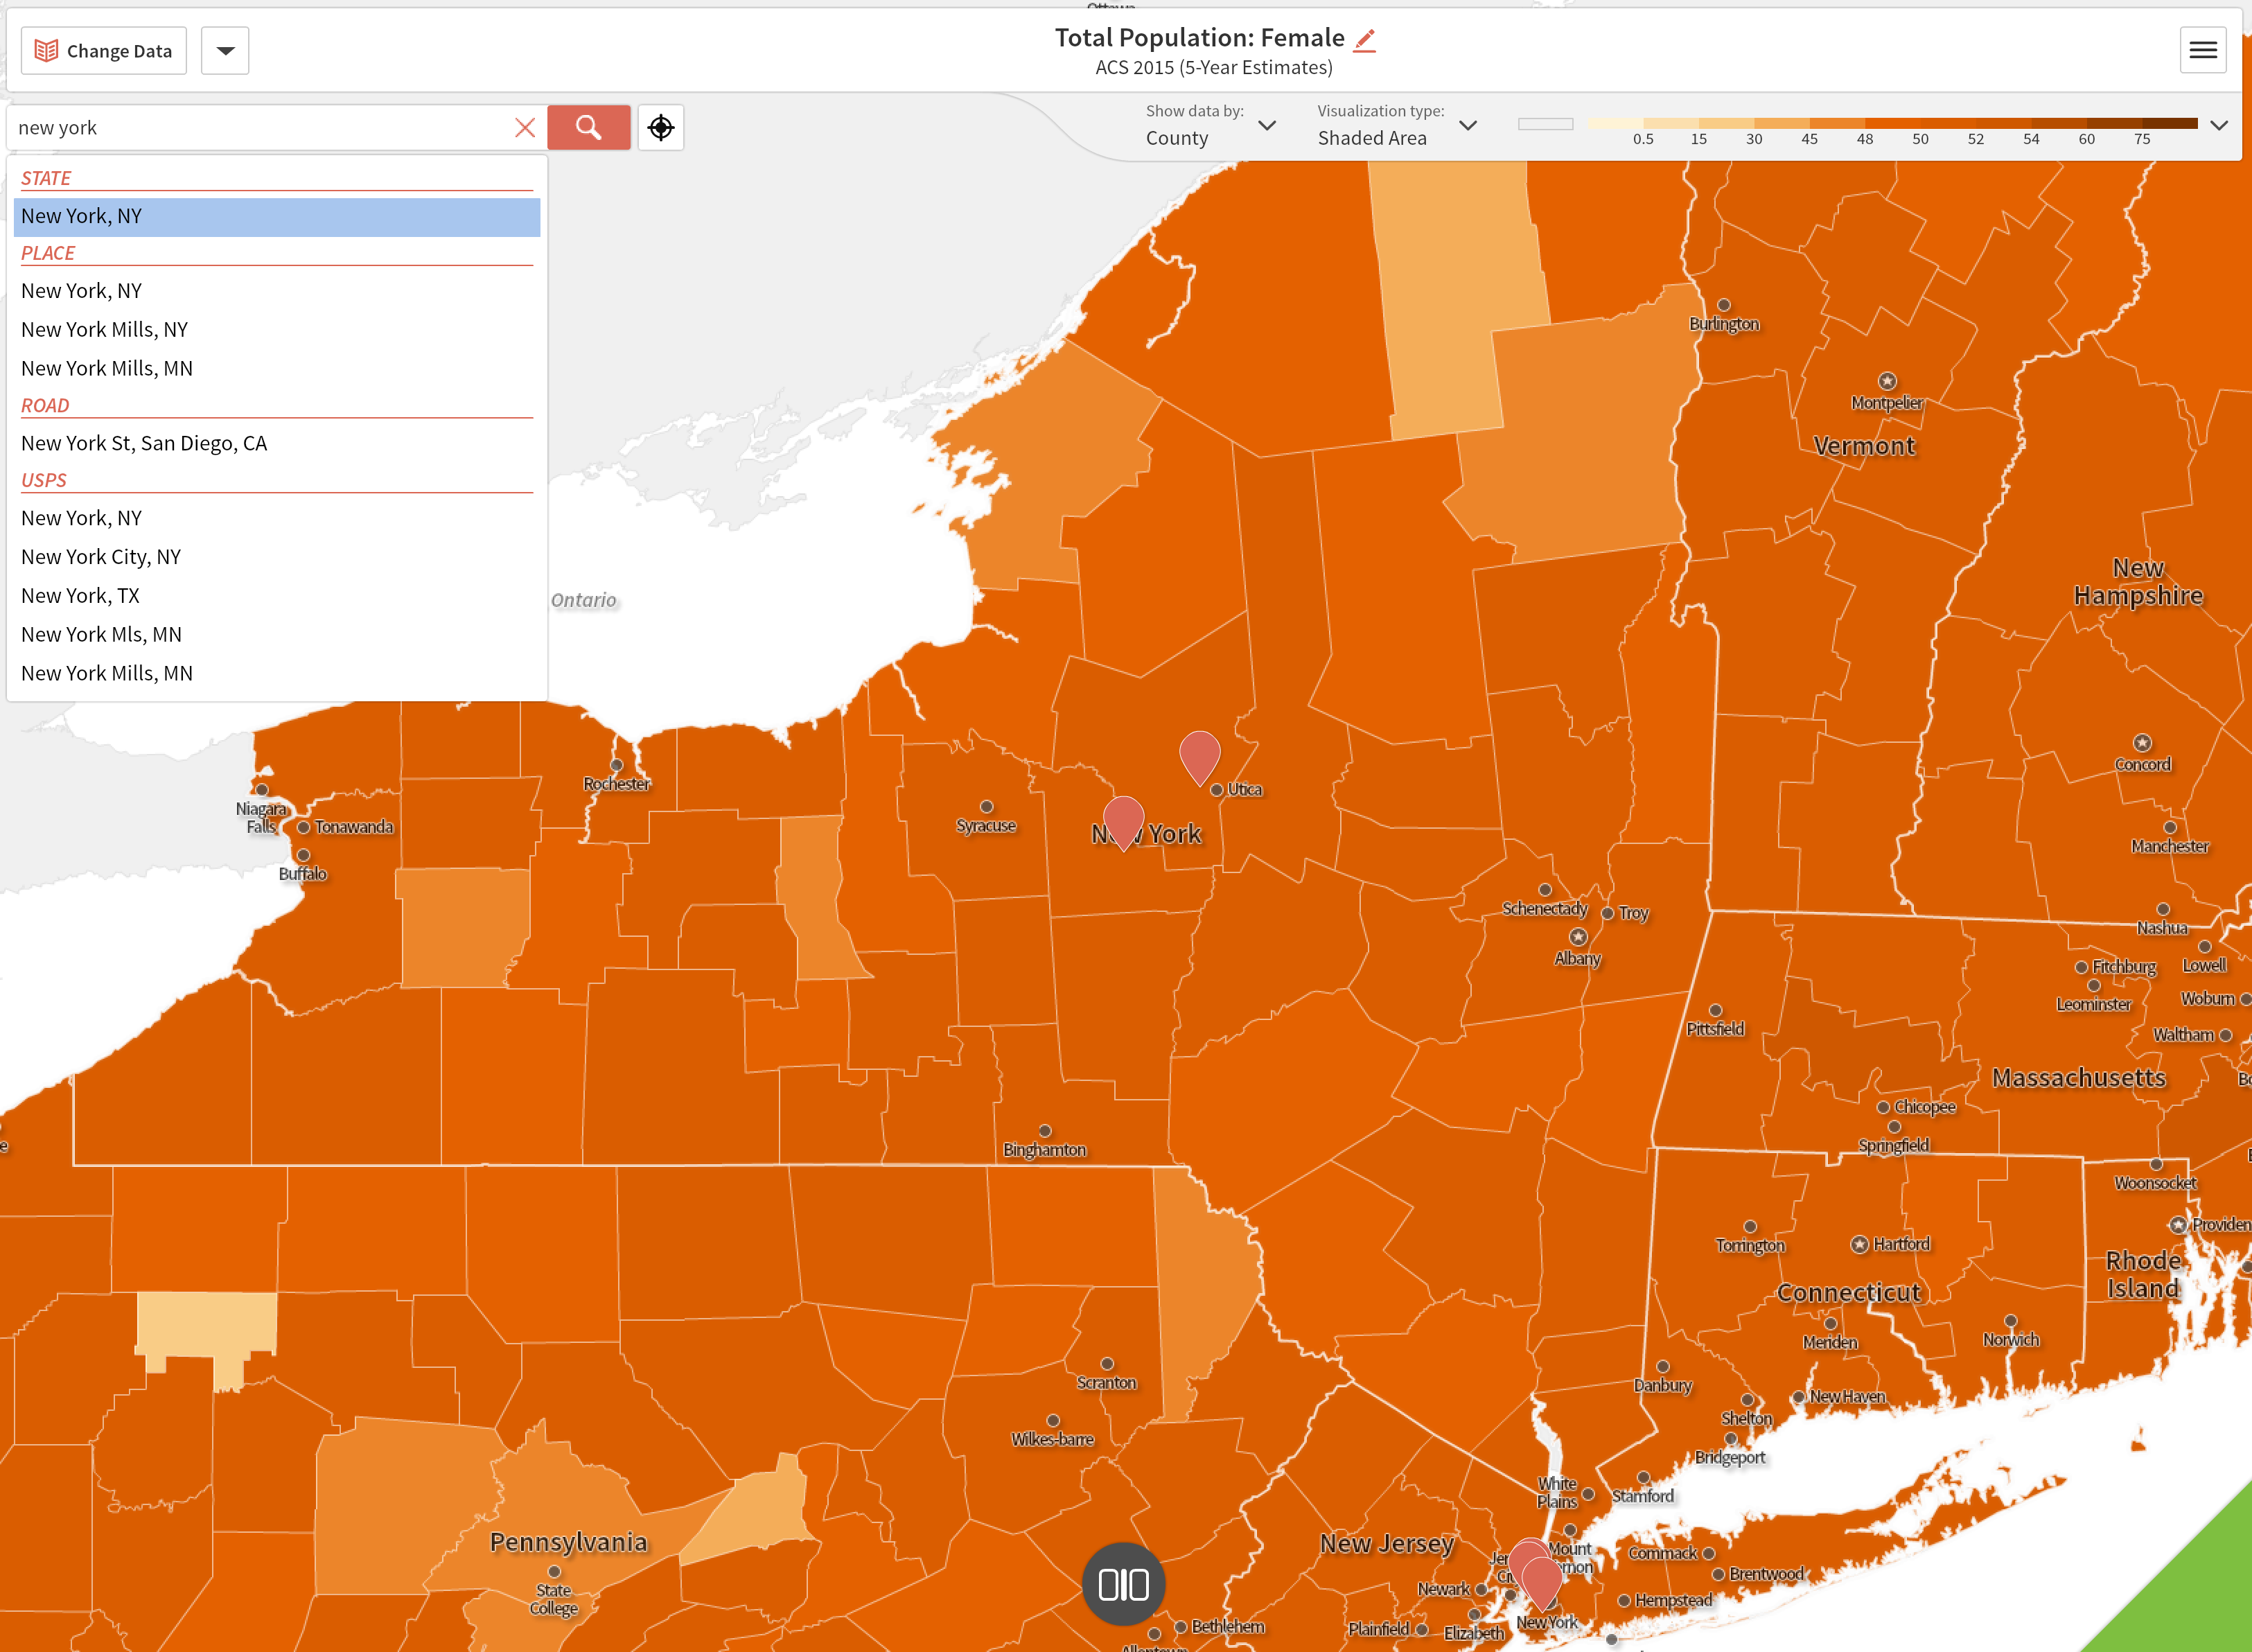
When deciding both the topic and the area in which I would be searching on Social Explorer, I had to really think about the nature of my topic as well as the population that would be effected in the issue that my hashtag evolves around. Due to the fact that my issue is regarding planned parenthood, and this issue is one that this is one that pertains to gender and feminism, I became interested in seeing how gender plays a role in the discussion of this topic. Due to this I decided to look at the population of females in specific areas. When looking at the population of females in specific areas I thought that I could then tie this to where the tweets were being produced regarding my hashtag and see if there were any conclusions that I could draw that would connect the amount of females in a certain location with the amount of discussion regarding this topic. Thus, I decided to look at the areas New York,San Diego, and Denver. I looked at New York and San Diego due to the fact that they generated a lot of data in these areas. I decided to also do Denver due to the lack of interactions with my hashtag in this area and any area around it. In this I looked at the percentage of females in these areas in the years 1970, 1990, and 2010 in order to see if there was any change over the years in percentages as well as if these areas had similar data. I also added in the 2015 5 year estimate because of my own curiosity. When looking at both New York and San Diego I found that both of these areas had a near 50 percent throughout the years, which is something I expected to be true. Although both areas were near 50 percent, San Diego was overall much closer to the 50 percent mark than New York. In San Diego in 1970 the female population was greater than 50 percent and dropped in 1990 and 2010 under 50 percent. Although in 1990 and 2010 it was under 50 percent it rose slightly in 2010 from where it was in 1990. In New York I found that the population was actually more drastically over 50 percent throughout. In all three years the female population was above 50 percent. In 1970 it was 53.41% and then dropped in 1990 to 52.904% then rose again to its highest percentage of 53.508%. While I found this all to be interesting information the only thing that I thought was good to note in relation to my hashtag was the fact that there is a higher female population than male population. When looking into Denver what I found to be interesting was that throughout these years there was an overall decrease in the percentage of women located in this area. In 1970 the percentage of females were well above half and in 2010 this percentage fell below 50 percent. This is something that is very interesting to note when analyzing my data.
The first article that I found on Jstor that I thought was extremely interesting regarding my topic was titled “US Congress Asked to Suspend Funding for Planned Parenthood.” In this article they discuss how antiabortion activists are asking that the U.S. government would suspend the federal funding (300m) that is granted to Planned Parenthood until a case against Planned Parenthood in Kansas is finally settled. The case they are referring to is that of Mr. Phil Kline who has filed about 107 charges against the organization, claiming that the Planned Parenthood in Overland Park “performed late term abortions without determining whether the fetus could survive outside the womb.” Aside from this he charges the clinic for false information. This article was very interesting to read because it is actually posted within the British Medical Journal, next to many articles regarding abortion in Britain. I also think this article is interesting because it points at possible inaccuracies of the organization itself as opposed to the actual concept of abortion and reproductive rights. While this is something I never really thought about it is definitely eye opening to consider the nature of the organization- not for what it stands for but its operations as a non-profit organization. While my hashtag is #StandwithPP, what I am really interested in is issues of gender and feminism as well as reproductive rights. The second article I found that was relative to my topic and similar to the other article was titled “U.S. May Stop Funds to Planned Parenthood.” In this article it first breaks down numerous states and discusses their state abortion laws. The states in which it points at are Arkansas, Colorado, Indiana, Kentucky, Texas, and Virginia. It then discusses how the U.S. may stop its funding of planned parenthood- breaking down into discussion on how anti-abortionists plan to target prisons and then to discuss the pro life population I found this to be particularly interesting considering the date in which it was published- 1987. Reading about the differences between state regulations versus federal funding prompted me to ask one of my friends who is a pub policy major about the differences in what can be regulated by the state versus controlled by the government, as well as how this has changed over the years (considering this article was published in 1987). I really enjoyed both of these articles as they both aided me to really dig deeper into the issue of my hashtag which will enable me to fully understand the discussion around it and develop ideas on its future standing. In his abstract, Graham states that although “processes are necessarily multifaceted, multiscaled, complex and ambivalent, a great variety of ‘software-sorting’ techniques is now being widely applied in efforts to try to separate privileged and marginalized groups and places across a wide range of sectors and domains.” When looking at this in terms of my hashtag and overall issue, I would agree that it is essential to look at the different groupings and divides that can occur when looking at the way in which my data is interacted with. Due to the fact that there are many different levels and outlooks that pertain to my issue, such as those displayed in the two articles I have read- one cannot simply read the data without understanding the background of the user/users interacting with it. He states that software sorting techniques are flexible in the sense that that they can be shaped in order to “sustain highly empowering, progressive and environmentally positive service innovations as well as highly regressive ones.” I believe that my hashtag is one that represents a progressive movement that is multifaceted and cannot be simply read on a basis of just the data produced. This data presents itself to be not only quantitive but also quantitive- and understanding its subjectivity is essential when analyzing its overall presence.
Tanne, Janice Hopkins. “US Congress Asked to Suspend Funding for Planned Parenthood.” BMJ: British Medical Journal, vol. 335, no. 7626, 2007, pp. 903–903., www.jstor.org/stable/20508121.
“U.S. May Stop Funds to Planned Parenthood.” Off Our Backs, vol. 17, no. 3, 1987, pp. 14–14., www.jstor.org/stable/25795586.
I thought that your decision to look at the gender percentages within Social Explorer was very thoughtful and insightful. I feel that you considered your hashtag and the groups of people who would be tweeting your hashtag and further analyzed your data. By seeing where the people are tweeting your hashtag are from and what percentage of these people are male or female really sheds light on how important this issue is for feminists everywhere. I also loved that you decided to look in Colorado, where there were not any geo tag locations from your data set, in order to see if there was different gender percentages, and it was true that there was a decreasing amount of women in Denver over time, super cool.
I thought it was interesting that the articles you found on JSTOR all critique Planned Parenthood. A lot of people propose cutting the funding for Planned Parenthood, or critiquing the actual way the organization works, I would be curious to see how planned parenthood started. How did it frame itself initially to gain the majority support? Was it universal? These are all questions that I do not know the answer to, but i think would help me better understand why there is sudden dislike for the program, other than just being pro life versus pro choice. I think that learning more about the start of Planned parenthood would create a better understanding for those who #StandwithPP.
? How do the insights of this post make you think differently or in new ways about your post from the same week?
Looking at your data set and mine data set, I agree that we do not have “big data.” What I learned from your post however, was that my hashtag encompasses more groups than yours and Naty’s. LGBT is such a wide community, that I am excited to look at my data set with the hashtag LGBT instead of LGBTrights. I think that once I start collecting a larger data set, our data sets will be much different, and yours could potentially be viewed as a subcategory of mine.
As with Olivia and my data, I agree with you that although big data is not always large in quantity, these results should not qualify to be big data. It is not wide enough of a range of data to be able to draw accurate conclusions. It’s surprising that with over 20,000 tweets, you have so few that have a location tagged to them. Given that Planned Parenthood may soon lose government funding, I would think that people who are passionate about this cause would be interested in providing a location to their post as well, so that the US government can see where in the country pro-abortion advocates are (which is all over the country). It was interesting to see that of the tweets that have geotags, they are not primarily in the big cities of the United States. Rather, they’re in the mid-west in smaller cities. I am not sure what to make of this information, as I would think that with all of the rallies and protests happening in NYC, Los Angeles, and other major cities, people would be adding geotags in these areas.
I found it interesting that the percentage of the population that are women in Colorado dropped over the course of the years between 1970 and 2010, and that the New York population dropped significantly by 1990 and then went back up in 2010. It would be understandable to have a slight fluctuation but this drop and rise of 4% likely indicates that something was deterring women from living in New York around the 1990s. These results show how useful census data can be for finding endless topics and ranges of dates to study to better understand how our country has developed over the years.
It may be worth doing a bit of research into what was going on with women’s rights and equality in these time frames so that you could better understand why these fluctuations in population percentages were occurring. Your choices of location for the study were good choices, though, as they do provide info that I would consider to be significant.