
1. I expect the majority of people tweeting in the continental US. A google search of the coordinates of the US has it at 37N, 95W. I think that a majority of the tweets will be coming from the southern states, so around 31N, 99W, because a lot of the people there are Trump supporters. I would guess my hometown is 45N, 75W, and there will be few tweets about Trump from there. I don’t think a lot of people from my hometown use Twitter, and I am pretty sure there are not a lot of vocal Trump supporters in Sharon MA.
2. Total Tweets: 10,199
3. I had 56 tweets with geolocation, out of 10,199 tweets. This comes out to… 0.0055. Such a small percentage! In the book Data Points, Yau brings up the idea that there is always uncertainty with data. I think this relates to my data because I have so few tweets with geolocation, and even if they were all from the same place, they would still only represent half a percentage of the total tweets, so the rest could be from anywhere. I must be careful extrapolating my data from such a small percentage. The underrepresented minority must not be ignored. The majority of my tweets are coming from the Longitude of 30 and 40 North, and 70-80 West. Therefore they are majorly based in the North Western quadrant of the globe. This is where the US is, so that is why I think all these tweets are coming from here. Every tweet is in English, which I expect, and I think some tweets from Mexico are missing. I think that since so few tweets have geolocations, I am missing a huge chunk of the picture!
4. For geolocation tweets, I do not think I have big data, I only have 56 tweets here. The simplest way that I know I don’t have big data for both total tweets and geolocation tweets is that I do not require a supercomputer to process my data. In her article, Boyd references the need for a supercomputer to constitute big data.
5. I had much fewer tweets than Jennifer, she had 60k + and I only had 10k. If I had to guess, I would say that the hashtag #MakeAmericaGreatAgain is just too long to type and the average person doesn’t feel like typing that out after. I yelled for Harrison, but the call was not answered. However, #nobannowall is also a pretty long hashtag, so maybe people felt it was important to use this hashtag in light of the recent muslim ban fiasco.
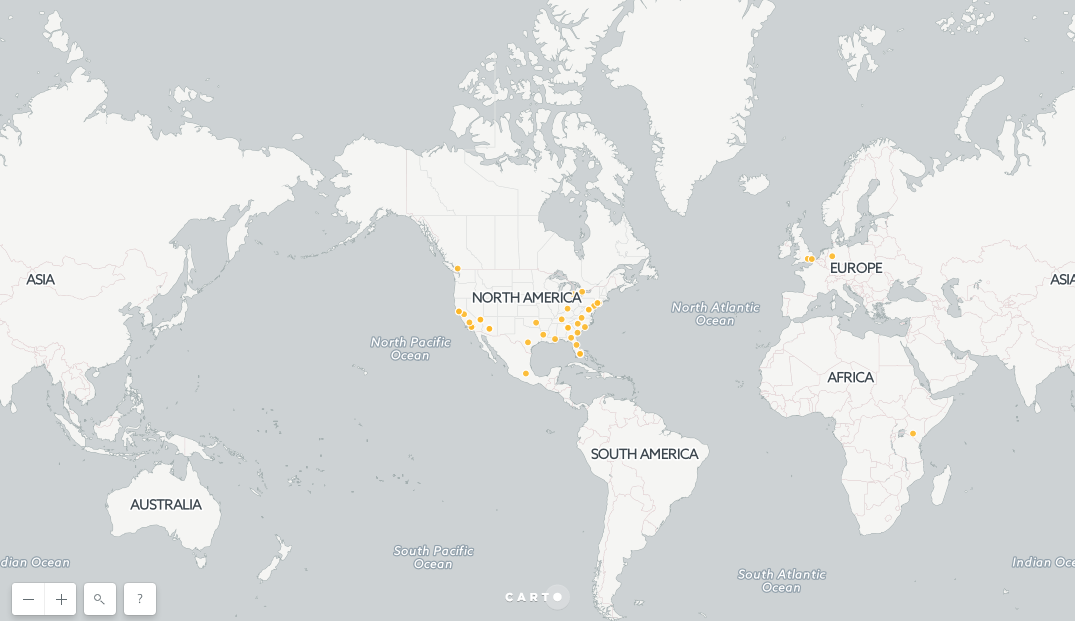
6. This was the section I couldn’t figure out. I was able to make a map, but not one that included the time effect. I went with the simple white map with orange dots design. It is evident from the map that the majority of mapped tweets come from the within the US and most of these are found in the southern half of the country. I think it would be very interesting to look at when the tweets were posted because many of my tweets are retweets from bigger Trump accounts, such as @Trump_train. The story my map is telling is that the southern US states tweet more often and favorably in support of Trump. Once again the missing story comes from the missing geolocations of 99.5% of the total tweets with the hashtag #makeamericagreatagain.
Part 6:
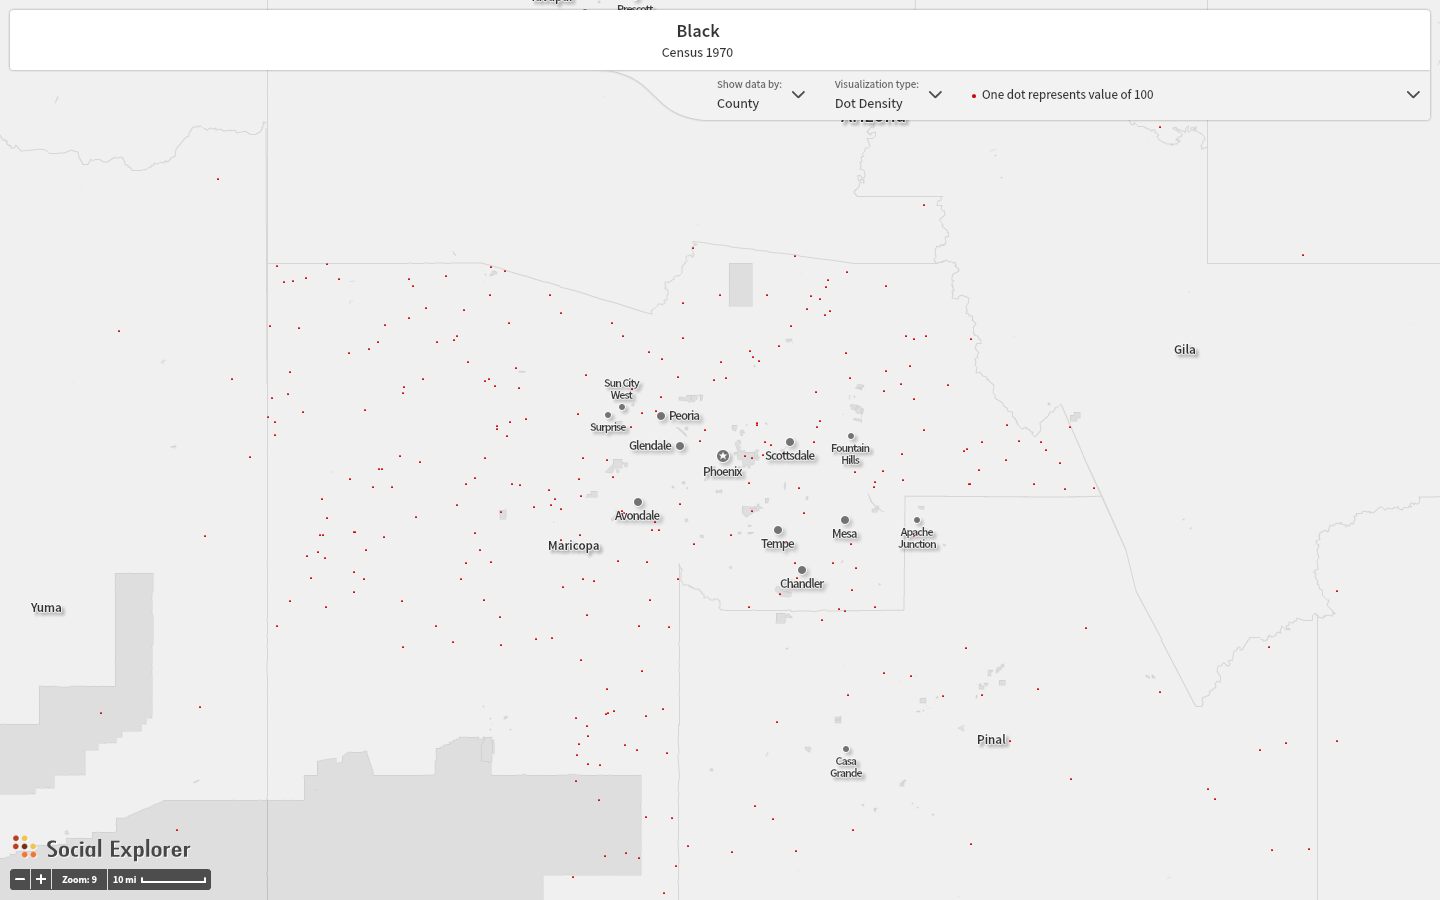
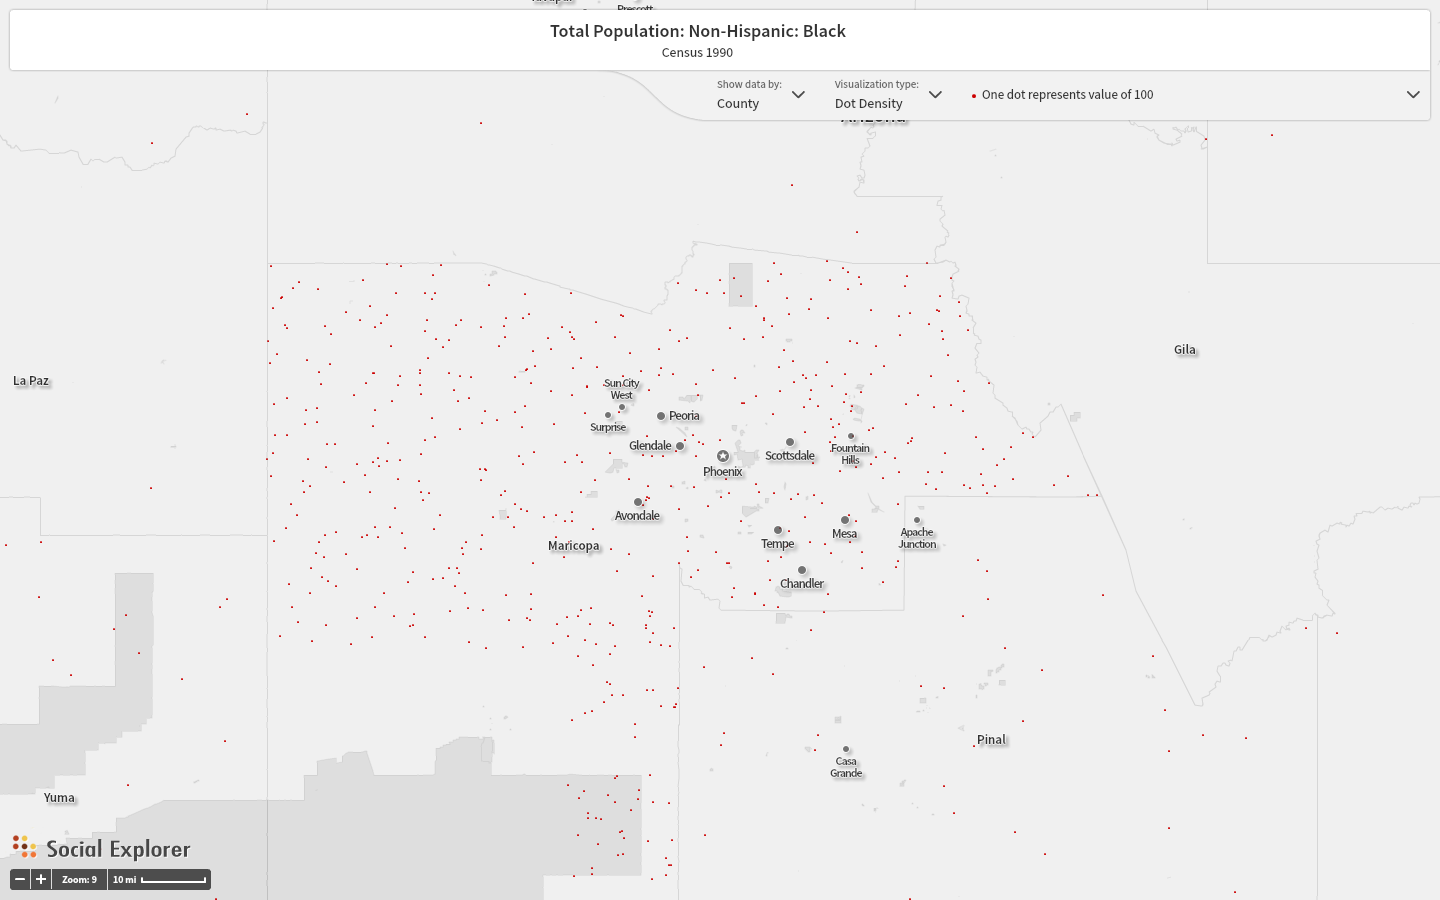
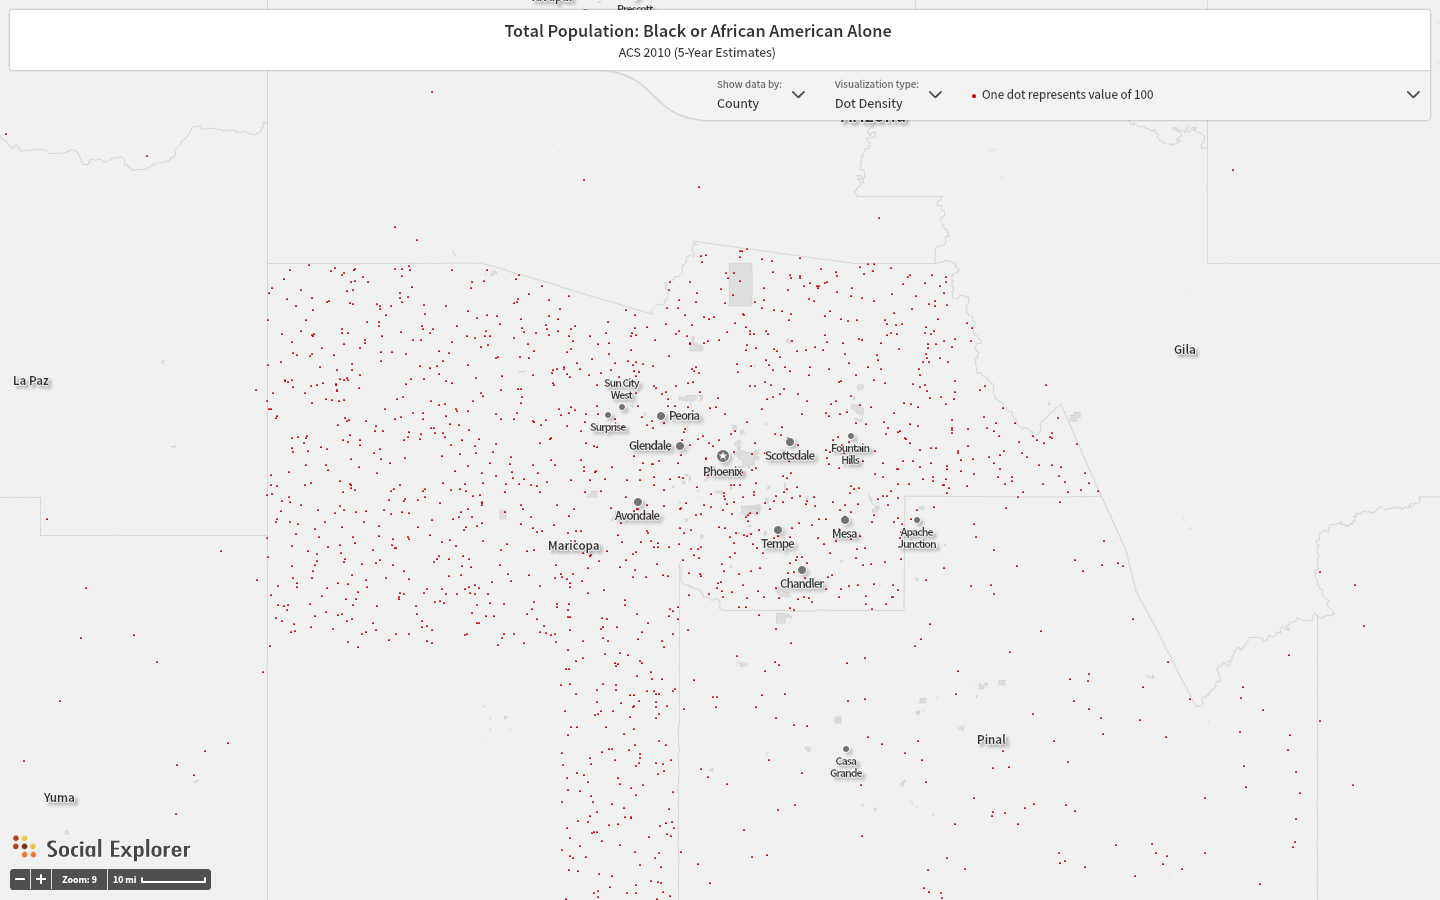
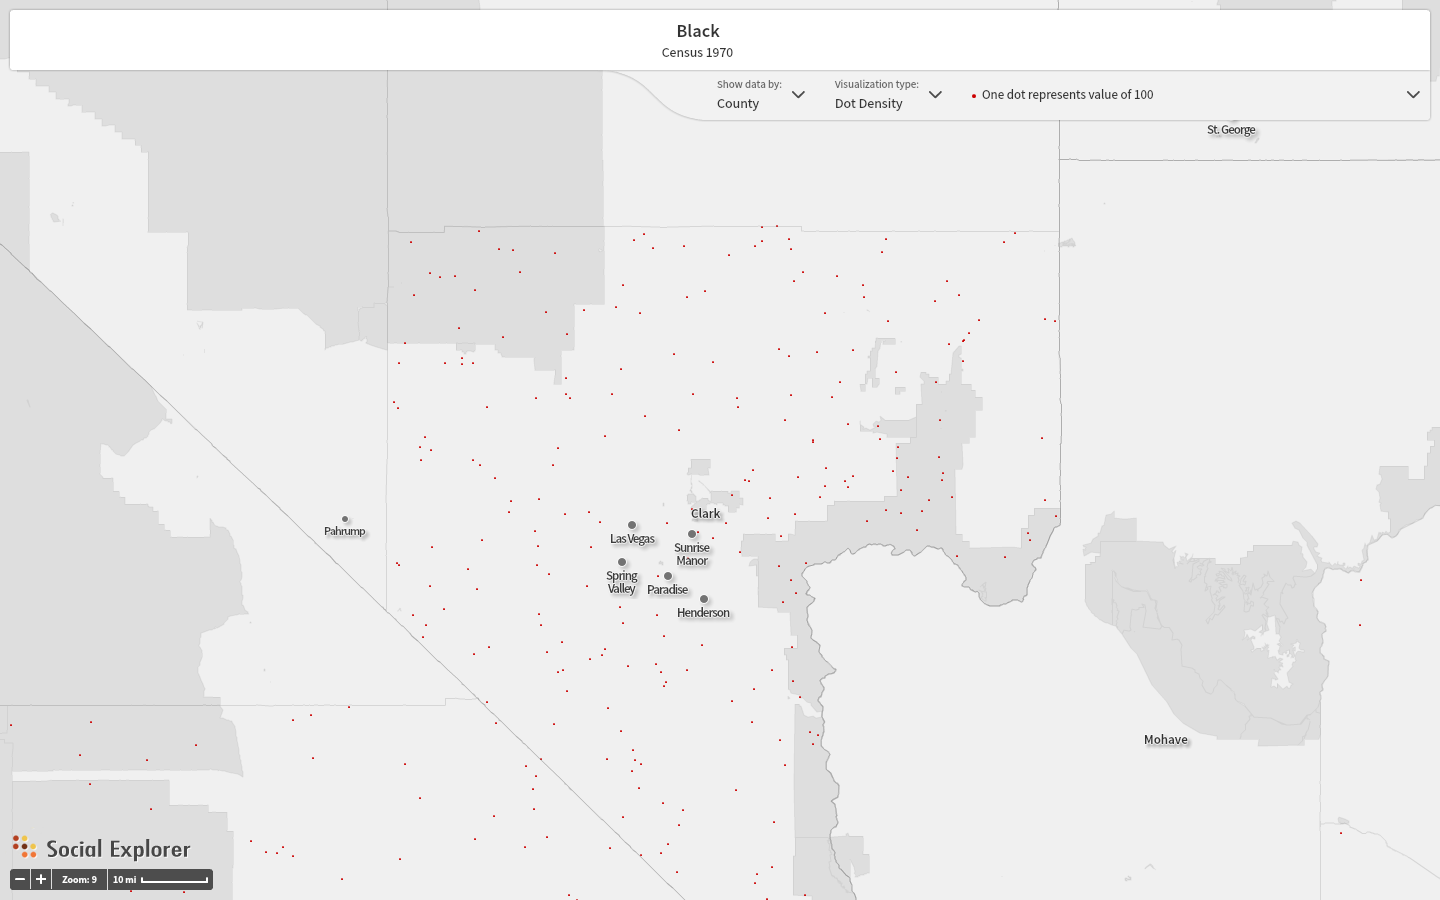
I chose the 3 locations: Fairoaks GA (30008), Phoenix AZ (85001), and Las Vegas Nevada (88901). The census I looked at was black population. I chose these places because when I looked at my mapped tweets, these places had the most #makeamericagreatagain tweets coming out of them.
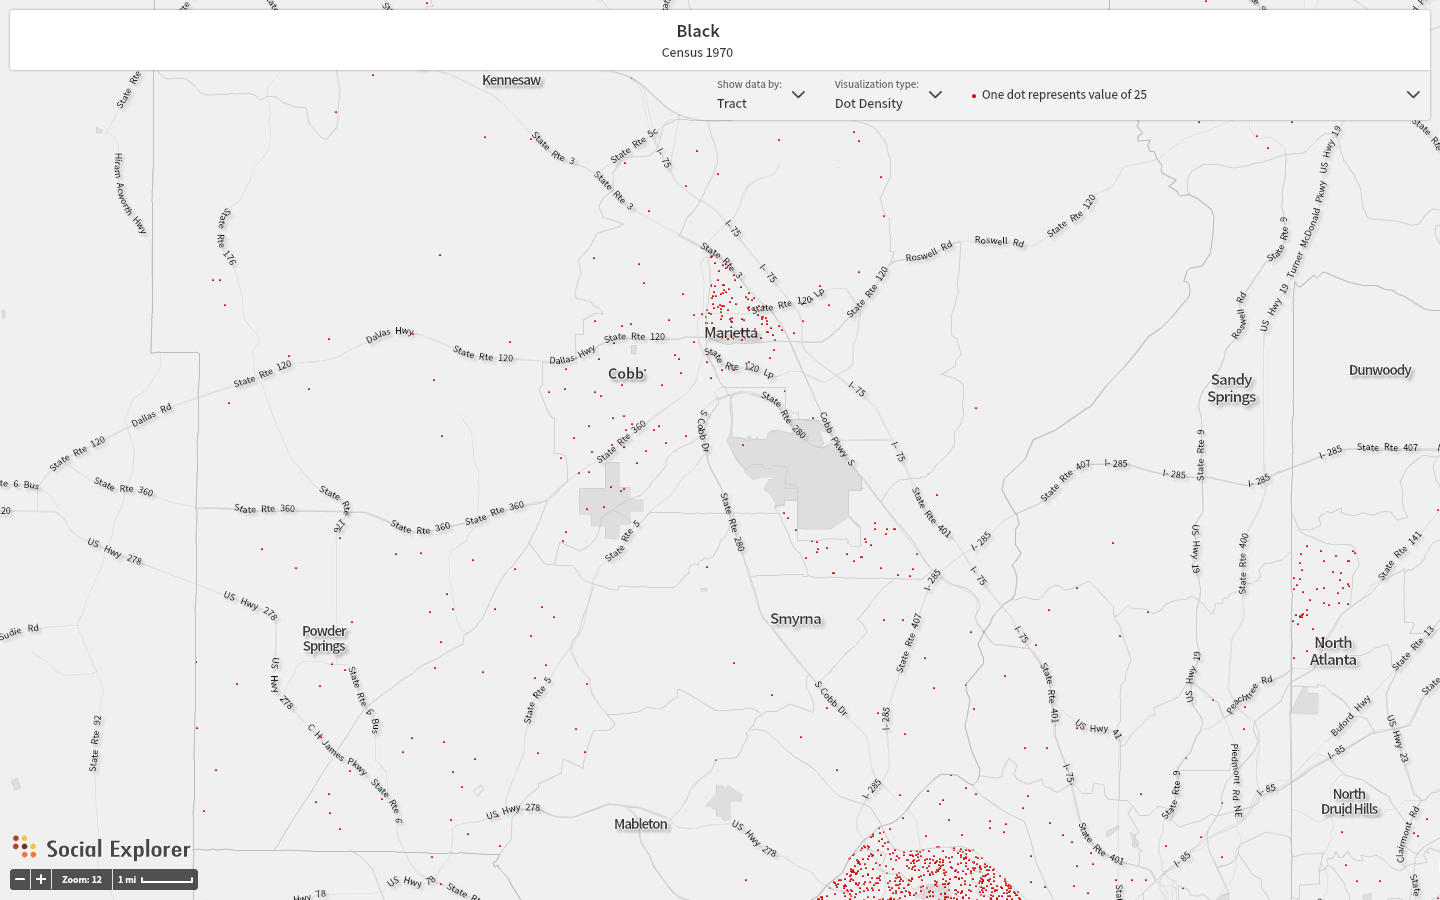
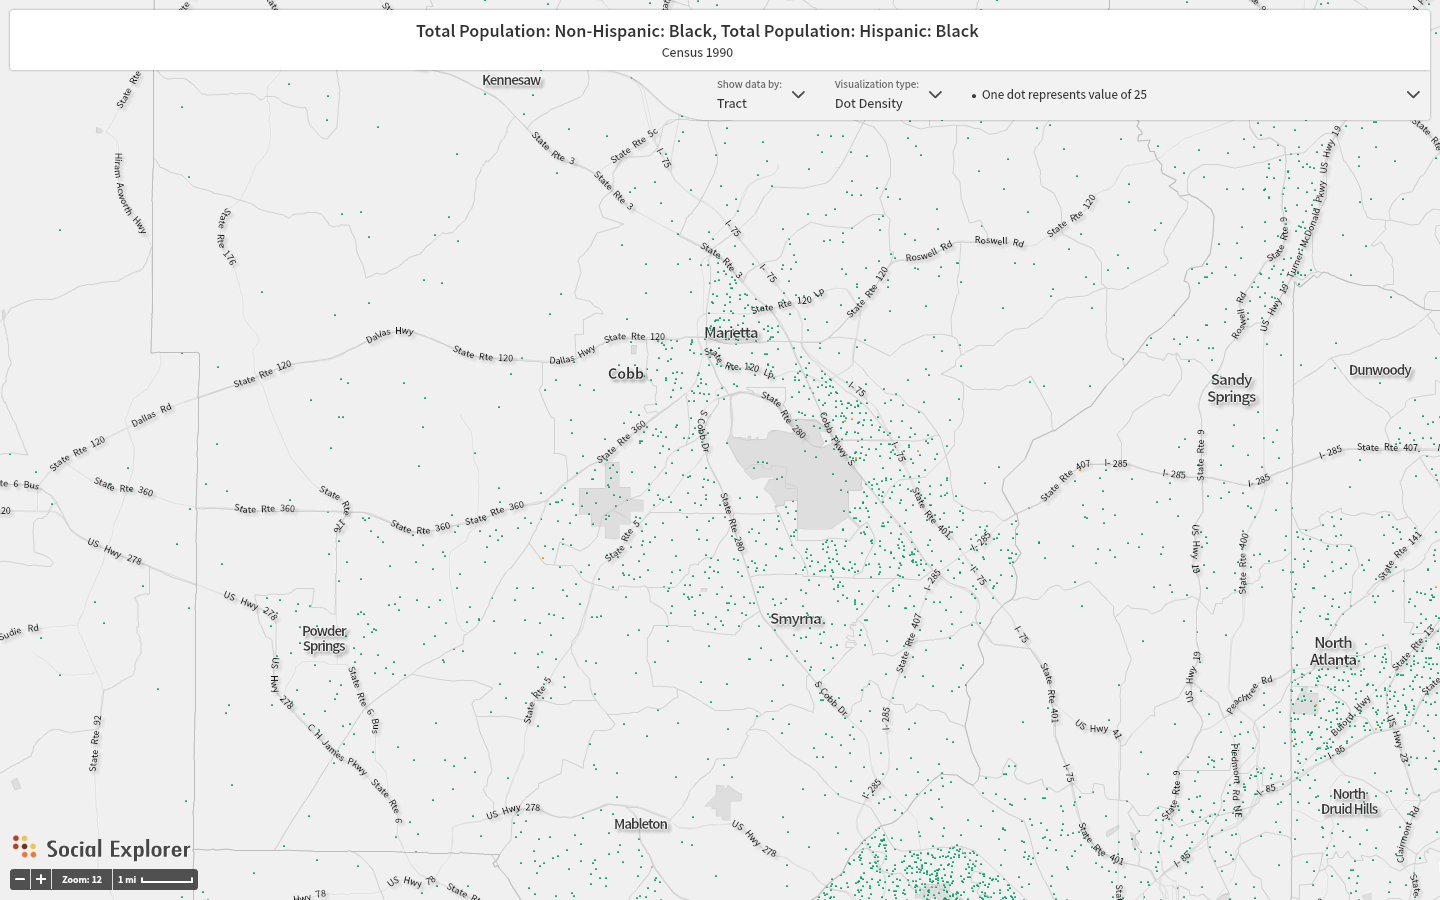
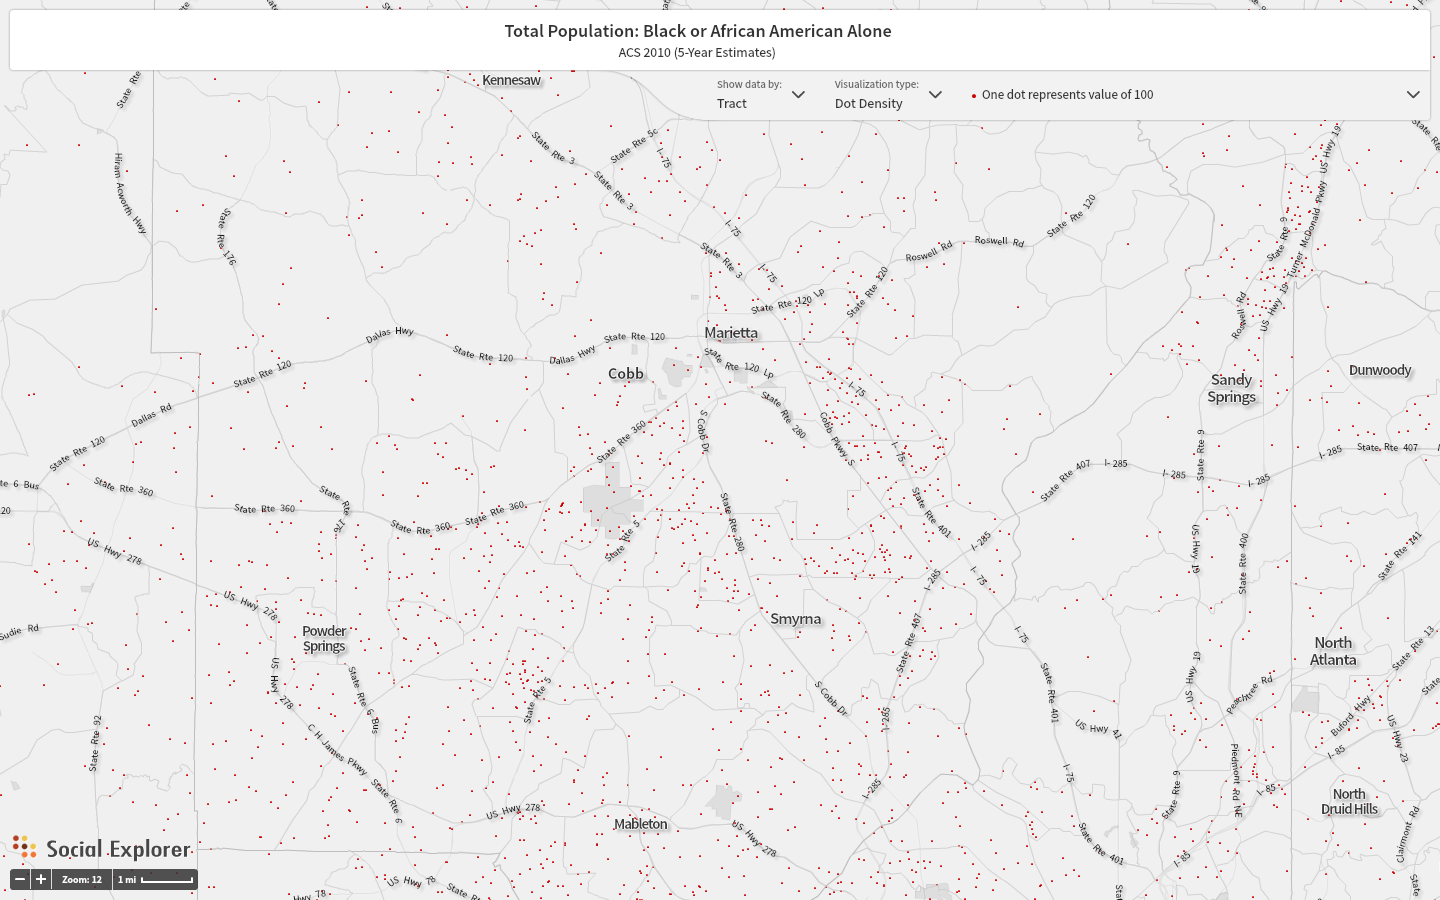
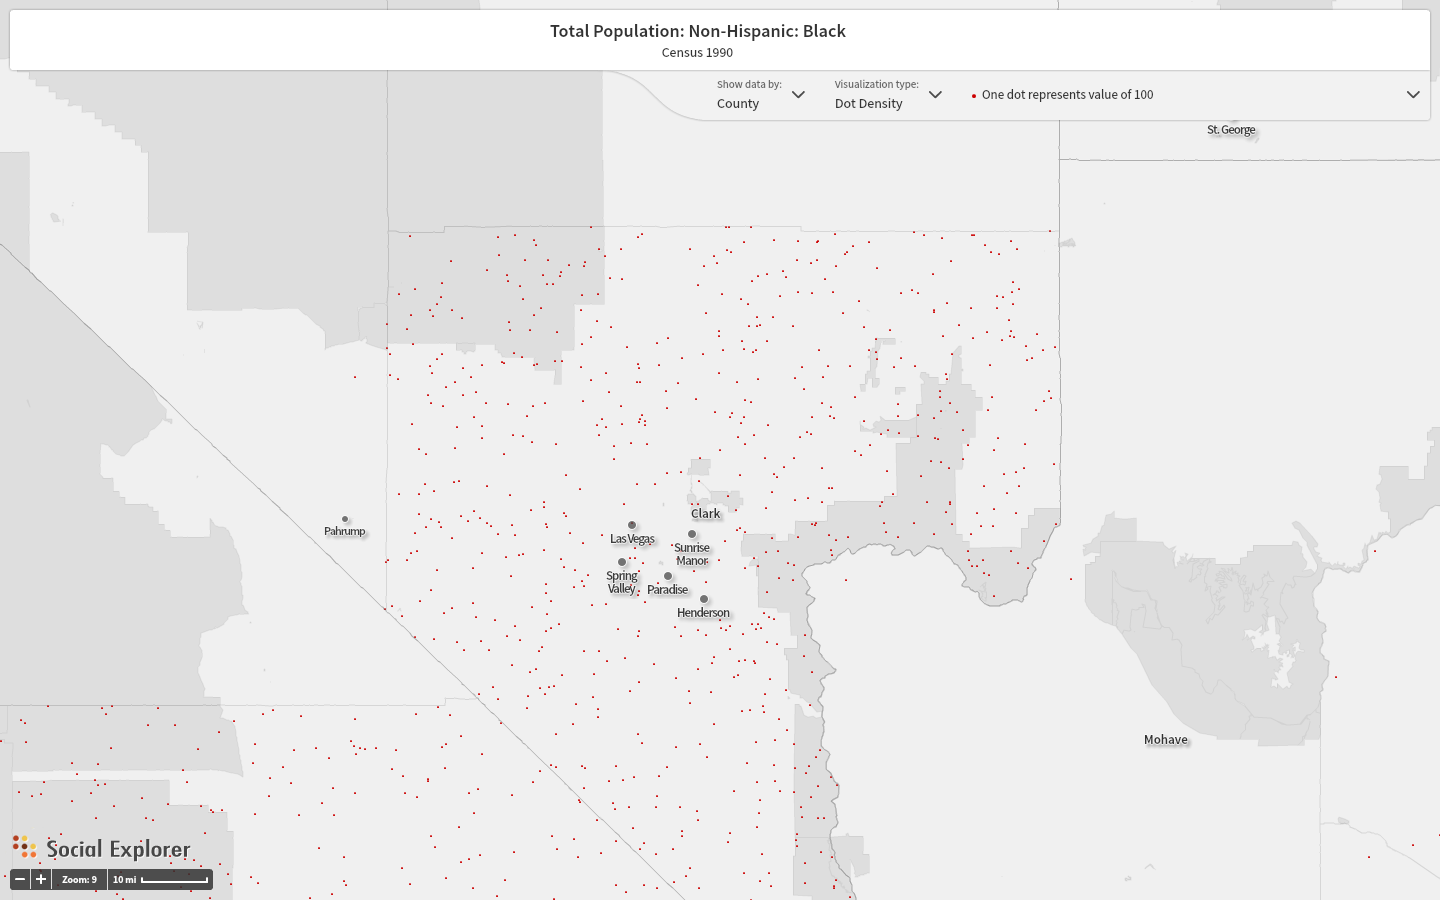
For all of these maps, 1 dot represents a value of 100 black people.
Fairoaks, 1970
Fairoaks, 1990
Fairoaks, 2010
Phoenix, 1970
Phoenix, 1990
Phoenix, 2010
Las Vegas, 1970
Las Vegas, 1990
Las Vegas, 2010
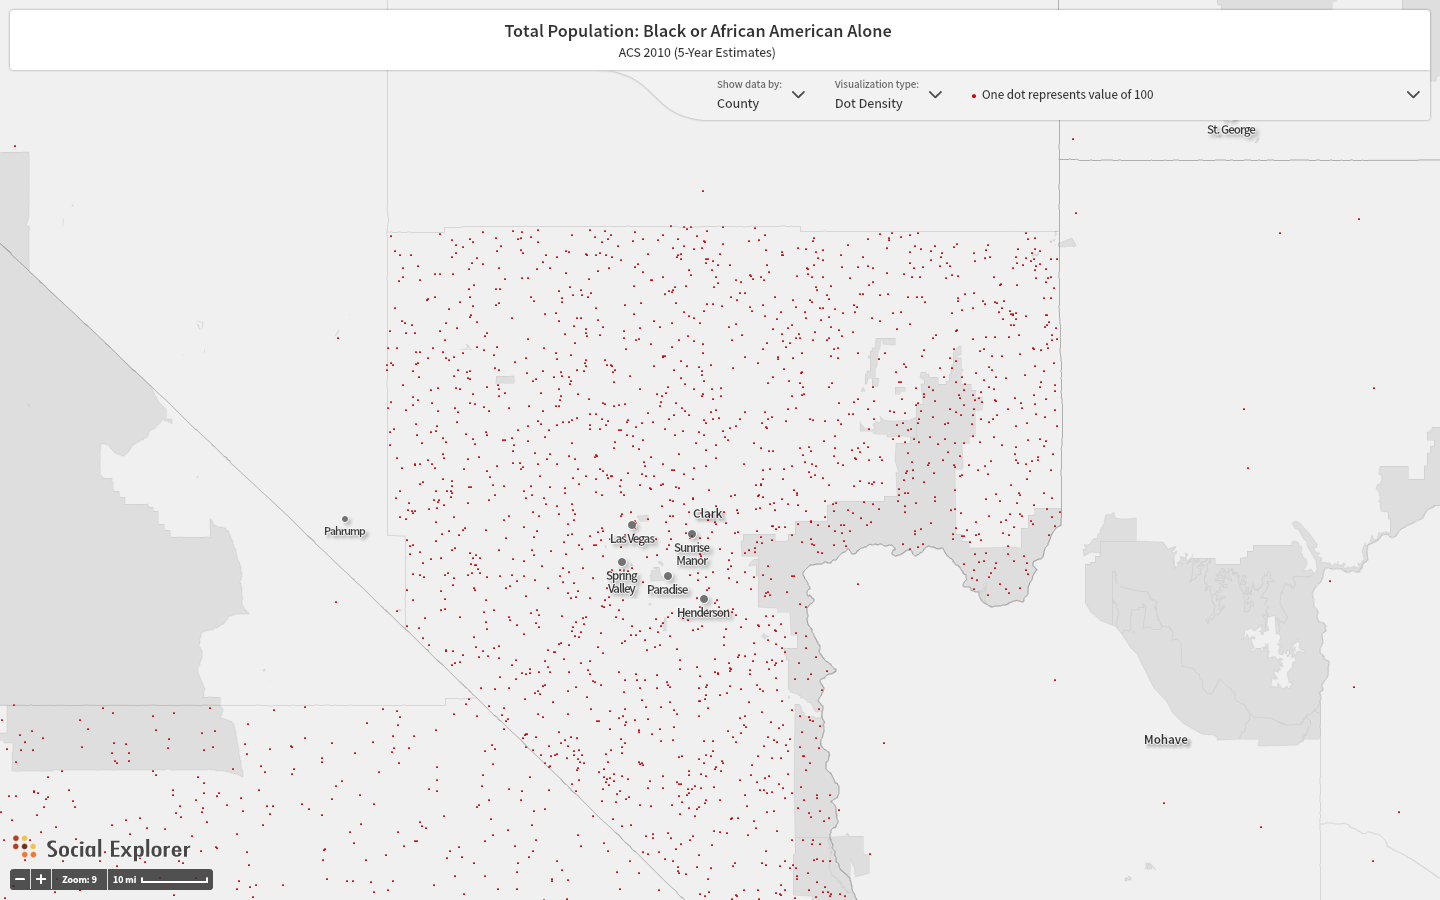
In all of these maps, I see the population of blacks increasing consistently across the years. In all 3, the 1970 black population was just a fraction of the black population in 2010. I should also have looked at how many white people were in each of the 3 places, then I could have compared the racial prevalences in the cities. This may have helped me understand my mapped data better. I think my Twitter data is helpful to look at on a map because it gives us a better idea of the political climate of the country. Visualizing data via a map is just another way of looking at data, and sometimes it can be very helpful and other times it wont change how we think.
Final reflection:
The first article I looked at were the differences in political opinion between whites and blacks in America. I thought this would connect to my maps on black populations and why Pro Trump tweets were coming from this location. The problem was this article was from 2001 so it may not be relevant to Trump. The article basically said that racial differences in political views was not a bad thing, and I can see that these differences exist. I bet if I were to overlay a map of Trump supporters with one of highly populated white areas, there would be a lot of overlapping cities. The next article was about the dominance of republicans in the majorly white south in 1998. This trend of republicans controlling the south has still stuck today, and it explains why many of the tweets about Trump are coming from the south. This article basically explained to me that this Trump phenomenon is not really as unexpected as we initially thought given the political climate hasn’t changed much in 20 years.
Software sorted geographies: Graham’s definition is the “role of computerized code in shaping the social and geographical politics of inequality in advanced societies”. I think if we could create two separate hashtags, one #protrump and one #antitrump and we mapped all the tweets coming from these 2 camps like that, then we could sort the politics of the country with an algorithm. I think by only gathering data from one side, I am unable to really sort the political climate of the US. I can see however that the more white states have more tweets supporting Trump, and that is something that can be taken into account when looking at Trump supporters. Many of them are coming from the same place.
Citations:
Black, E. (1998). Presidential Address: The Newest Southern Politics. The Journal of Politics, 60(3), 591-612. Retrieved from http://www.jstor.org.ezproxy.trincoll.edu/stable/2647640
danah boyd, Kate Crawford (2012) CRITICAL QUESTIONS
FOR BIG DATA, Information, Communication & Society, 15:5, 662-679, DOI:
10.1080/1369118X.2012.678878
Kinder, D., & Winter, N. (2001). Exploring the Racial Divide: Blacks, Whites, and Opinion on National Policy. American Journal of Political Science, 45(2), 439-456. doi:10.2307/2669351
Yau, N. (2013). Data points: visualization that means something. Indianapolis: John Wiley & Sons.
Looking at your map of tweets, I find it interesting that a good part of your mappable tweets are located in California, which is typically a democratic state. These tweets could be used in a negative sense as well, so I am curious what is being said in these tweets and if the hashtag is being used in a positive or negative way. I agree with your thoughts about big data and how such a low percentage is not classified as big data. It also gives me reassurance that your percentage of mappable tweets was low, because I had an abysmal percentage and was afraid I did something wrong. It took a little while that my percentage was actually that low! I am interested to see how your tweet will carry on in the future since it was an election based topic. I hope your dataset continues to grow, as well as your usable and mappable data!
Tim, I was surprised more tweets came from overseas – Canada, Germany, UK, and even, Kenya – as I thought that #makeamericagreatagain only interested American voters. Americans living abroad could have tweeted or it may indicate that the international community is concerned with American prosperity as well. Did you see what was the main message of these international tweets? Though you did note that most of the tweets came from the South, I noticed that the geographic spread of your tweets was more diverse than Harrison’s and mine. Since you had tweets from all parts of the country, in the cities and rural areas, it demonstrates Trump’s widespread support despite his polarization and how he was able to win the Electoral College. The black population grew in each city that you mapped, indicating either more black people are moving into cities or have been staying in the cities since the 1970s and haven’t moved out to the suburbs compared to white people. I’m interested in learning more how these cities tended to vote in the election and if the black population made a significant difference in their precincts.
Though you wouldn’t have been able to find the information in Social Explorer, I am interested in seeing how these cities and their states voted in the 2016, 2012, 2008, and even 2004 elections. Were there any shifts in political power in the last couple of elections? Did they vote more for a candidate as opposed to another even if they predominantly voted for the same party (ex. Trump vs. Romney or Obama vs. Clinton)? Or voting in even historical elections to see if the city has become conservative or liberal as the black population grew? As an Urban Studies major, I am also interested in seeing the demographic composition of the suburbs in these cities.
Reviewing your and Harrison’s data provided me insight on how geographically widespread the popularity of a hashtag can be even if it may seem like a localized issue. Your map captured that not only that America is diverse, Americans also live everywhere and there are strong U.S. influence and concern for America’s well-being abroad. I am fascinated that the article that you read noted that Trump’s rise to power is not surprising because the political climate or affiliations in the South haven’t changed in the last 20 years. Yet, even though people believe in the decline in American superiority, they still don’t necessarily attribute it to the political party as they have been voting Republican for years, but perhaps figures in power. It makes me wonder if people will continue to discuss #nobanowall after Trump leaves office.