
This week for my data, I chose to look at the last week of tweets. I hope that the tweets I see are positive and accepting of Islam rather than opposing it. I hope to see words of support.
I have 173, 596 total words and 8,640 unique words.After I got rid of the initial stopwords, I still had a lot of sorting to do. Originally, when looking at the data the most frequent terms were Islamophobia, rt, û_, http, and city. This is clearly causing my data to be obscured because 3 of these 5 terms do not have anything to do specifically with my hashtag but more to do with Twitter in general. I do not think that these words are useful because they are words that do not add an context to my data sets. There were a lot of weird symbols that were in my text analysis picture that I needed to get rid of. I feel that there is a fair amount of data still missing from the picture. I had to enter stopwords many times in order to finally have a picture that made sense.
Stopwords: etc, http, htt, ltd, m103, û, û_, ûï
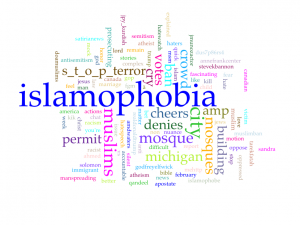
After I had entered many stopwords in to my list, the most frequent words in my data were Islamophobia, city, muslims, mosque and ban. I am not shocked to see the words muslims and ban tied to my hashtag because of Donald Trump’s muslim ban and how these two issues are correlated. The words that appear in my data does not surprise me and make more sense the ones I originally saw. I felt as though 105 words in my word analysis cloud helped get the best picture of what my data represents.
My word analysis cloud is filled with words like hate, hatecrime, fear, racist, prosectuing and many others. This word cloud gave me a better picture of what people are saying regarding Islamophobia. I think one thing that is interesting about looking at this cloud is that you are not entirely sure how people are using the words you are seeing. I would assume when looking at the word hate that people are using that word to talk about how people being Islamophobic is a bad thing but in actuality the tweets could be people tweeting about how they hating Muslims. My word cloud suggests ideas that I would assume would come up when discussing Islamophobia.
I chose to look at the terms city, muslims, s_t_o_p_terror, prosecuting, and realdonaldtrump. I chose the term city because it other then Islamophobia it was the second word used most, 4,215 times. I chose realdonaldtrump because his new policies are directly affecting Muslims not only in America but all over the world. For this reason, I also chose the term muslim. The other 2 terms just seemed interesting to me which is why I picked those ones. Looking at my line graph, the terms s_t_o_p_terror, muslims and city a line that follows the relative same trend. The word city peaks higher than the other lines. This term peaked on February 28. I am not sure why this term peaked on this day. After having searched Google, I found that one possible reason for this spike on February 28th could be because Michigan agreed to be a “safe haven” for refugees. The term realdonaldtrump peaked on February 25 and maintained a steady line after this day.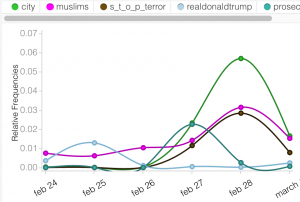
http://voyant-tools.org/?corpus=23e6bb486b18d250df518de127c0c3f8&stopList=keywords-b9c1bb932d35e006a29e23d3102a3c98&panels=cirrus,reader,trends,summary,contexts
For my document, I chose a paper written by Cabili Diana Mae titled “Islamophobia in America”. I chose this paper partly because in the abstract she writes that she Time article about whether America had a Muslim problem. I like her have had a peaked interest in Islam through looking at articles in the media. Even though this paper was written in 2011, it is is appicable today. For this paper I had to add the words Cabili, http, and like to my stopword list after looking at the initial word cloud. These were the only words I had to remove because the rest applied to my topic.
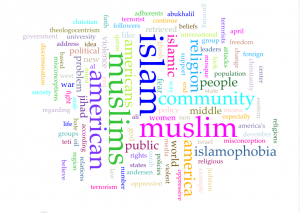
I feel like this paper has some similarities to my data set but at the same time this is an academic paper about the general topic of Islamophobia so it feels more informative rather my Twitter data. The article’s word cloud and my Twitter data word cloud both have words such as fear and hate which is not surprising. I do not think that this article helps me interpret my Twitter data because tweets are more personal opinions and the article is more factual.
Tufte’s believes that if data sets use “superior methods” then the data visualizations will be precise while Yau understands that data is try to represent life and “life can be complicated” and understands that data visualizations can be used to make conclusions if you have a good understanding of the context. I believe that Yau’s ideas on data visualization because I think the context of the data is important. While looking at my word cloud I was able to see which words were most commonly used. By knowing what words were being talked about most in association to Islamophobia, I was able to gain context behind why these words were being used through looking at what is happening in the news. I believe that context is important when it comes to interpreting data and allows for a better understanding of the larger picture.
Works Cited
Tufte, Edward R. 2011. “Visual &Statistical Thinking: Displays of Evidence for Making Decisions.” In Envisioning Information, 27-54. Cheshire, CT.: Graphics Press.
Yau, Nathan. 2013 “Representing Data.” In Data Points, 91-134. Hoboken: Wiley.
Cabili, Diana Mae. “Islamophobia in America.” Community List. University of South Florida St. Petersburg, 09 May 2011. Web. 03 Mar. 2017.
Hi Caroline. Right off the bat, I was intrigued to see that you had almost 100,000 more total words than I did for #whyimarch. However, the ratio of unique words to total words was much lower than mine.
From looking at the image of your visualization, I was interested to see that Michigan was one of the bigger words in your data set. I do not know much about the islamophobia movement, and I was curious as to why Michigan would be a term that was used 2128 times! Do you know why Michigan is used so often in correspondence to #islamophobia? This could be something to consider looking into in your analysis.
Your post opened my eyes to the mystery of the context behind these words. The visualization shows many words that you and I both can assume the meaning behind, however without the full context of the tweet, we are not entirely sure. This made me think back to Yau’s approach on visualization and how when more context is given, the more meaningful the data is. The tweets are given on the website, but when one only sees the word visualization, it is hard to say there is any context behind the language. It would be more meaningful, in Yau’s eyes, to add a screenshot of the specific tweets with the most common words used highlighted next to the data visualization image.
Caroline, I thought that this was another insightful blog post. Given that your hashtag topic is islamophobia, I as well, was not surprised that the most frequent words in your word cloud were islamophobia, city, muslim, mosque and ban. I had a very similar turnout in my word cloud where I expected to see most of the words that turned up in my word cloud, such as obamacare, healthcare, and repeal. I liked the amount of words you chose to have in your word cloud because it 100% represents your data in a better way. You must have had to do a lot of organizing to get rid of all the unnecessary words so good job with that; your word cloud looks great. I regret that I chose to only include 45 words in my word cloud because I don’t feel like my whole data set is represented fully. I thought that you had a very interesting trend map and I thought the words you chose were great words to compare trends for. I thought that the word clouds for your data and the article appeared to be very similar, so I understand why the article didn’t help you interpret your data differently. Unfortunately I had the same outcome when I compared my two word clouds.
Similarly to Katherine’s comment, I was curious why the word Michigan was in your word cloud. This is something you can look into further, and even look into the issues with islamophobia in each state! I had a few words that I did not quite understand the meaning/relationship with Obamacare, so I want to do further research on these words and their relationships to Obamacare.
I know it’s none of my business, but I appreciate how hard you work on your posts, comments, and classwork. Danny, you are the light in the darkness, the north star of our class. Keep on keeping on my friend, I hope that one day, long after this semester has passed, we can embrace again at the table of brotherhood. Also good post Caroline, I know that many in the class consider you to be the dearest daughter of data, a divine data driver.
Tim, it means so much to me that you took the time out of your busy day to read my post. I hope you have a wonderful break. See you back in class in week to collect more data.