
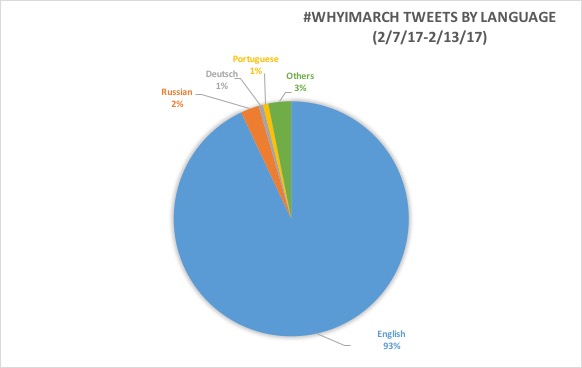
I have 24 languages in my #WhyIMarch dataset, including the following: ar, da, de, el, en, en-gb, en-GB, es, fr, he, hu, id, it, ja, ko, nl, no, pt, ru, sv, th, tr, zh-CN, zh-tw.
After typing the =COUNTIF formula into Excel, I found that there are 4183 tweets in the English language. The total number of tweets in my data set is n=4498. This means that about 93% of my tweets are in English! I also found that about 2% are in Russian, 1% Portuguese, and 3% in other languages.
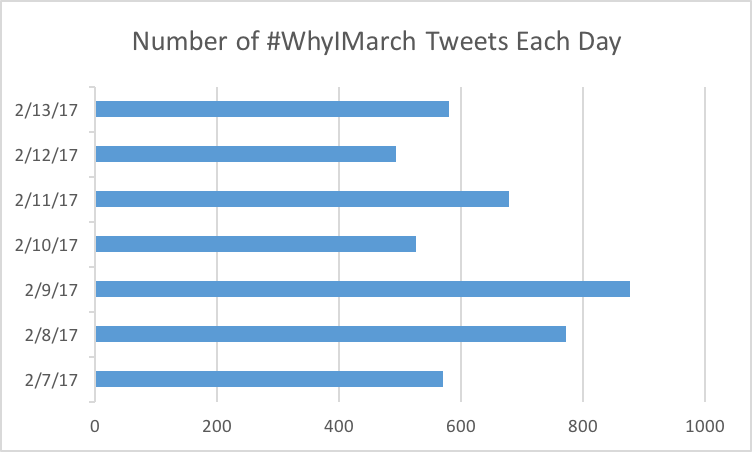
From this chart I created using the archived tweets on excel, I found that the most tweets using #WhyIMarch were tweeted on 2/9/17, which was a Thursday. I chose this period of time originally because there was an article released on February 6th in The Guardian, which announced a second women’s march to occur on March 6th. The week of February 6th was still very soon after the first women’s march on January 21st, so many people were still very heated tweeting about #WhyIMarch. With the announcement of a second women’s march, many people tweeted even more than before. Especially on Thursday, February 9th, because it was a chance to tweet before the weekend and encourage followers to join them in any sort of women’s rights gathering that may occur over the weekend. There are more tweets overall during the week, because people are either at work or school, on their computers or their phones tweeting with time to tweet. The number of tweets decline over the weekend because people are preoccupied with activities and are out doing things instead of tweeting about it.As I mentioned in Lab 4, it makes sense that the greatest number of tweets is a few days after the announcement was released, because by that time the news would have been able to travel around to more and more people.
When I searched Google during the week of 2/7/17-2/13/17, I found many interesting articles which help explain what I see on the chart. On February 13th, there was an article released on MSEA Newsfeed about another women’s march on March 13th. Similar to the article in The Guardian, this sparked more talk on twitter using #WhyIMarch, to rally people to attend the next march and make it even bigger than the first. Another reason why the number of tweets are significantly greater on February 9th compared to the rest is an article released by the official Women’s March website. This message is asking users to specifically tweet in order to get the word out about Senator McConnell being silenced! This must have reached many users who then followed the directions and tweeted the letter along with the #WhyIMarch hashtag.
When I completed my lab, not everyone had posted their data. That being said, I was able to compare my data with about half the class and my mean is one of the middle values. There are means in the 2,000 and 7,000 range, but there are also means in the 200-500 range. My mean, 642.43, is about the middle of the means that are shown. The same goes for the median of my results. 580 is about in the middle of the other medians. However, I was curious to see that Bush and Ogan had the same Mean and Median for their data, 2,000 and 7,000. We all got N/A, except for Quarls which does not say much about our data. Ogan’s hashtag, #climatechange, explains why his mean is so large. #Climatechange is a universal hashtag, which most people use all over the world, where as most of the other hashtags, including mine, have to do mostly with America.
The count of my data is 4497, the max is 877, the min is 493, and the range is 384. Compared to others, I had the higher number of tweets counted. I wanted to choose the week of 4/7/17, so I chose the number of tweets based on those days, not based on limiting myself to a number. My data had around the same amount of tweets per day, some more and some less, but for the most part there were no extreme days. I found it interesting to look at Bush’s #transgender results to see that there was a total count of 4019, and a max of 3061! That means that there was one day where the majority of people tweeted. I wonder what happened on that day!
I found it intriguing to look at the data results for each hashtag together on the google doc. It is the most interesting for me to see all of the percentage of tweets in English for each hashtag. I originally assumed that hashtags like #climatechange would have a lower percentage of english, since that is a major issue around the globe. I was also surprised to see that #transgender had only 54% of tweets in English. That means that people around the world who speak other languages are still using the english word in their tweets, which shows the strength of the word. I enjoyed being able to compare my data with others in the class during this lab.
Hi Katherine,
I loved reading your final post for this class and can not wait to see your final presentation. I did the same thing as you with the languages and did not type them all out fully. After having looked at Danny’s post, I wish I had typed out the languages. I find it very interesting that 2% of your tweets were in Russian and I wonder why that is the case.
I really like that you explained why you chose to look at 2/9/17. I really enjoyed your explanation about why you think the majority of the tweets were on 2/9/17. I agree with your explanation. I was not able to find that much interesting information in the news that correlated with my topic so I am jealous that you had so much information.
I really loved reading your posts this semester.
Thanks
Katherine Kelter, another great post!
I mentioned this in my comment on Caroline’s post, but I think that your pie chart would be easier to understand if you converted the languages from the dataset to their actual name. I think that it is pretty incredible how 93% of your tweets are in english. I had a very high percentage myself and due to the fact that all three of our topics are current political issues, it makes sense why there are so many tweets in English. I also had pretty similar data when it came to the mean/median/mode/etc. number of tweets per day. I liked the articles you chose that may have explained why a certain day had more or less tweets than any of the other days used in the dataset. Nice job!