
All of my labs provided me the opportunity to view the same data differently, each visualization offered a fresh new look. Some were definitely more helpful than others for interpreting data. For the Mapping lab I realized that mapping the data could have been much better but unfortunately there were not many tweets that had geolocations tagged onto them, so I was only able to map a handful of tweets. Ideally if all my tweets had geolocations included, then I could have been able to see which areas of the US tweeted most frequently using my hashtag. This would have given me a better idea of which areas are more in favor of President Trump. With my limited geodata, I was still able to track some tweets to the east and west coast of the country, and a few more in the south. I did not find words per day chart helpful because not much happened during my week of word tracking. It could be very helpful though, if I was interested in a specific event across a specific time period. I tracked the words white, americafirst, and attorney. My language pie chart showed me that nearly 90% of the tweets using my hashtag were in English, and the other languages made up the last 10%. This was really unsurprising so I did not pay too much attention to it. It did confirm my belief that most tweets would be from Americans and other English speaking countries. The tweets per day chart did not help me too much, but it does offer a look on tweet frequency per day. If there had been large spikes and drops, then this would have been a more helpful visual, but my tweets/day were pretty consistent.
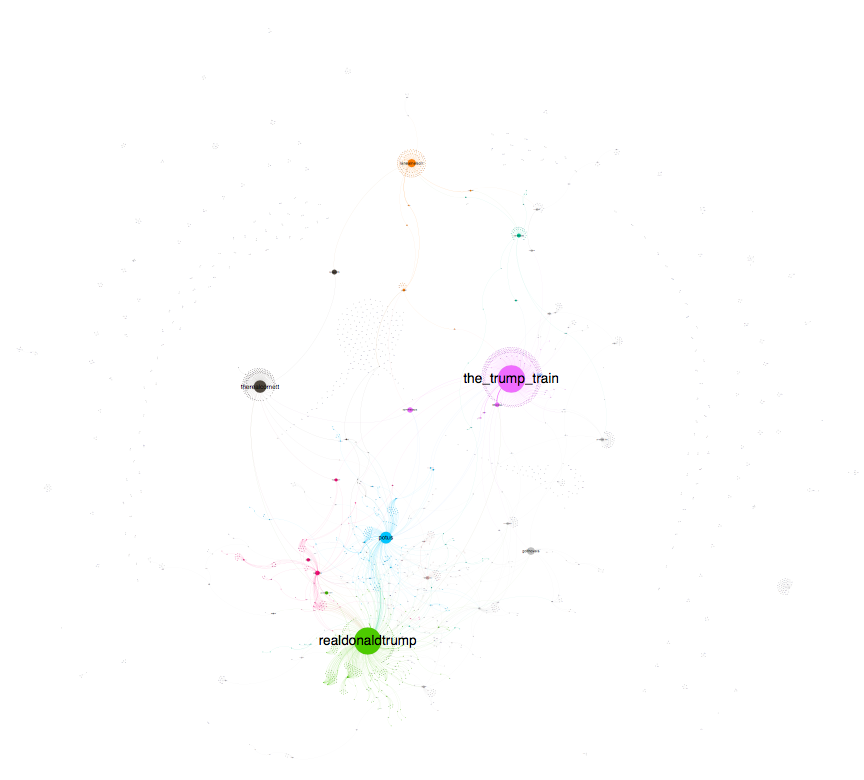
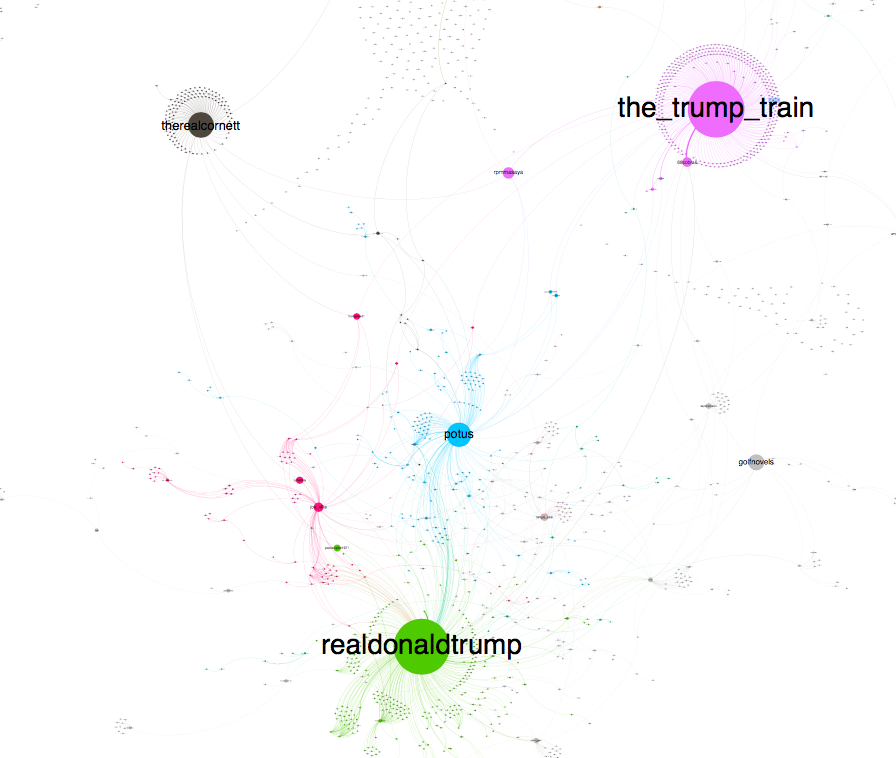
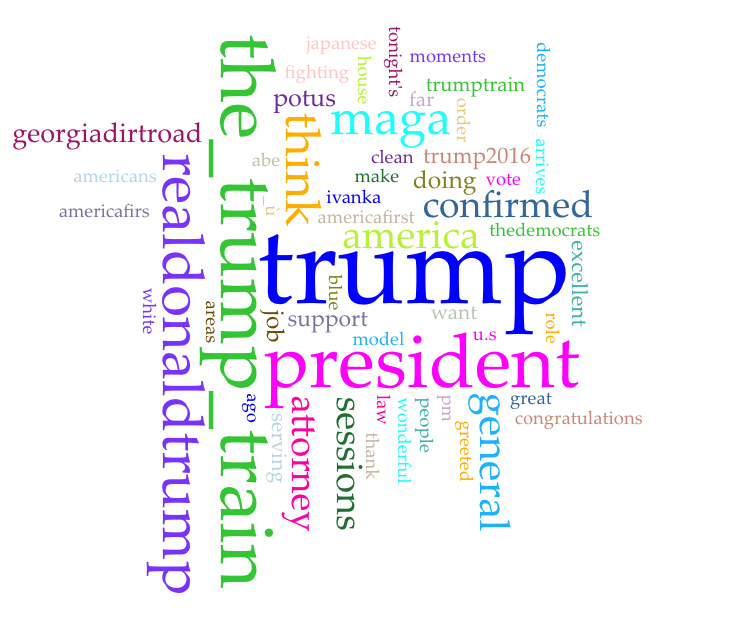
My two favorite (and most helpful) visualizations were the wordcloud and the SNS analysis. Using the Word cloud was very helpful for me. This is an amazing resource for one trying to analyze twitter data and get a good idea of what the people are saying. By making a visualization of the most commonly tweeted words I can get a better grasp of the content of the tweets that make up my data. Using this visual, I was able to see that the majority of users tweeting with my hashtag were either retweeting the big Trump accounts or tweeting positively towards our president. Using SNS Analysis was a real joy. This was one of my favorite visualizations. First it looked amazing and second it offered incredible insight on how the community was connected. It showed that my hashtag tweets were focused on 3 large points and 2 smaller points. There was very little communication between my big points. I think that doing an SNS analysis is very important for anyone trying to analyze a large dataset. Lastly it is important to note that compared to my group members, my visualization looks very different. My points are very spread out and they do not communicate much, but Jennifer’s visualization was much tighter together.
My big takeaway from my data collection is that there are a lot of unheard Trump supporters that escape our filter bubble. A huge problem with the political parties in the United States is that there is very little back and forth between Trump supporters and Trump protesters. My data shows clear evidence of the existence of Trump supporters that openly praise our president and love his decisions. Just like our filter bubble missed the large amount of trump supporters, my hashtag tweets miss all the Trump protesters and only show the prevalence of Trump supporters. Both sides here are blind to the other, and because of this, there can be no dialogue between sides.
OUTLINE:
Title slide: #MakeAmericaGreatAgain by Tim Peng
Hashtag slide: This is a great hashtag to look at because it looks at how people are using Trump’s slogan. We can also look at the prevalence of the hashtag and how many people are tweeting using this hashtag.
Key findings based on WordCloud: Nearly all the words in the wordcloud for #makeamericagreatagain are very positive. Some examples are: excellent, great, congratulations, support, job, think, want, thank, wonderful. The other prominent words are Trump, president, and then the names of the big twitter accounts that support Trump.
Key findings based on another data visualization: there were 2 big dots, and 2 smaller but still big dots, and then one smaller dot. Big dots were: @The_Trump_Train , @RealDonaldTrump. Smaller big dots: @TheRealCornett & @lanealnelson. Lastly the smallest of the bigger dots is @POTUS. The visual also shows me that the significant dots don’t seem to be communicating with eachother. The 2 biggest dots barely talk at all, but they both are connected to the @POTUS account.
My main argument:
I am going to use my SNS analysis and word cloud to make a point: We are blind to people who have different views from us
All my visualizations point towards the fact that Trump supporters are out there, and voicing their opinions publically. Why don’t I see them though? According to my SNS analysis, there is an entire web out there of Trump supporters. Could be considered an invisible web…
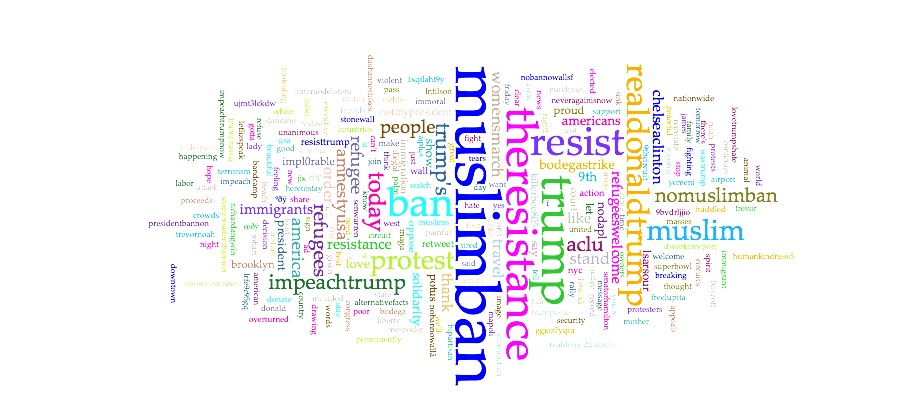
Also going to use JTran’s word cloud to show negative trump tweets then compare it to my Pro Trump word cloud (slide showing both images and comparing them)
Her main words are resistance, resist, noban, impeach, etc.
Reference to the article about why Trump won and we didn’t see it coming
–surrounding ourselves with people who agree with us
–The filter bubble is set up so that we never see things that we disagree with
–Facebook’s algorithm has written into it a code that makes us see more of the stuff we click, and we usually click the stuff we agree on
Here are the images I’ll be using…
citations:
Baer, D. “The Filter bubble explains why trump won and you didnt see it coming” (2016). NYmag.com
Tran, J. Wordcloud. 2017
Tim, I used the same graphs as you in my analysis and developed a different point instead – that Twitter users use my hashtag to criticize Trump. Since we have different arguments due to the different uses of our hashtag, I am excited that you are comparing your word graph with mine. I might consider using your graph as well or mentioning the contrast of it to mine in my presentation.
My SNA graph was highly connected – I think that you should think about implications of an extremely connected graph in relation to a disconnected graph to make a stronger argument about the filter bubble. For hashtags whose users are well-connected and talk to one another, does it mean that they are still closed off from seeing tweets that conflict with the viewpoints? Or are they still in the filter bubble but try to gain attention from the opposing side? Or some other reason?
Tim, I am curious to see how you develop your argument about the SNA graph. It was really interesting to see how disconnected the graph was. For your word cloud, you could maybe talk about how conservative your tweets were and some reasons behind it since Twitter is usually seen as a liberal social media site. Can’t wait to see your presentation on Monday!
Rather than thinking about these tweets “escaping our filter bubble,” perhaps these tweets are their own filter bubble? Great step-by-step breakdown!
SNA = social network analysis.