
I chose the first 3000 tweets I collected since the data set seemed very active at that time and it was toward the beginning of the hashtag’s creation. I am interested in finding the original connections between users of this hashtag, so I chose an earlier set of tweets.
Using extraction type 1, I expect to see a broad network of connections between individual accounts using the hashtag. In other extraction types which focus solely on retweets or non-retweets, a different type of interaction can be observed, but in extraction type 1, the interactions being collected will be less specific.
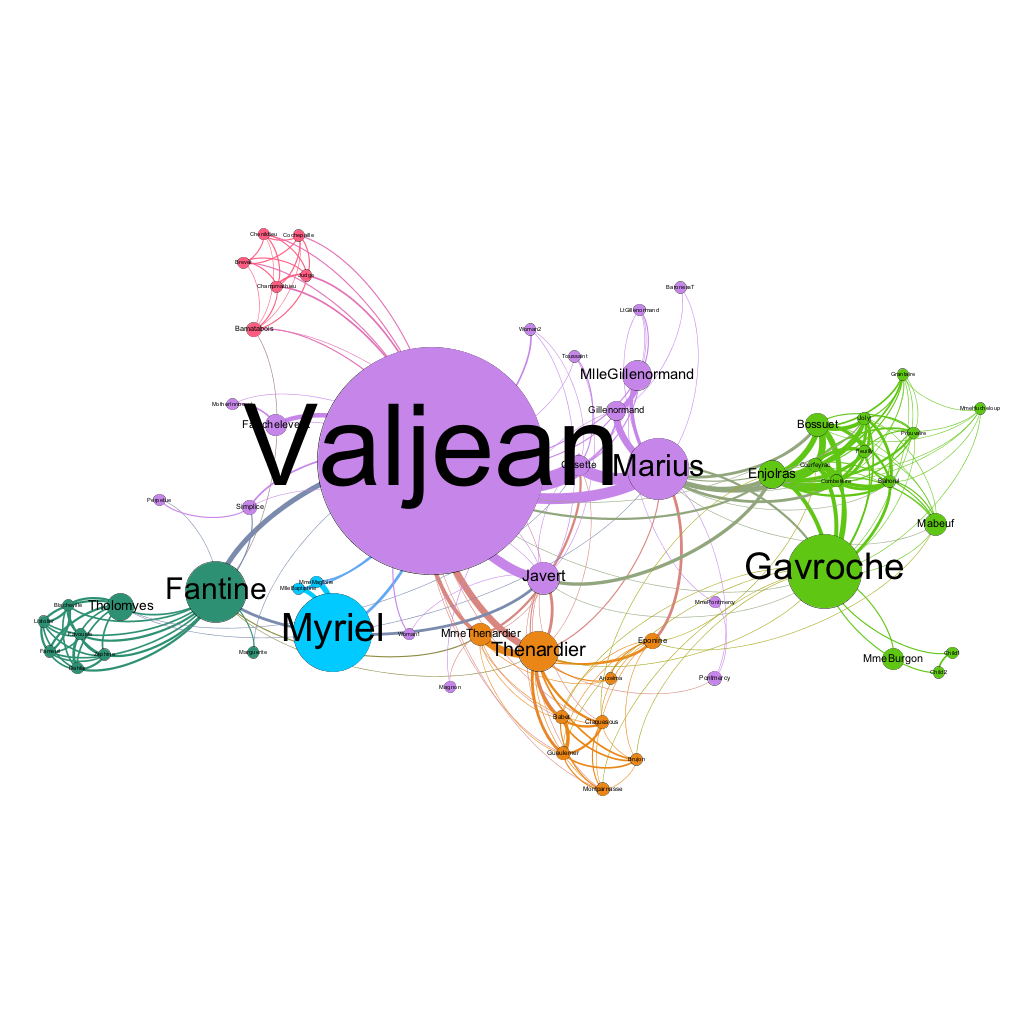
My file has 77 nodes and 254 edges. It would be more useful to choose a “directed” graph instead of an “undirected” graph because it will demonstrate the meaningful connections between characters instead of any vague connection between characters that could be recorded.
Valjean’s ID is 11. He acts as the source in interactions with 0/Myriel (13 times), 2/MileBaptistine (12 times), 3/MmeMagloire (11 times), and 10/Labarre (10 times). He acts as the target for characters with ID numbers 12, 13, 14, 15, 23, 24, 25, 26, 27, 28, 29, 31, 32, 33, 34, 35, 36, 37, 38, 43, 44, 48, 49, 51, 55, 58, 64, 68, 69, 70, 71, and 72. Since he is the main character, he has an enormous amount of interaction with other characters.
Fantine (ID #23) is the source in interactions with 11, 12, 16, 17, 18, 19, 20, 21, 22. He is the target in interactions with 24, 25, 27, 29, 30, and 31.
By increasing the repulsion strength the connections between characters became more dramatized to emphasize the difference in relationship more than a tinier, squished graph would have been able to do.
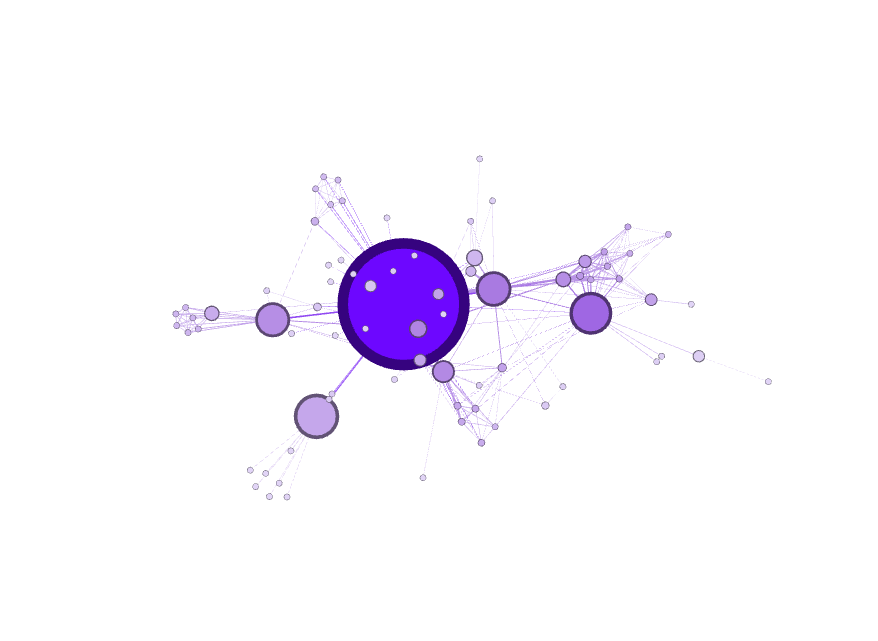
The large circles represent characters based on their level of interaction with other characters. The largest, darkest circle most likely represents the main character since he had the greatest number of interactions with other characters. Each individual circle or node has its own network of connections.
 I picked the largest repulsion strength option, 10,000. As I created my graph, my goal was to dramatize relationships, making connections as obvious as possible.
Network Diameter: 3
Average Path Length: 1.397
Modularity: 0.881
Connected Components: 444
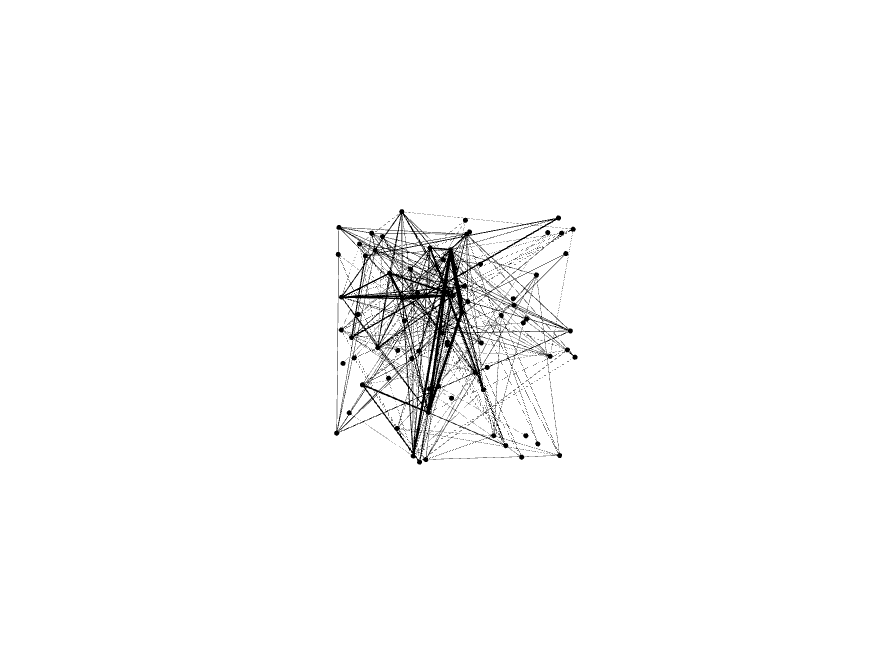
I used “Degree” and set my min as 10 and my max as 40. I let my data run for about 10 minutes.
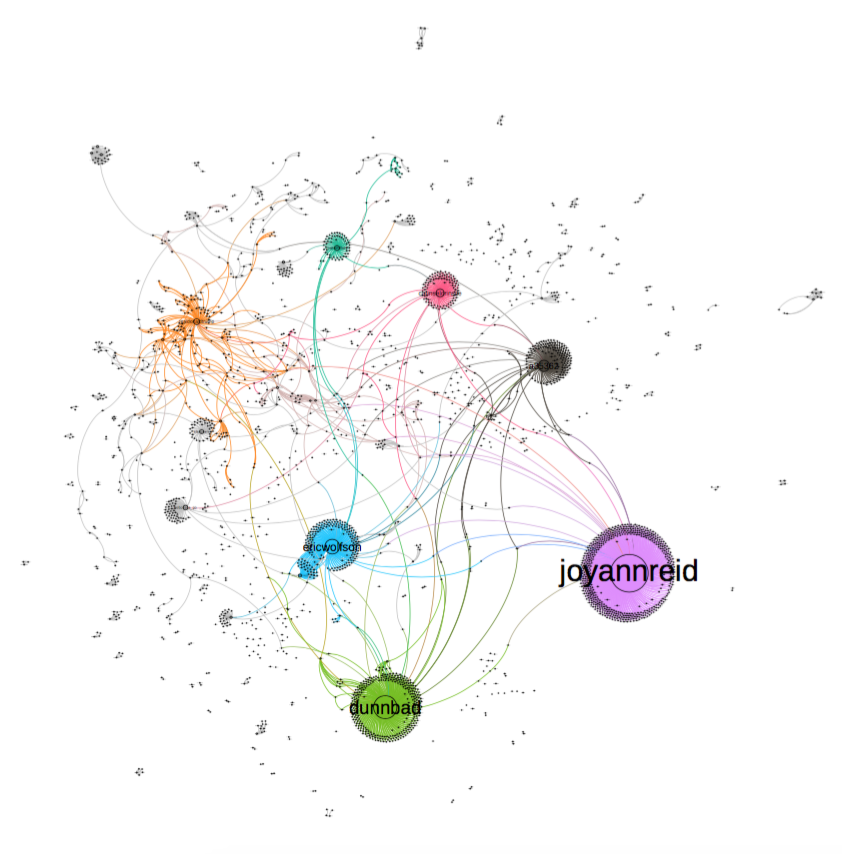
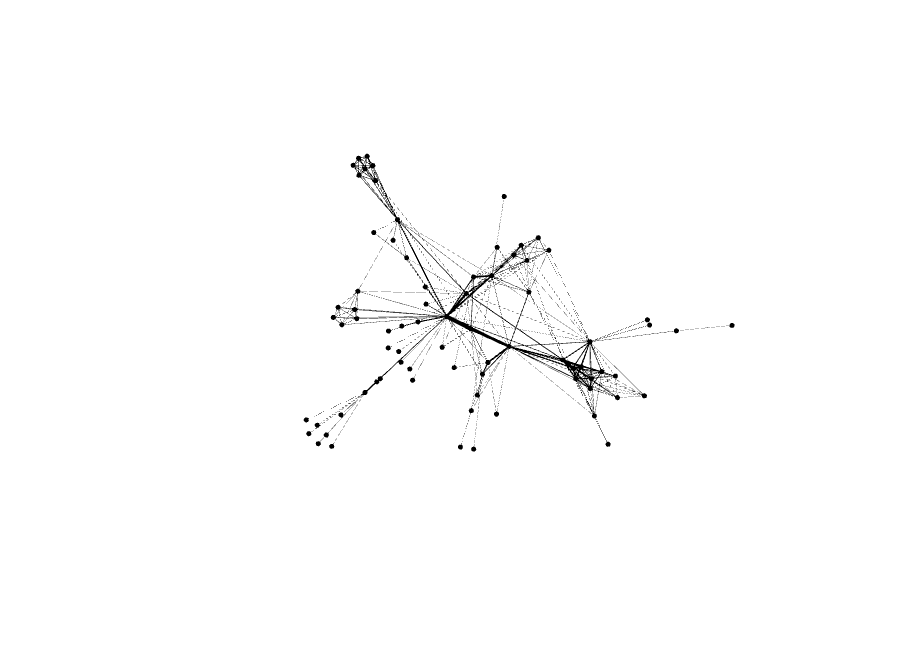
Above is my first run. Later, I ran it again and created the graph below.
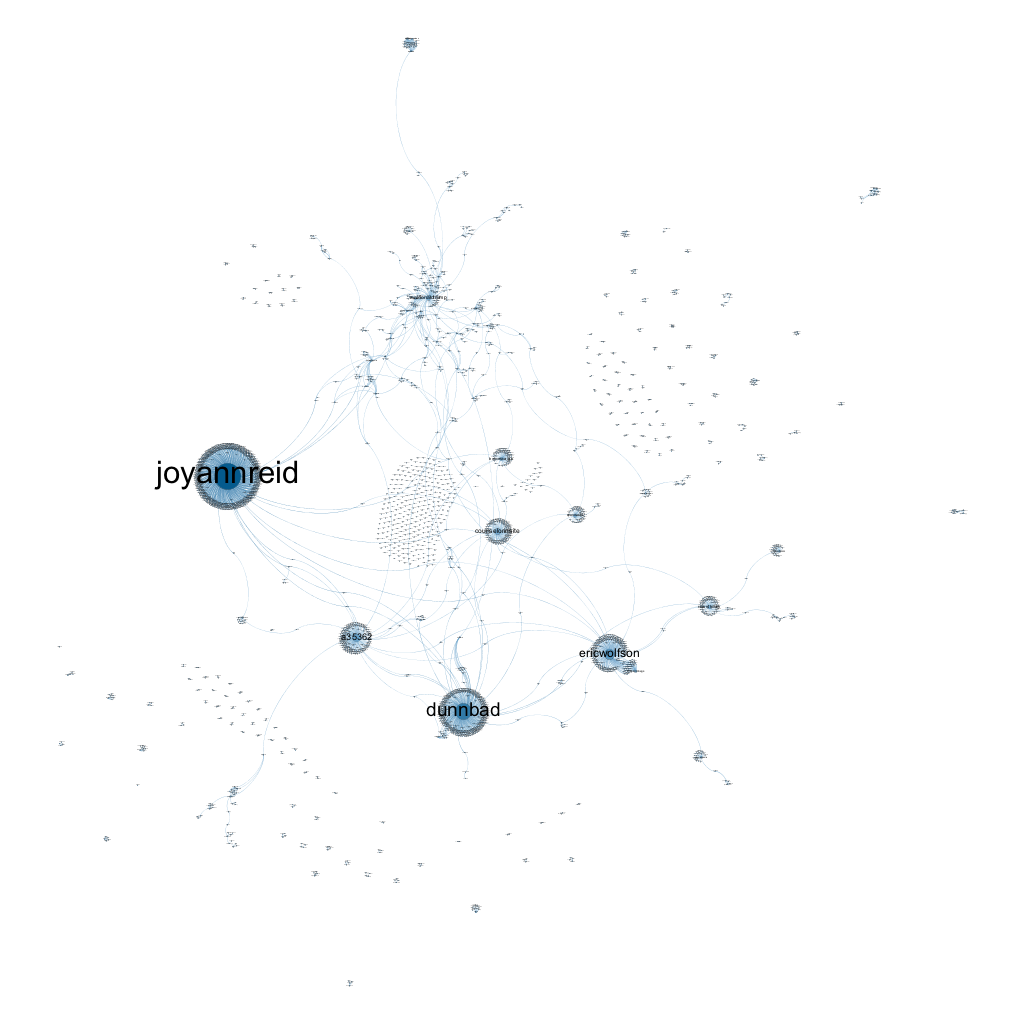
The largest names on the graph all tended to be activists working with organizations or campaigns, with one exception, which would be @realDonaldTrump. I expected the hashtag #ThisIsNotNormal to be used within the len of activism, so this did not surprise me.
Since this hashtag was not based on one event, one campaign, or one focus, the networks of connection was more difficult to analyze. Each individual seemed to have one issue they were tweeting about which attracted its own network of retweeters and repliers as I looked through the tweets from different users represented on the graphs. This is what I expected: I assumed each section of the graph would represent a different conversation, such as the Muslim Ban, Russia’s ties to the election, and other issues.
I chose the first 3,000 tweets I collected because I was hoping to see a large amount of connection and conversation around the Muslim Ban issue, and I started collecting data right after the entire issue exploded, but it turns out that conversation about the Muslim Ban was not any more common than any other conversations during this time period. This shows how broadly this hashtag has been used. I originally chose the hashtag because I was seeing it alongside the issue of the #MuslimBan a lot, but I now wonder whether the Twitter algorithm was showing me a larger proportion of #MuslimBan tweets than any others because it was an issue I was partially using Twitter to follow.
Your data is very fun to look at. I wonder what it would look like now after the Syria bombings because it was such a controversial decision. I have seen many tweets regarding Syria and #thisisnotnormal and I think it would be interesting to see how much it would change or if it would change at all.