When Puerto Rican and South Bronx native Angel Perez was in high school, he didn’t think he would get to go to college because of the cost. Today he is a doctor of education and the Vice President for Enrollment and Student Success at one of the most selective institutions of higher education in the United States. Yet, not all Pell Grant recipients ended up like Angel. While Angel was one of the lucky students who was able to succeed with the help of the Pell Grant, not all Pell recipients had such luck. This leads me to question, what were the original goals of the Pell Grant, and overtime, what have been the intended and unintended outcomes of it which affect students?
To address the first part of my question, I argue that the original goal of the Pell Grant was for qualified low-income students to attend postsecondary institutions without financial burdens. The Federal Student Loan program was created the same year as the Pell Grant, in the same federal legislation, the Higher Education Act of 1972 was created. The federal government created the Pell Grant so low-income students would not have to take out loans from the new loan program. For the second portion of my question I argue that, the intended outcomes of the Pell Grant affecting students are increasing low-income student post secondary enrollment, and the unintended outcomes, have distinguished high graduation rate institutions from low graduation rate institutions, increased political support for the Pell grant, and increasing student.
The federal Pell Grant was first implemented in the Higher Education Reauthorization Act (HERA) of 1972, and originally called the Basic Educational Opportunity Program. It is a federally subsidized grant that allows people to attend institutions of postsecondary education, without having to pay the government. The Pell Grant functions similar to today, where there is an income-eligibility standard that can change. The grant aid is determined by collecting data on student family income and assets, cost of institution, and “intensity of enrollment” (Baine and Mulin 2011, 6). Intensity of enrollment translates to whether a student is enrolled in the institution as a full time, or part time student. The federal Pell Grant’s original goal was to financially provide a consistent medium for college-ready, low-income students to attend postsecondary institutions. The actual text of the Reauthorization Act of 1972 that implements Pell reads:
providing basic educational opportunity grants… to those students of exceptional need who, for lack of such a grant, would be unable to obtain a postsecondary education (Higher Education Act 1972, U.S. Congress).
Thus, the original goal of the Pell Grant in 1972 was for qualified low-income students to not only actually attend a postsecondary educational institution, but reap the various benefits that came with a college degree or program certificate. The federal government’s website with information about the Pell grant, pellgrantinstitute.org, describes it as the “the federal floor of support for needy students”, since its inception (Pell Institute). The CollegeBoard describes the Pell Grant’s original goal as “a central idea to provide the funds disadvantaged students needed to make it possible for them to enroll in college” (CollegeBoard Policy and Advocacy Center, 2013, p. 9). This interpretation of the 1972 Pell Grant goal aligns with the interpretation of various researchers and scholars including Cervantes, Creusere, McMillion, McQueen, Short, Steiner and Webster in Opening the Doors To Higher Education: Forty Years of Opportunity, (2005) to define the purpose of the grant as a medium “to give students a predictable, guaranteed foundation of federal support” (46) . Thus, the direct text of the HERA, describing the purpose of the Pell Grant and the interpretation of it from various researchers shows that originally the Pell Grant’s goal was to simply provide a stable monetary source that low-income students could use to attend a postsecondary institution.
The goal of the Pell Grant has intentionally provoked a rise in low-income student enrollment in higher education institutions throughout time. Various reports support these claim through statistical analysis. The CollegeBoard has reported an increase in high school graduates enrolling into an institution of higher education since 1972. In 1972, 49% of all high school graduates were enrolled in a college or university, compared to more recently, 2010, in which 68% of all high school graduates were enrolled in college (CollegeBoard Policy & Advocacy Center, 2013, p. 9). The U.S. Department of Education, Office of Higher Education substantiates this increase in undergraduate student enrollment in their 2006-2007, Federal Pell Grant Program: End of Year Report. Below is a detailed chart explaining the increase in college enrollment throughout time, since the Pell Grant’s inception in 1972.
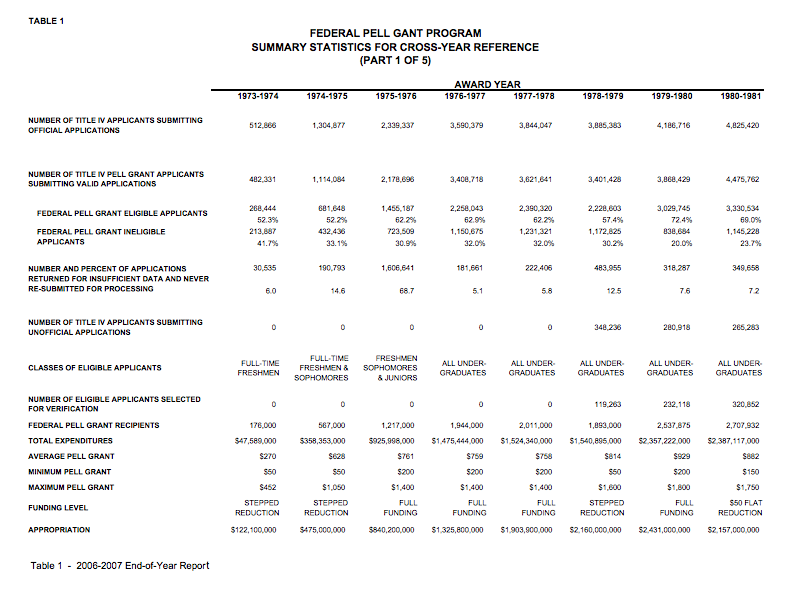
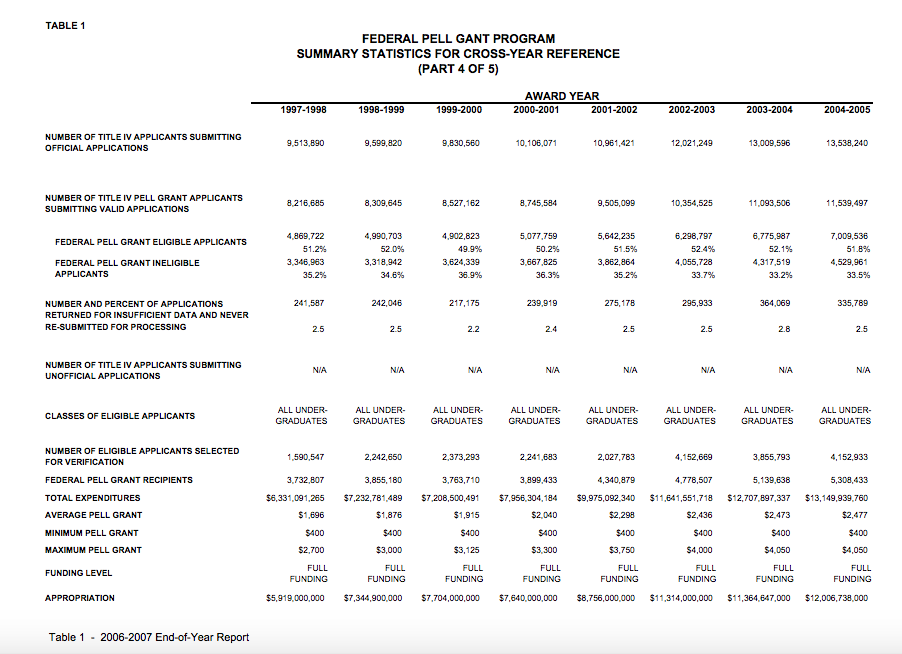
As Table 1 and 2 show, there was an increase in both number of Pell Grant applications and eligible Pell Grant applicants, from from 1973 to 1981, from 1981-1997 and overall from 1973-2005 (Department of Education 2006). I use “valid Pell Grant applicants” as a proxy for students enrolled in postsecondary institutions of higher education, because one of the requirements for a legitimate Pell grant application is official confirmed status of enrollment in a post-secondary institution. Thus, there was an overall increase of 11,057, 166 people in postsecondary institutions, throughout time from 1973 to 2005. This information shows an intentional outcome of the Pell Grant, a spike in post-secondary enrollment.
On the other hand, an unintentional outcome of the Pell Grant throughout time has been the distinction between institutions of high graduation rates and lower graduation rates. According to the Advisory Committee on Student Financial Assistance, the greater the number of Pell recipients and institution serves, the lower the overall graduation rate of that institution (Advisory Committee Student Financial Assistance, 2013, p. 3).
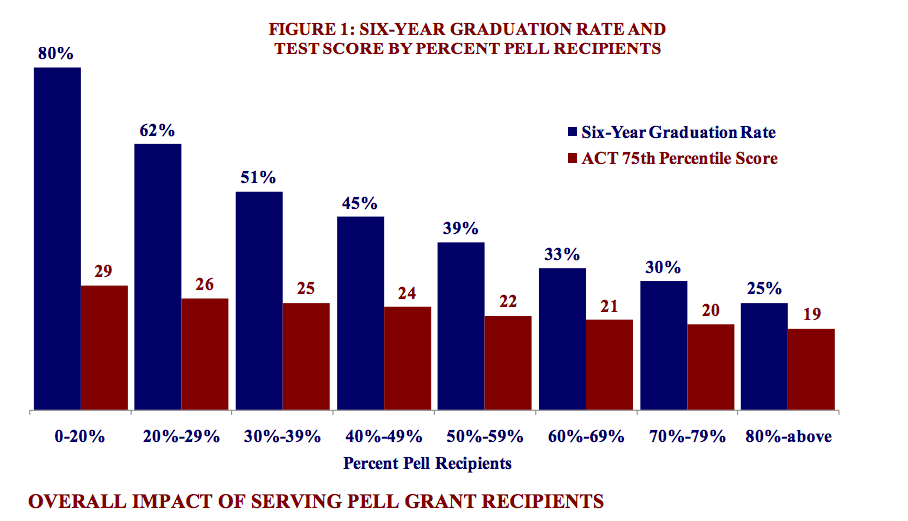
As the bar graph above shows, the lower the percent of Pell recipients at postsecondary institutions, the higher the graduation rate. In a 2013 study, The Integrated PostSecondary Education System (IPEDS) defined graduation as completing the degree, program or certificate of a post-secondary institution in six year or less (Integrated PostSecondary Education System, 2012). A year later in 2014, the CollegeBoard came to a similar conclusion when it posted a report on specifically institutions of higher education titled, “Four Year Graduation Rates and Pell Grant Representation for Four Year Colleges”. In the report, the colleges and universities with higher graduation rates (above 70%), had a lower percentage of Pell recipients, as shown in the figures below:


While these figures only represent some colleges and universities in just California and Kentucky, the full report generally showed fewer Pell recipients in institutions of high graduation rates. It should also be noted that these numbers are not representative of the factors that Pell recipient work ethic or intelligence. Rather, Pell recipients graduation are affected by a variety of factors that negatively affect their graduation rate. According to the Project Officer of the National Center for Education Statistics, Thomas Weko, that many Pell recipients face certain life factors that put them at a disadvantage when compared to non Pell recipients. These factors include being a single parents, working full or part time, having dependents or being financially independent. Moreover, 41% of Pell recipients had parents with just a high school diploma or less (National Center For Education Statistics, 2009, p. 5). Thus, these factors contribute to the graduation rate of Pell recipients, and overall a distinction between institutions of high graduation rates and institutions of lower graduation rates.
Increasing political support for the Pell grant is another unintended outcome of the Pell Grant throughout time. In 1978, the Middle Income Student Assistance Act (MISAA) was enacted under Jimmy Carter. The law expanded the pool of peoples eligible for the Pell grant to include middle-class students. At the time, the middle income average was $20,000, and hen the MISAA was enacted, the income eligibility was anything below $25,000, which meant “an additional 1.5 million middle-income students would be eligible for the program” (Middle Income Assistance Act, 1978). By expanding the Pell Grant to middle income peoples, there were more stakeholders in it. The Pell Grant would now cater to both low and middle income families, dramatically increasing the political support behind it on a local, state and federal level. Politicians at all levels would now need to cater to their middle classes as well. Since there was a much larger constituency supporting the Pell Grant educational assistance program, Cervantes, Creusere, McMillian, McQueen, Short, Steiner and Webster agree that helped the survival of the program (2005). Thus, as the Pell grant changed throughout time and catered to an additional demographic, political support for it, a federally subsidized grant, increased.
Arguably the most interesting unintended outcome of the Pell Grant is student debt and disillusionment. Sara Goldrick-Rab addresses this outcome in her analysis of the Pell grant in her book Paying the Price (2016). Goldrick-Rab notes that despite the 120% increase in funding from 1980-1989, the purchasing power of Pell grants have been dwindling, a stark contrast to the relative stability of its purchasing power as the Basic Educational Opportunity grant in its early years. Thus, Pell grants are covering less and less of student’s college, leaving to question how low and low-middle income students are paying the rest. While purchasing power of Pell Grants has decreased since the 1980s, more and more students are enrolling in college, 20.5 million were enrolled in 2016 alone (National Center for Education Statistics 2017). This increase merely decreases the amount of aid each student can receive. Simultaneously, the cost of college has dramatically increased, having double while adjusted for inflation, in 2000 since 1980 (Horn and Chang 2000). The numbers have only risen since then. College is riskiest for low-income families, for instance as of 1995, 77% of Pell recipients came from families whose income was less than 25,000$ (National Center Education Statistics 2007). Rab argues that while the Pell Grant was instituted “to protect students from low-income families, for whom college is already risky investment, have to take loans”, the opposite has occurred (Goldrick Rab, 2016, p. 79). This brings to question, is the Pell Grant actually disillusioning students on college? Due to the incredible increase in college costs, and the low purchasing power of Pell grants, students are taking out loans and falling into debts. These debts sometimes even reach six figures and are often financed with minimum wage jobs despite Pell recipients’ bachelor’s degree. From 1990-2000, 87% of Pell recipients had to borrow money to afford college, and their average loan was $18,500 (National Center for Education Statistics, 2009, p. 7).The number of Pell recipients taking out loans has grown dramatically, having increased 30% from 1996 to 2012. Over 40% of Pell recipients have taken out federally subsidized loans. Furthermore, because students find that they need to balance two to three jobs with five courses and a club, they don’t even end up graduating from college. Goldrick-Rab questions if the outcome of Pell grant goals are worth it in today’s increasingly expensive world, she asks, “Is the Pell program a sound financial investment in the nation’s future, or is it a wasteful and ineffective program that allows students access to money- perhaps even enticing them to attend college and incur debt-without ensuring they graduate from college?” (Goldrick-Rab, 2016, p. 68).
The Pell Grant started off as a federally subsidized grant with the intention to help students attend postsecondary institutions in order to reap its benefits. While it succeeded in increasing low-income student presence in these institutions, it had several unintended outcomes, some of which have actually been very detrimental to the very students it wanted to help in the first place. While these outcomes have ultimately been influenced by the rising cost of college and issues plaguing low income families, the outcomes stated above would not have been possible without the Pell Grant. In years to come as the world of postsecondary education becomes more expensive, it is my hope Pell recipients are nonetheless able to persist and fulfill the original goals of the Pell Grant.
References:
Advisory Committee on Student Financial Assistance. (2013).“Measure Twice: The Impact of on Graduation Rates Serving Pell Grant Recipients, A Policy Bulletin for HEA Reauthorization”.
Baime, David and Mulin, Christopher. (2011). “Promoting Education Opportunity: The Pell Grant at Community Colleges”. American Association of Community Colleges.
CollegeBoard Advocacy & Policy Center. (2013). “Rethinking Pell Grants”.
CollegeBoard. 2014. “Four Year Graduation Rates and Pell Representation for Four Year Colleges”. Accessed https://secure-media.collegeboard.org/digitalServices/pdf/professionals/four-year-graduation-rates-at-four-year-colleges.pdf
Federal Pell Grant Program End of Year Report. (2007). U.S. Department of Education, Office of Higher Education.
Goldrick-Rab, Sara. (2016). Paying the Price. London: University of Chicago Press.
Horn, Laura, Chang, C., Berker, A. (2000). “What Students Pay for College: Changes in Net Price of College Attendance Between 1992-93 and 1999-2000”. Postsecondary Education Descriptive Analysis Reports.
Integrated PostSecondary Education System (IPEDS). (2012). Six-Year Graduation Rate and Test Score by Percent Pell Recipients.
“Jimmy Carter: Education Amendments of 1978 and the Middle Income Student Assistance Act Statement on Signing H.R. 15 and S. 2539 Into Law.” Accessed April 9, 2017. Retrieved from http://www.presidency.ucsb.edu/ws/?pid=30087.
National Center for Education Statistics. (2009). A Profile of Successful Pell Grant Recipients: Time to Bachelor’s Degree and Early Graduate School Enrollment, Statistical Analysis Report”.
“Text of S. 659 (92nd): An Act to Amend the Higher Education Act of 1965, the Vocational Education … (Passed Congress/Enrolled Bill Version).” United States Congress. Accessed April 19, 2017. Retrieved from https://www.govtrack.us/congress/bills/92/s659/text.
TG Research and Analytic Service. (2005). Higher Education Opportunity Grant: 40 Years of Opportunity, Opening the Doors to Higher Education: Perspectives on the Higher Education Act 40 Years Later”.
“The NCES Fast Facts Tool Provides Quick Answers to Many Education Questions” National Center for Education Statistics. Accessed April 9, 2017. Retrieved https://nces.ed.gov/fastfacts/display.asp?id=372.
“The Pell Institute for the Study of Opportunity in Higher Education — Pell Grants.” Accessed April 20, 2017. http://www.pellinstitute.org/pell_grants.shtml.
U.S. Department of Education, Office of Higher Education (2007). Federal Pell Grant Program End of Year Report 2006-2007. Showing 1973-1981.
U.S. Department of Education, Office of Higher Education (2007). Federal Pell Grant Program End of Year Report 2006-2007. Showing 2006-2007.