This essay was developed in the Cities Suburbs & Schools seminar in Fall 2013 and published in March 2014 by ConnecticutHistory.org. See other Trinity student essays.
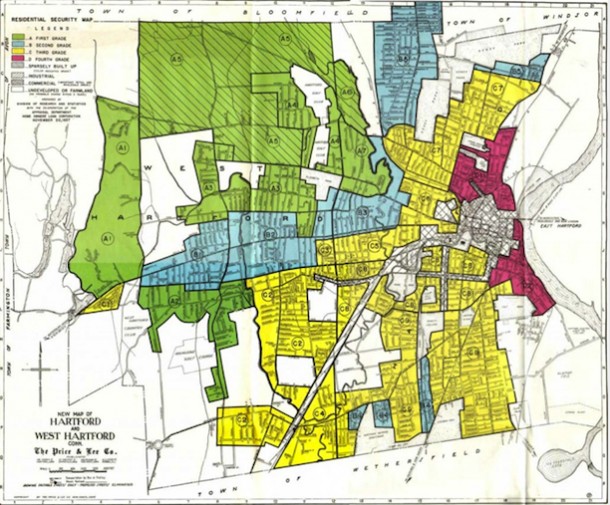
HOLC Residential Security Map of Hartford Area 1937. Records of the Federal Home Loan Bank Board, National Archives II, College Park, Maryland – On the Line: How Schooling, Housing, and Civil Rights Shaped Hartford and Its Suburbs
Contemporary patterns of racial isolation in the Hartford metropolitan region, as elsewhere across the country, stem from a mixture of historic and present-day policies. A number of past policies, promoted by both private and federal interests, encouraged racial segregation. Although these explicitly racist policies are no longer legal, research shows that their legacy often persists well beyond their termination. For example, historical data reveals long-term patterns of inequality that can be traced back to racist zoning codes of the past. Of the housing barriers that ethnic minorities within the US have faced in the 20th century, “redlining” is perhaps the most talked about—and for good reason. Redlining is the nickname given to the practice of rating certain neighborhoods as undesirable investment choices due to their racial and socioeconomic demographics. Banks then used these ratings when determining whether or not to authorize loan transactions for home purchases and improvements in those communities. By effectively directing capital investment away from “redlined” neighborhoods, this practice shaped the demographic patterns as well as the built environments of cities and suburbs across the US.
Formation of the Home Owner’s Loan Corporation: Rating Neighborhood Investment Risks
The Home Owner’s Loan Corporation (HOLC) was established through President Franklin D. Roosevelt’s New Deal Legislation in 1933 as a way to combat home foreclosures during the years of the Great Depression. The HOLC created residential security maps to assess the “trend of desirability” in residential areas of Hartford and over 200 other cities during the late 1930s. In other words, the HOLC set out to evaluate the insurance risks associated with investment in order to direct the Federal Home Loan Bank’s (FHLB) underwriting criteria and to provide a detailed guide for mortgage loan investment decisions being made by the newly regulated financial institutions engaged in home mortgage lending. The major issue is that the HOLC utilized the racial and socioeconomic composition of residents—rather than relying on physical property conditions alone–as deciding criteria for determining whether they deemed a neighborhood to be a safe and stable investment for loans. For example, a 1937 HOLC appraisal report for a tract of land near downtown Hartford describes the neighborhood as a “slum area now mainly occupied by Negros.” The appraisal also identifies the residents of this area as predominately “laborers or domestics” and estimates the average annual family income to be around $1,000. This report exemplifies the role of race and class in the HOLC rating system: the neighborhood was given the lowest possible rating (Grade D).
Relationships Between Race and Redlining in the Hartford Region
The HOLC created color-coded maps that delineated four grades of housing: green being the highest rating, followed by blue and yellow, respectively, with red reserved for neighborhoods receiving the lowest ratings, hence the term “redlining.” This mapping system became an institutionalized barrier preventing equal access to property and loans as the Federal Housing Administration (FHA) and private lenders adopted similar policies and maps in their own underwriting manuals. Thus, the use of race-based criteria to make lending decisions became a wider spread practice. For instance, in the 1936 FHA Underwriting Manual, there are references to “inharmonious racial groups” or “incompatible racial elements” being factors in the decreased ratings assigned to certain neighborhoods. Essentially, the FHA helped perpetuate the notion that the presence of ethnic minorities in a mostly white neighborhood would adversely influence property values.
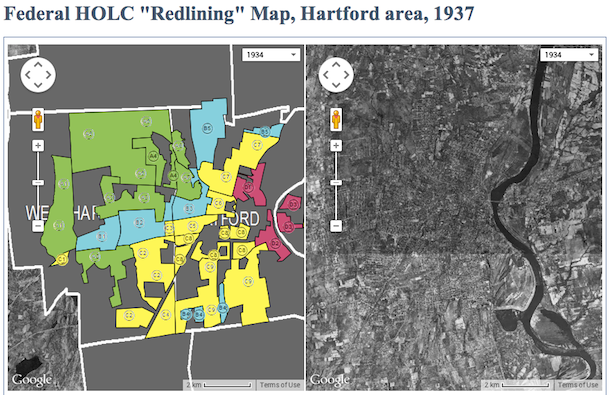
University of Connecticut Libraries, Map and Geographic Information Center (MAGIC)
When the 1937 HOLC map is compared to the 1940 map of Racial Change in the Hartford Region (below), two points become clear. First, the region was overwhelmingly white. Second, the two census tracts in Hartford with substantial black populations (tract eight and nine) were both neighborhoods redlined by the HOLC. These redlined neighborhoods were also located in slum areas. So, it is important to ask if the poor quality of the housing, rather than race, determined investment decisions. In other words, were HOLC neighborhood appraisals shaped primarily by the physical housing or by its current inhabitants? The answer is: both factors played a role; however, a comparison between two areas with similar built environments but different demographics provides evidence that a neighborhood’s HOLC rating could be negatively affected by the presence of an “inharmonious racial group.”
Through an examination of HOLC appraisal reports, it is apparent that area B-5 (North End of Hartford) and area C-9 (South End of Hartford) possessed a similar physical character in 1937. Both neighborhoods consisted primarily of two-family houses that were 15 to 20 years old, in fair-good condition, and in a comparable price range. Even the socioeconomic breakdown of the two neighborhoods was close; B-5 had an estimated annual family income of $1,800 and up, while C-9 was estimated at $1,500 and up. However, area B-5 was rated “blue,” while area C-9 received a lower “yellow” rating. This difference in rating can most likely be attributed to the racial composition of the neighborhoods. Both had a small population of Italians, but area B-5 had no black population, while area C-9 contained a black demographic, although slight (approximately 1%). One remark from the appraisal of C-9 confirms the impact of even a small African American presence: “The Negro families are confined to Roosevelt Street. Lenders suggest caution in the selection of loans.” This example demonstrates that the HOLC rating system focused as much on racial composition as it did on the physical quality of neighborhoods.
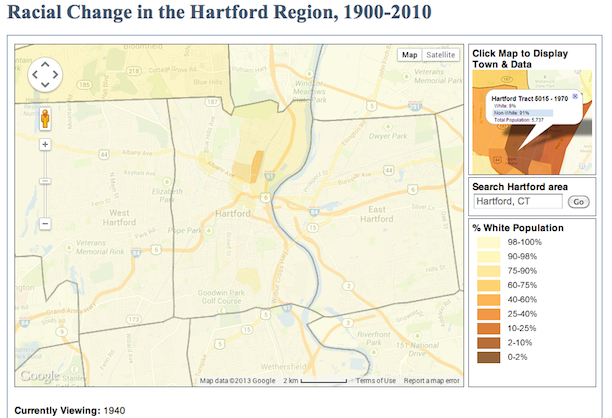
University of Connecticut Libraries, Map and Geographic Information Center (MAGIC)
The Legacy of Racialized Housing Barriers
The Fair Housing Act of 1968, which is Title VIII of the Civil Rights Act, made redlining on a racial basis an illegal practice. Yet, there is evidence that redlining continued in the Hartford region as late as 1977, manifesting itself as a systematic disinvestment of urban properties by banks and insurance companies. Redlining had serious ramifications for minorities in cities like Hartford. The racialization of space through real estate practices, along with a shift in emphasis from use-value of property (its suitability to filling social needs) to market-value (its potential to be a money-making commodity), linked property value to the racial composition of a neighborhood. New data has reinforced the fall-out caused by redlining. It shows that the neighborhoods redlined in the 1930s are now the areas of lowest opportunity in Hartford. These high poverty areas may be a result of past disinvestment caused by their having been rated in the past as “undesirable” based, in part, on racial factors. In the end, it is clear that simply outlawing racist policies of the past does not necessarily fix the damage already done.
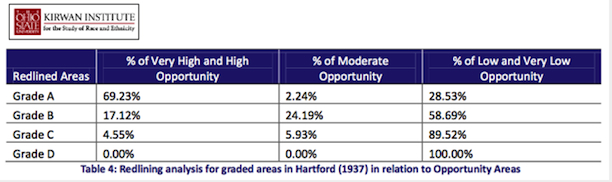
People, Place and Opportunity: Mapping Communities of Opportunity in CT
Shaun McGann, a senior at Trinity College during the 2013-2014 academic year, is an urban studies and political science major and a resident of West Hartford.
Learn more
Websites:
“Federal HOLC ‘Redlining’ Map, Hartford Area, 1937.” University of Connecticut Libraries, Map and Geographic Information Center (MAGIC), 2012. Link.
“Racial Change in the Hartford Region, 1900-2010.” University of Connecticut Libraries, Map and Geographic Information Center (MAGIC), 2012. Link.
Documents:
“Fair Housing at Its Worst: Redlining in Hartford Connecticut, Report 9.” Education/Instruccion, February 7, 1977. Trinity College Digital Repository, Hartford. Link.
“First Annual Report of the Federal Home Loan Bank Board Covering Operations of the Federal Home Loan Banks, The Home Owners’ Loan Corporation, Federal Savings and Loan Promotion Activities from the Date of Their Creation through December 31, 1933.” United States Government Printing Office, 1934. FRASER: Federal Reserve Bank of St. Louis. Link.
Reece, Jason, Samir Gambhir, Jillian Olinger, Matthew Martin, and Mark Harris. “Place, and Opportunity: Mapping Communities of Opportunity in Connecticut: A Report Commissioned by the Connecticut Fair Housing Center.” Kirwan Institute for the Study of Race and Ethnicity, The Ohio State University, 2009. Connecticut Fair Housing Center. Link.
“Residential Security Map and Area Descriptions, Hartford-West Hartford-East Hartford, Connecticut.” Home Owners’ Loan Corporation, 1937. Trinity College Digital Repository, Hartford. Link.
Books:
Dougherty, Jack, and colleagues. On the Line: How Schooling, Housing, and Civil Rights Shaped Hartford and Its Suburbs. Hartford, CT: Trinity College, 2011. Link.
Articles:
Greer, James. “The Home Owner’s Loan Corporation and the Development of the Residential Security Maps.” Journal of Urban History 39, no. 2 (March 2013): 275–296.
