A major objective of much of our lab’s work is to better understand how current invasive plant communities are impacting the coastal shrubland habitat at Knox Preserve. We know that plant invasions happen over time, sometimes many decades, but it’s very difficult (if not impossible) to observe this process happening over this timeframe. We can however, use sophisticated geographic information system (GIS) analyses of remotely sensed satellite imagery to try to gain a rough picture of how plant communities have changed over time. This is precisely what Jenna Wilborne (Trinity ENVS ’15) sought to do with her senior project. Jenna set out to use remote sensing analysis to quantify changes in the coastal shrubland at Knox Preserve over the past two decades, and her project was a lesson in perseverance. In the end though Jenna pulled together a great project, which I will let her further explain:
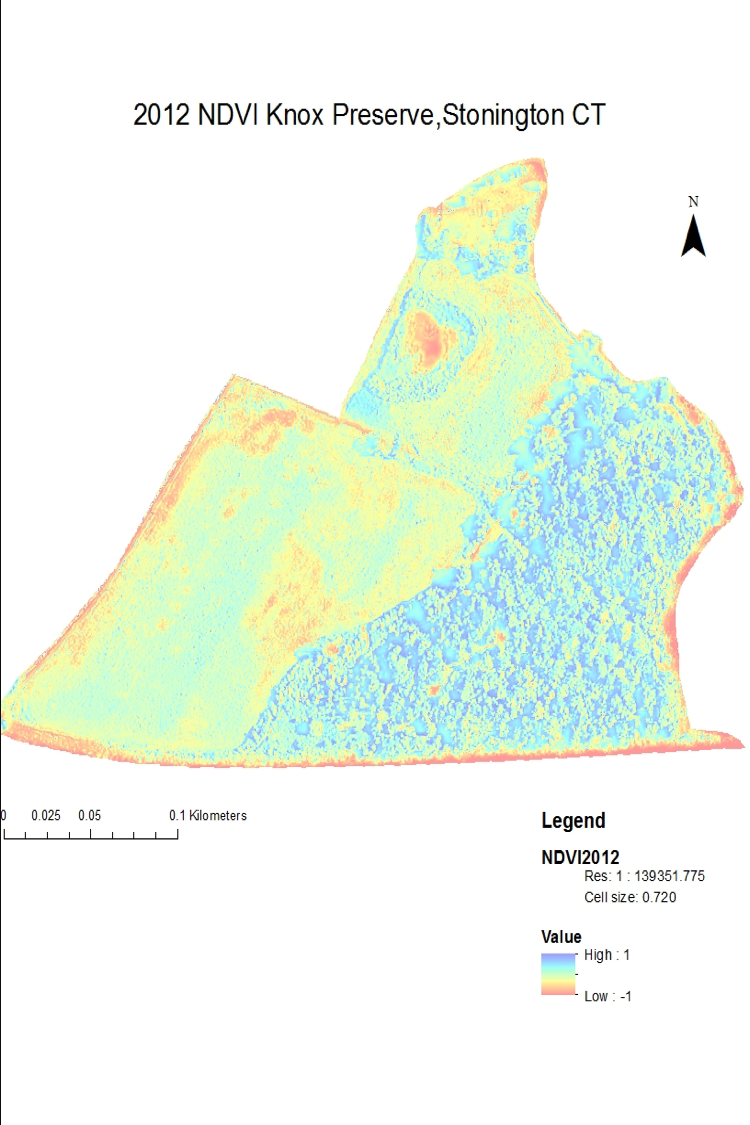
One of the best ways to understand vegetation change are from remote observations that can be achieved by using and manipulating satellite imagery data in ArcMap. We used the normalized difference vegetation index (NDVI) and ArcGIS zonal statistics to understand vegetation changes within the Knox Preserve, Stonington, CT between 2004 and 2012. Our results showed an increase in vegetation densities within our three habitats: grasslands, wetlands, and shrubland. Increased vegetation densities throughout the shrubland might be a key indicator that our site is becoming dominated by certain invasive (non-native) vine and shrub species that have outcompeted the native species for land and resources.
– Jenna’s final project report can be downloaded here
– Jenna’s senior project presentation slides can be downloaded here