
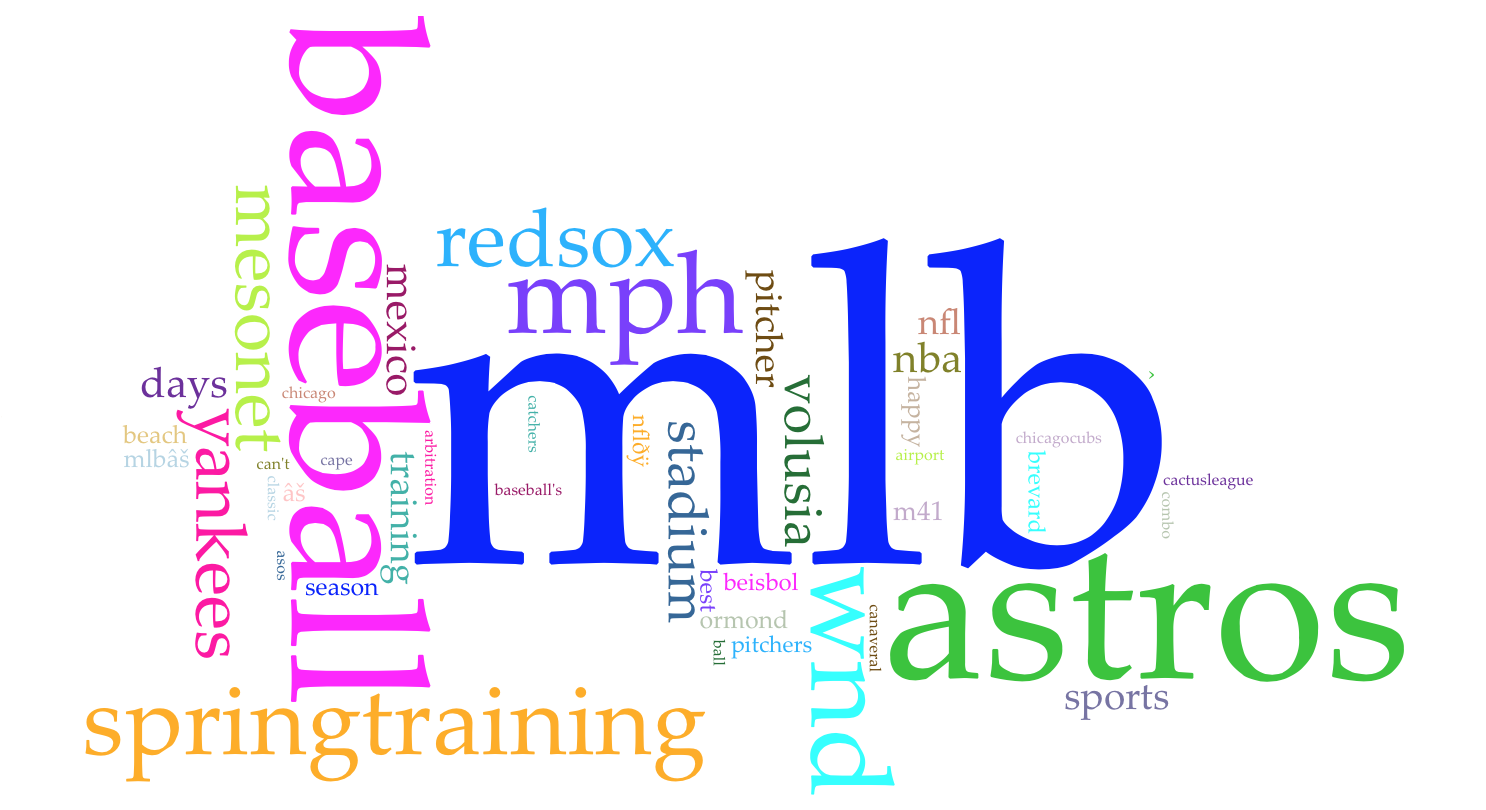
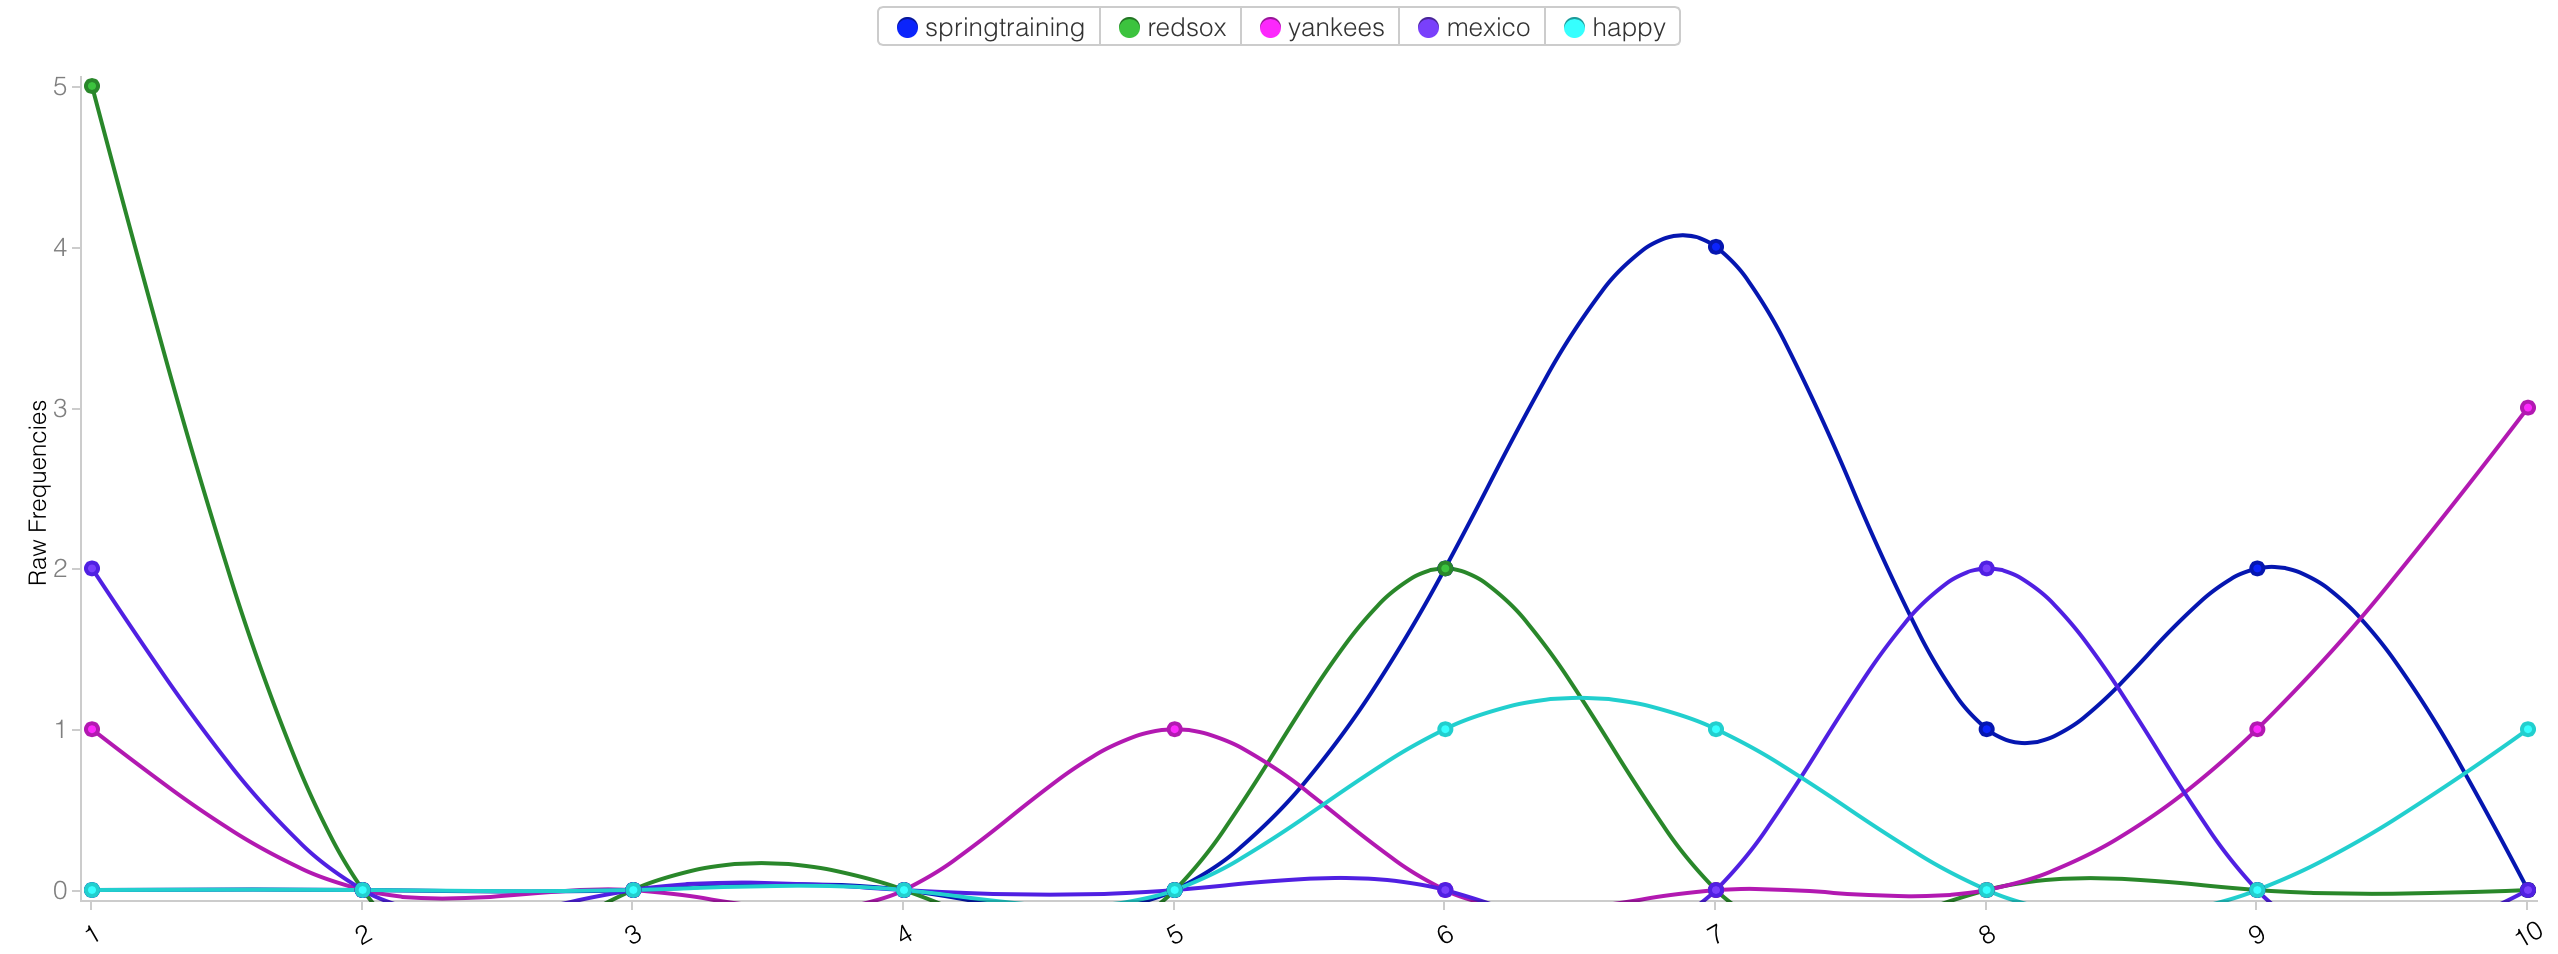
The third lab utilizes Voyant to examine word trends and popular words used in the tweets that we find. At this time, we are preparing for spring training as well as the World Baseball Classic when players get to play for their home country and represent their nation. Popular words I examined were SpringTraining, Yankees, Red Sox, Mexico, and happy. Yankees and Red Sox are two of the most popular teams in the sport and generate fan support all around the country. Mexico is seeing a heavy representation as they prepare for the WBC. This is also just a happy time; warm weather, the beginning of baseball, and fans coming together to support their favorite teams! Lastly, Spring Training kicks off the MLB season and the first players to report are pitchers and catchers, which were also popular words that I saw. A good MLB team separates itself from the pack with good pitching and catching, making those positions highly important to a team. My next study will examine catcher production and also their draft stock as well as top pitchers that appear out of the bullpen in late innings to hold a close lead.
Catchers are not only intended to be defensive stalwarts, but they also must have a positive impact on the team’s offense to be a great all around player. For the most part, it is difficult to evaluate a catcher defensively through statistics. Even with new sabermetric measurements used to analyze catchers, they do a poor job representing actual data because the pitchers play a large role in many facets of a catcher’s statistics. In some cases a pitcher’s ERA is more representative of a catcher than the actual catcher’s statistics. This can be seen with pitcher Francisco Liriano posting his best seasons while pitching to Russell Martin, in his seasons without Martin his ERA and overall statistics are much worse. When the battery was reunited during the second half of the 2016 season, Liriano returned to his all-star caliber with Martin as his catcher. Another example is the utilization of David Ross, one of the oldest catchers in the MLB played for multiple World Series championship teams because of how his presence and ability affects the pitching staff. Stats we can examine are the offensive production of these players, as great as they may be defensively; the MLB is a heavily offensive oriented league.
| 2016 Catcher Stats Post All Star Break | ||||||||||||||||
| Name | Team | Age | Draft Round | Sign | Pitches | zBall% | oStr% | Calls | PerGame | Runs Above Avg | Career CS% | 2016 CS% | Career BA | 2016 BA | Career OPS | 2016 OPS |
| Avila, A | White Sox | 29 | 5 Coll | 2811 | 17.8 | 6 | -63 | -1.76 | -8.4 | 29% | 25% | 0.242 | 0.236 | 0.740 | 0.720 | |
| Bandy, J | Angels | 26 | 31 Coll | 2584 | 13 | 6.8 | -6 | -0.17 | -0.8 | 42% | 42% | 0.284 | 0.281 | 0.861 | 0.832 | |
| Barnhart, T | Reds | 25 | 10 HS | 6505 | 15.8 | 7.1 | -54 | -0.65 | -7.2 | 34% | 33% | 0.250 | 0.261 | 0.669 | 0.723 | |
| Bethancourt, C | Padres | 24 | Pan | 2456 | 16.3 | 7.3 | -22 | -0.7 | -2.9 | 36% | 30% | 0.230 | 0.250 | 0.586 | 0.698 | |
| Brown, T | Giants | 24 | 10 Coll | 2483 | 15 | 6.2 | -30 | -0.95 | -4 | 22% | 22% | 0.249 | 0.254 | 0.677 | 0.704 | |
| Butera, D | Royals | 33 | 5 Coll | 1704 | 13.7 | 6.8 | -9 | -0.43 | -1.3 | 33% | 30% | 0.194 | 0.282 | 0.538 | 0.846 | |
| Cabrera, R | Reds | 26 | Ven | 1976 | 21.5 | 6.3 | -65 | -2.57 | -8.6 | 38% | 33% | 0.278 | 0.250 | 0.663 | 0.601 | |
| Casali, C | Rays | 27 | 10 Coll | 4530 | 11.3 | 6.9 | 19 | 0.33 | 2.6 | 31% | 37% | 0.187 | 0.168 | 0.646 | 0.575 | |
| Castillo, W | D-backs | 29 | DR | 5818 | 14.2 | 7.7 | 5 | 0.07 | 0.6 | 30% | 33% | 0.252 | 0.254 | 0.731 | 0.736 | |
| Castro, J | Astros | 29 | 1 Coll | 6044 | 11.3 | 8.5 | 90 | 1.17 | 12 | 26% | 17% | 0.233 | 0.206 | 0.698 | 0.671 | |
| Centeno, J | Twins | 26 | 32 HS (PR) | 2436 | 16 | 4.4 | -68 | -2.18 | -9 | 16% | 18% | 0.232 | 0.267 | 0.599 | 0.700 | |
| Cervelli, F | Pirates | 30 | Ven | 4485 | 16 | 10.1 | 54 | 0.95 | 7.2 | 22% | 20% | 0.281 | 0.263 | 0.734 | 0.671 | |
| Chirinos, R | Rangers | 32 | Ven | 2861 | 16.3 | 6 | -52 | -1.4 | -6.9 | 29% | 19% | 0.224 | 0.184 | 0.709 | 0.711 | |
| Clevenger, S | Mariners | 30 | 7 Coll | 1424 | 18.5 | 6.1 | -36 | -1.95 | -4.7 | 17% | 31% | 0.227 | 0.221 | 0.608 | 0.611 | |
| Conger, H | Rays | 28 | 1 HS | 2920 | 13.9 | 6.4 | -21 | -0.56 | -2.8 | 19% | 19% | 0.221 | 0.194 | 0.660 | 0.571 | |
| Contreras, W | Cubs | 24 | Ven | 1822 | 14 | 8.8 | 18 | 0.75 | 2.3 | 38% | 38% | 0.265 | 0.265 | 0.795 | 0.795 | |
| d’Arnaud, T | Mets | 27 | 1 HS | 3374 | 12.9 | 9.1 | 48 | 1.1 | 6.3 | 23% | 21% | 0.243 | 0.234 | 0.707 | 0.601 | |
| Ellis, A | Dodgers | 35 | 18 Coll | 3115 | 14.4 | 7 | -15 | -0.38 | -2 | 34% | 29% | 0.239 | 0.206 | 0.691 | 0.562 | |
| Flowers, T | Braves | 30 | 33 Coll | 3631 | 11.6 | 9 | 63 | 1.35 | 8.4 | 25% | 5% | 0.227 | 0.253 | 0.677 | 0.769 | |
| Fryer, E | Pirates | 1093 | 19.1 | 8.1 | -10 | -0.72 | -1.3 | |||||||||
| Fryer, E | Cardinals | 30 | 10 Coll | 673 | 14.1 | 5.5 | -9 | -1.09 | -1.3 | 21% | 13% | 0.257 | 0.280 | 0.667 | 0.670 | |
| Garneau, D | Rockies | 29 | 19 Coll | 1293 | 17 | 7.1 | -17 | -1.05 | -2.3 | 38% | 42% | 0.192 | 0.233 | 0.582 | 0.665 | |
| Gattis, E | Astros | 29 | 23 Coll | 2503 | 13.1 | 7.9 | 14 | 0.42 | 1.8 | 28% | 48% | 0.250 | 0.246 | 0.772 | 0.748 | |
| Gimenez, C | Indians | 33 | 19 Coll | 2610 | 13.2 | 8.1 | 15 | 0.45 | 2 | 22% | 18% | 0.217 | 0.210 | 0.625 | 0.555 | |
| Gomes, Y | Indians | 29 | 10 Coll | 4748 | 14.4 | 7.2 | -18 | -0.29 | -2.4 | 35% | 37% | 0.246 | 0.265 | 0.707 | 0.512 | |
| Gosewisch, T | D-backs | 32 | 11 Coll | 1055 | 16.3 | 5.7 | -18 | -1.36 | -2.4 | 36% | 25% | 0.205 | 0.154 | 0.513 | 0.421 | |
| Grandal, Y | Dodgers | 27 | 1 Coll | 5677 | 9.4 | 9 | 132 | 1.82 | 17.6 | 23% | 27% | 0.240 | 0.236 | 0.778 | 0.847 | |
| Hanigan, R | Red Sox | 35 | USA | 2225 | 14.9 | 6.6 | -21 | -0.74 | -2.8 | 37% | 33% | 0.250 | 0.158 | 0.679 | 0.437 | |
| Herrmann, C | D-backs | 28 | 6 Coll | 2268 | 18.1 | 6.4 | -45 | -1.56 | -6 | 38% | 39% | 0.213 | 0.290 | 0.624 | 0.853 | |
| Hundley, N | Rockies | 32 | 2 Coll | 4308 | 16.7 | 6.3 | -74 | -1.33 | -9.8 | 27% | 14% | 0.248 | 0.237 | 0.702 | 0.713 | |
| Iannetta, C | Mariners | 33 | 4 Coll | 5752 | 15.8 | 6.4 | -77 | -1.04 | -10.2 | 25% | 29% | 0.229 | 0.212 | 0.746 | 0.644 | |
| Joseph, C | Orioles | 30 | 7 Coll | 2704 | 13.2 | 8.8 | 30 | 0.88 | 4 | 36% | 33% | 0.219 | 0.202 | 0.631 | 0.473 | |
| Kratz, E | Astros | 36 | 29 Coll | 709 | 13.3 | 7.5 | 1 | 0.16 | 0.2 | |||||||
| Kratz, E | Pirates | 1153 | 14.5 | 7.1 | -5 | -0.31 | -0.6 | 34% | 44% | 0.200 | 0.094 | 0.610 | 0.258 | |||
| Leon, S | Red Sox | 27 | Ven | 2609 | 15.4 | 6.5 | -29 | -0.86 | -3.8 | 46% | 45% | 0.258 | 0.363 | 0.662 | 0.995 | |
| Lobaton, J | Nationals | 31 | Ven | 1700 | 15.8 | 11 | 29 | 1.34 | 3.9 | 21% | 27% | 0.222 | 0.194 | 0.628 | 0.662 | |
| Lucroy, J | Rangers | 30 | 3 Coll | 6914 | 14.3 | 8.6 | 46 | 0.53 | 6.1 | 28% | 40% | 0.284 | 0.295 | 0.780 | 0.846 | |
| Maile, L | Rays | 25 | 8 Coll | 1224 | 15.3 | 6.4 | -12 | -0.75 | -1.6 | 27% | 21% | 0.169 | 0.167 | 0.429 | 0.428 | |
| Maldonado, M | Brewers | 29 | 27 HS (PR) | 2766 | 13.9 | 9.1 | 27 | 0.75 | 3.5 | 34% | 36% | 0.217 | 0.192 | 0.635 | 0.685 | |
| Martin, R | Blue Jays | 33 | 17 Coll | 6323 | 12.4 | 7.9 | 47 | 0.57 | 6.2 | 32% | 15% | 0.255 | 0.228 | 0.752 | 0.673 | |
| Mathis, J | Marlins | 33 | 1 HS | 2094 | 15 | 9.4 | 17 | 0.64 | 2.3 | 27% | 29% | 0.196 | 0.240 | 0.563 | 0.622 | |
| Maxwell, B | Athletics | 25 | 2 Coll | 370 | 8.5 | 6.4 | 4 | 0.8 | 0.5 | 0-2 | 0-2 | 0.100 | 0.100 | 0.150 | 0.150 | |
| McBride, M | Athletics | 31 | 2 Coll | 741 | 16.7 | 5.3 | -18 | -1.87 | -2.4 | 13% | 13% | 0.205 | 0.231 | 0.538 | 0.558 | |
| McCann, B | Yankees | 32 | 2 HS | 5846 | 13.4 | 8.1 | 34 | 0.46 | 4.6 | 26% | 23% | 0.266 | 0.231 | 0.799 | 0.739 | |
| McCann, J | Tigers | 26 | 2 Coll | 4750 | 14.1 | 6.5 | -36 | -0.59 | -4.8 | 43% | 51% | 0.243 | 0.204 | 0.649 | 0.592 | |
| Mesoraco, D | Reds | 28 | 1 HS | 1105 | 13.6 | 6.1 | -10 | -0.71 | -1.3 | 25% | 27% | 0.237 | 0.140 | 0.718 | 0.378 | |
| Molina, Y | Cardinals | 34 | 4 HS (PR) | 7496 | 13.2 | 8.1 | 46 | 0.48 | 6.1 | 43% | 21% | 0.282 | 0.281 | 0.733 | 0.735 | |
| Montero,M | Cubs | 33 | Ven | 3595 | 11.3 | 10.1 | 95 | 2.07 | 12.7 | 28% | 6% | 0.258 | 0.190 | 0.756 | 0.632 | |
| Murphy, J | Twins | 25 | 2 HS | 881 | 15.3 | 7.2 | -6 | -0.53 | -0.8 | 27% | 20% | 0.242 | 0.075 | 0.625 | 0.219 | |
| Narvaez, O | White Sox | 24 | Ven | 510 | 17 | 6.4 | -8 | -1.17 | -1 | 0-4 | 0-4 | 0.409 | 0.409 | 1.006 | 1.006 | |
| Navarro, D | White Sox | 32 | Ven | 5715 | 18.3 | 6.9 | -108 | -1.47 | -14.3 | 28% | 22% | 0.251 | 0.209 | 0.682 | 0.607 | |
| Nicholas, B | Rangers | 28 | 6 Coll | 832 | 13.1 | 7.2 | 0 | -0.04 | -0.1 | 25% | 25% | 0.257 | 0.257 | 0.876 | 0.876 | |
| Norris, D | Padres | 27 | 4 HS | 6785 | 13.2 | 7.9 | 34 | 0.4 | 4.6 | 27% | 25% | 0.237 | 0.189 | 0.698 | 0.600 | |
| Pena, B | Cardinals | 34 | Cuba | 130 | 10.9 | 3.6 | -2 | -1 | -0.2 | 28% | 0-4 | 0.259 | 0.125 | 0.65 | 0.347 | |
| Pena, F | Orioles | 26 | DR | 727 | 18.3 | 5.9 | -18 | -1.92 | -2.4 | 57% | 50% | 0.205 | 0.219 | 0.526 | 0.577 | |
| Perez, C | Angels | 25 | Ven | 4703 | 13.6 | 6.4 | -30 | -0.5 | -4 | 38% | 38% | 0.238 | 0.223 | 0.625 | 0.601 | |
| Perez, R | Indians | 27 | 33 Coll | 1349 | 11.7 | 7.7 | 9 | 0.53 | 1.2 | 41% | 50% | 0.217 | 0.093 | 0.667 | 0.368 | |
| Perez, S | Royals | 26 | Ven | 7127 | 15.5 | 5.9 | -114 | -1.25 | -15.2 | 35% | 53% | 0.276 | 0.262 | 0.740 | 0.757 | |
| Phegley, J | Athletics | 28 | 1 Coll | 1830 | 16.5 | 6.6 | -27 | -1.13 | -3.5 | 32% | 11% | 0.232 | 0.256 | 0.654 | 0.686 | |
| Pierzynski, A | Braves | 39 | 3 HS | 4525 | 14.2 | 5.8 | -56 | -0.96 | -7.4 | 24% | 24% | 0.280 | 0.215 | 0.739 | 0.530 | |
| Plawecki, K | Mets | 25 | 1 Coll | 2761 | 10.3 | 7.5 | 30 | 0.84 | 3.9 | 25% | 24% | 0.210 | 0.194 | 0.570 | 0.559 | |
| Posey, B | Giants | 29 | 1 Coll | 6360 | 10.3 | 9.6 | 165 | 2.02 | 21.9 | 34% | 46% | 0.308 | 0.291 | 0.854 | 0.823 | |
| Ramos, W | Nationals | 29 | Ven | 6624 | 13 | 6.5 | -23 | -0.27 | -3 | 33% | 35% | 0.271 | 0.337 | 0.750 | 0.938 | |
| Realmuto, J | Marlins | 25 | 3 HS | 7153 | 15.7 | 6.2 | -103 | -1.12 | -13.7 | 31% | 37% | 0.281 | 0.311 | 0.722 | 0.762 | |
| Recker, A | Braves | 32 | 18 Coll | 1067 | 17.6 | 5.2 | -27 | -1.95 | -3.6 | 28% | 29% | 0.200 | 0.389 | 0.626 | 1.005 | |
| Rivera, R | Mets | 33 | 2 HS (PR) | 2331 | 12.8 | 7.3 | 7 | 0.23 | 0.9 | 37% | 29% | 0.212 | 0.214 | 0.594 | 0.636 | |
| Romine, A | Yankees | 27 | 2 HS | 2513 | 13.1 | 6.2 | -15 | -0.47 | -2 | 21% | 13% | 0.219 | 0.244 | 0.580 | 0.660 | |
| Rosario, A | Cardinals | 29 | DR | 584 | 19 | 8.2 | -5 | -0.61 | -0.6 | 17% | 17% | 0.208 | 0.208 | 0.519 | 0.519 | |
| Ross, D | Cubs | 39 | 7 Coll | 2879 | 12.9 | 9.5 | 48 | 1.3 | 6.4 | 35% | 27% | 0.228 | 0.223 | 0.737 | 0.763 | |
| Ruiz, C | Phillies | 37 | Pan | 3449 | 16.4 | 6.3 | -55 | -1.24 | -7.3 | 27% | 41% | 0.266 | 0.262 | 0.745 | 0.722 | |
| Rupp, C | Phillies | 27 | 3 Coll | 5639 | 14.1 | 7.4 | -9 | -0.12 | -1.2 | 32% | 23% | 0.248 | 0.275 | 0.722 | 0.820 | |
| Saltalamacchia, J | Tigers | 31 | 1 HS | 3659 | 15.9 | 6 | -59 | -1.27 | -7.9 | 22% | 27% | 0.238 | 0.197 | 0.729 | 0.716 | |
| Sanchez, G | Yankees | 23 | DR | 344 | 11.4 | 8.7 | 6 | 1.45 | 0.8 | 3-5 | 3-5 | 0.289 | 0.302 | 0.808 | 0.845 | |
| Severino, P | Nationals | 23 | DR | 300 | 19.4 | 7.2 | -6 | -1.47 | -0.8 | 1-3 | 1-3 | 0.375 | 0.417 | 0.911 | 0.950 | |
| Soto, G | Angels | 33 | 11 HS | 1534 | 15.2 | 7.5 | -7 | -0.36 | -0.9 | 27% | 21% | 0.246 | 0.284 | 0.765 | 0.811 | |
| Stewart, C | Pirates | 34 | 12 Coll | 1957 | 17.5 | 8 | -18 | -0.71 | -2.4 | 29% | 23% | 0.235 | 0.198 | 0.604 | 0.579 | |
| Sucre, J | Mariners | 28 | Ven | 200 | 17.6 | 9.1 | 0 | 0.01 | 0 | 37% | 0-4 | 0.176 | 0.125 | 0.436 | 0.425 | |
| Suzuki, K | Twins | 32 | 2 Coll | 5960 | 14.6 | 7.7 | -7 | -0.09 | -0.9 | 24% | 19% | 0.257 | 0.283 | 0.686 | 0.759 | |
| Swihart, B | Red Sox | 24 | 1 HS | 515 | 14.4 | 7.2 | -2 | -0.29 | -0.3 | 28% | 25% | 0.271 | 0.258 | 0.714 | 0.72 | |
| Thole, J | Blue Jays | 29 | 13 HS | 2532 | 14.2 | 6.6 | -18 | -0.56 | -2.4 | 24% | 26% | 0.242 | 0.158 | 0.620 | 0.460 | |
| Vazquez, C | Red Sox | 25 | 9 HS (PR) | 3579 | 14.4 | 8.8 | 23 | 0.5 | 3.1 | 45% | 36% | 0.233 | 0.226 | 0.601 | 0.583 | |
| Vogt, S | Athletics | 31 | 12 Coll | 6055 | 16.3 | 6 | -110 | -1.42 | -14.6 | 33% | 31% | 0.261 | 0.272 | 0.743 | 0.749 | |
| Wieters, M | Orioles | 30 | 1 Coll | 5904 | 15.2 | 6.6 | -59 | -0.78 | -7.9 | 33% | 39% | 0.256 | 0.233 | 0.736 | 0.663 | |
| Wolters,T | Rockies | 24 | 3 HS | 3338 | 11.7 | 9.6 | 70 | 1.64 | 9.3 | 29% | 29% | 0.233 | 0.233 | 0.657 | 0.657 | |
| Zunino, M | Mariners | 25 | 1 Coll | 1333 | 13.8 | 9.5 | 20 | 1.18 | 2.7 | 28% | 25% | 0.196 | 0.271 | 0.630 | 1.108 | |
These statistics represent catchers both offensively and defensively. In addition to their statistics it displays their age and their draft position or if a team instead signed them as undrafted free agents. Ideally, teams spend a lot of time trying to find a next top tier catcher, but it seems more forced than developed. Players drafted in the top two rounds are some of the best amateur athletes available and the amount of catcher drafted that early that do not pan out is astounding.
Catchers drafted before 3rd round 101 total since 2000
2015: 4
2014: 6
2013: 5
2012: 9
2011: 6
2010: 5
2009: 7
2008: 4
2007: 10
2006: 2
2005: 6
2004: 8
2003: 5
2002: 6
2001: 4
2000: 5
2000-2010: 71 total
20: did not make to pros
26: made 100 or less PA’s
37: made less than 500 PA’s
7: no longer catch: upper tier of successful draft choices
20: over 1000 PA’s (13 still at catcher)
28.2% success rate overall
20.3% success rate as catcher
10 Starting Catchers in 2016 were not drafted (33%)
From 2000-2010 71 catchers were drafted in the first two rounds and only 13 made it as big league catchers (not all even everyday starters/impact players). This is actually a waste of a top pick when better positional players are available. 1/3 of the starting catchers this past season weren’t even drafted making catchers poor choices for a first or second round pick. Also, whether a catcher was drafted out of high school or college also tells a story about their possible future success, but I will discuss that element of the draft in a later lab. The only standout catcher drafted in the first round is Buster Posey on the San Francisco Giants. Posey is a tremendous all around catcher, and one of few that remained at the position despite how good he is offensively. It is not atypical to see a catcher switch positions to protect them from injuries that can occur from catching. Players like Wil Myers and Josh Donaldson are among superstars that did not stay at catcher once their offensive prestige was discovered. However, Posey is an interesting case because although he is a catcher, he played multiple positions in college at Florida State, including Shortstop. This tells me that he is one of the top offensive players overall and he doesn’t have to remain at catcher.
Switching to the bullpen, pitchers are used in high leverage situations expected to do what they do best, get outs without allowing runs. This is done most efficiently by inducing ground ball outs or getting strikeouts (swing and miss percentage). The pitchers below are some of the best relievers in the MLB.
| Creating a Bullpen (Post all star break) | |||||||||||||||||||||||
| Player | Team | POS | IP | ERA | ERA- | FIP | DRA | HR allowed | OPP BA | BA vs R | BA v L | ERA Rest 0 | ERA Rest 1 | ERA Rest 2+ | K/9 | K% | SO/BB | GB% | FB mov | FB xmov | FB vel | FB swing/miss% | LD% |
| O’Day, D | BAL | RHP | 26.0 | 3.46 | 77 | 4.67 | 3.71 | 5 | 0.214 | 0.215 | 0.212 | 5.40 | 6.14 | 1.32 | 11.1 | 28.80% | 2.67 | 36.40% | 8.4 | -7.3 | 86.5 | 19.30% | 32% |
| Britton, Z | BAL | LHP | 46.2 | 0.58 | 13 | 1.89 | 2.23 | 1.00 | 0.138 | 0.139 | 0.135 | 1.46 | 0.00 | 0.39 | 10.60 | 31.80% | 4.23 | 79.60% | 8.60 | 7.4 | 96.30 | 19.20% | 14% |
| Chapman, A | NYY/CHC | LHP | 36.0 | 2.00 | 46 | 1.69 | 2.48 | 2 | 0.165 | 0.160 | 0.190 | 0.00 | 4.15 | 2.40 | 12.8 | 37.80% | 6.38 | 42.70% | 12.3 | 5.0 | 100.1 | 17.50% | 33% |
| Capps, C | MIA | RHP (2015) | 31.0 | 1.16 | 30 | 1.1 | 1.69 | 2 | 0.168 | 0.175 | 0.160 | 0.00 | 1.29 | 1.33 | 16.8 | 49.20% | 8.29 | 40.80% | 10.2 | -6.8 | 98 | 16.40% | 29% |
| Jansen, K | LAD | RHP | 48.0 | 1.31 | 33 | 1.57 | 2.57 | 2 | 0.147 | 0.096 | 0.200 | 1.93 | 0.00 | 1.59 | 12 | 36.60% | 9.14 | 32.70% | 9.8 | 2.0 | 93.2 | 15.40% | 17% |
| Wilson, J | DET | LHP | 42.0 | 3.64 | 98 | 1.92 | 2.82 | 2 | 0.250 | 0.247 | 0.254 | 7.27 | 2.03 | 3.15 | 10.5 | 28.50% | 8.17 | 59.50% | 12.5 | 5.6 | 95.4 | 15.20% | 19% |
| Familia, J | NYM | RHP | 51.2 | 2.96 | 75 | 2.51 | 3.71 | 0 | 0.241 | 0.229 | 0.264 | 2.00 | 5.74 | 1.50 | 9.1 | 24.10% | 2.26 | 62.50% | 9.7 | -8.2 | 95.9 | 15.00% | 21% |
| Herrera, K | KC | RHP | 49.2 | 1.63 | 50 | 2.05 | 2.37 | 3 | 0.199 | 0.179 | 0.221 | 1.54 | 0.00 | 2.78 | 11.4 | 32.60% | 7.88 | 44.90% | 10.7 | -4.8 | 97.3 | 14.80% | 22% |
| Oh, S | STL | RHP | 56.2 | 2.06 | 51 | 2.13 | 2.41 | 3 | 0.172 | 0.167 | 0.177 | 2.20 | 2.60 | 1.57 | 11.4 | 32.60% | 5.14 | 40.30% | 10.5 | -4.8 | 92.7 | 13.70% | 22% |
| Kimbrel, C | BOS | RHP | 35.1 | 3.31 | 79 | 2.6 | 2.69 | 3 | 0.167 | 0.162 | 0.172 | 2.08 | 3.86 | 3.68 | 14.3 | 38.90% | 3.5 | 32.90% | 10.3 | -5.6 | 97.5 | 13.60% | 19% |
| Allen, C | CLE | RHP | 46.0 | 2.54 | 58 | 3.53 | 2.71 | 6 | 0.193 | 0.173 | 0.213 | 0.68 | 5.68 | 1.80 | 11.2 | 31.30% | 3.17 | 43.80% | 12.2 | -5.0 | 94.1 | 12.30% | 25% |
| Brach, B | BAL | RHP | 57.2 | 1.25 | 29 | 2.49 | 2.86 | 3 | 0.174 | 0.081 | 0.265 | 0.00 | 2.65 | 0.98 | 10.1 | 29.30% | 3.61 | 40.30% | 9.9 | -4.7 | 94.4 | 12.20% | 23% |
| Osuna, R | TOR | RHP | 50.1 | 1.79 | 45 | 2.32 | 3.05 | 3 | 0.180 | 0.149 | 0.221 | 1.13 | 2.08 | 2.11 | 10.9 | 31.30% | 5.55 | 33.10% | 11.7 | -3.5 | 95.7 | 12.00% | 23% |
| Davis, W | KC | RHP | 33.2 | 1.60 | 38 | 2.75 | 4.12 | 0 | 0.186 | 0.196 | 0.177 | 0.00 | 0.00 | 2.84 | 8.6 | 23.70% | 2.13 | 49.40% | 11.1 | -3.0 | 95.1 | 11.70% | 15% |
| Betances, D | NYY | RHP | 52.0 | 2.42 | 55 | 1.27 | 1.57 | 3 | 0.196 | 0.154 | 0.247 | 1.38 | 3.86 | 1.50 | 15.9 | 44.70% | 6.13 | 53.10% | 9.8 | -2.1 | 97.4 | 11.70% | 19% |
| Thornburg, T | MIL | RHP | 44.2 | 2.22 | 51 | 2.87 | 2.56 | 5 | 0.175 | 0.211 | 0.123 | 4.35 | 1.38 | 1.69 | 12.3 | 34.90% | 4.36 | 35.40% | 11.7 | -2.8 | 94.1 | 10.20% | 25% |
| Gregerson, L | HOU | RHP | 43.2 | 3.09 | 73 | 2.42 | 2.59 | 2 | 0.168 | 0.111 | 0.230 | 5.19 | 3.00 | 2.25 | 10.5 | 29.80% | 3.92 | 62.70% | 5.5 | -5.0 | 89.4 | 9.60% | 18% |
| Madson, R | OAK | RHP | 45.2 | 3.74 | 88 | 4.54 | 4.67 | 7 | 0.254 | 0.265 | 0.240 | 8.44 | 2.65 | 2.00 | 7.1 | 19.00% | 2.57 | 40.70% | 10.9 | -6.9 | 94.5 | 9.30% | 26% |
| Rosenthal, T | STL | RHP | 33.1 | 5.13 | 127 | 4.12 | 4.6 | 3 | 0.301 | 0.307 | 0.292 | 2.57 | 0.00 | 8.83 | 13 | 28.70% | 1.78 | 55.70% | 11.1 | -4.7 | 97.1 | 9.30% | 27% |
| Reed, A | NYM | RHP | 51.1 | 1.93 | 48 | 1.85 | 2.3 | 3 | 0.186 | 0.179 | 0.197 | 1.65 | 0.60 | 3.15 | 11.6 | 33.20% | 7.33 | 41.00% | 9.7 | -2.1 | 92.2 | 9.30% | 25% |
| Rondon, H | CHC | RHP | 42.1 | 1.70 | 41 | 2.38 | 2.62 | 4 | 0.171 | 0.148 | 0.207 | 2.45 | 2.08 | 0.98 | 10.8 | 32.90% | 10.2 | 45.80% | 10 | -4.6 | 95.9 | 9.20% | 20% |
| Melancon, M | PIT/WAS | RHP | 44.2 | 1.41 | 35 | 2.51 | 3.18 | 2 | 0.199 | 0.185 | 0.217 | 0.00 | 1.59 | 2.12 | 8.5 | 24.30% | 4.67 | 49.20% | 5.2 | 3.1 | 90.6 | 9.00% | 22% |
| Siegrist, K | STL | LHP | 42.0 | 2.79 | 71 | 4.47 | 3.97 | 7 | 0.185 | 0.170 | 0.217 | 3.12 | 3.55 | 2.89 | 9.2 | 25.90% | 2.69 | 32.70% | 11.5 | 5.7 | 93.2 | 8.70% | 18% |
| Robertson, D | CHW | RHP | 45.1 | 3.97 | 95 | 4.13 | 3.27 | 6 | 0.232 | 0.256 | 0.209 | 2.16 | 0.90 | 7.23 | 10.1 | 26.30% | 2.22 | 48.70% | 7.8 | 2.2 | 91.9 | 7.80% | 15% |
| Watson, T | PIT | LHP | 47.1 | 2.66 | 71 | 3.66 | 3.93 | 4 | 0.194 | 0.188 | 0.208 | 1.74 | 0.53 | 3.60 | 8 | 22.20% | 2.47 | 47.20% | 12.4 | 11.2 | 93.2 | 7.50% | 19% |
| Hendriks, L | OAK | RHP | 40.1 | 4.69 | 107 | 3.46 | 4.49 | 5 | 0.292 | 0.311 | 0.259 | 2.25 | 6.48 | 3.66 | 8.5 | 22.00% | 5.43 | 42.90% | 11.1 | -2.2 | 94.1 | 7.30% | 26% |
| Giles,K | HOU | RHP | 42.2 | 3.80 | 89 | 2.76 | 2.91 | 5 | 0.246 | 0.253 | 0.238 | 5.00 | 6.10 | 2.31 | 13.3 | 34.10% | 4.5 | 35.60% | 10.8 | -1.7 | 96.9 | 7.30% | 32% |
| Colome, A | TBR | RHP | 40.0 | 2.03 | 50 | 2.76 | 2.43 | 4 | 0.201 | 0.200 | 0.203 | 0.00 | 2.89 | 2.61 | 11.9 | 33.80% | 4.42 | 54.90% | 11.3 | 0.2 | 94.6 | 7.30% | 21% |
| Barraclough, K | MIA | RHP | 48.0 | 2.81 | 70 | 2.28 | 2.24 | 1 | 0.179 | 0.170 | 0.189 | 1.72 | 2.35 | 4.24 | 14.6 | 38.10% | 2.44 | 55.60% | 10 | -3.2 | 95.5 | 7.20% | 20% |
| Smith, J | LAA/CHC | RHP | 39.1 | 3.89 | 97 | 4.96 | 4.03 | 5 | 0.264 | 0.272 | 0.254 | 2.08 | 4.24 | 4.97 | 5.7 | 14.80% | 1.79 | 52.80% | 10.3 | -10.0 | 88 | 6.60% | 26% |
| Strop, P | CHC | RHP | 42.0 | 2.79 | 65 | 2.94 | 2.43 | 4 | 0.168 | 0.176 | 0.149 | 7.71 | 2.53 | 0.82 | 11.6 | 32.30% | 4.15 | 58.90% | 10.9 | -8.6 | 95.1 | 6.10% | 20% |
| Storen, D | TOR/SEA | RHP | 37.2 | 6.45 | 144 | 4.89 | 4.43 | 6 | 0.306 | 0.276 | 0.356 | 8.44 | 7.62 | 5.12 | 7.9 | 18.80% | 2.75 | 48.00% | 10.5 | -9.5 | 91.6 | 6.00% | 22% |
| Grimm, J | CHC | RHP | 35.1 | 4.58 | 111 | 3.78 | 3.79 | 4 | 0.235 | 0.195 | 0.296 | 6.75 | 7.00 | 2.45 | 10.2 | 26.10% | 2.5 | 43.30% | 11.1 | -3.2 | 94.3 | 6.00% | 27% |
| Ramos, A | MIA | RHP | 44.1 | 3.05 | 74 | 2.93 | 3.17 | 1 | 0.210 | 0.213 | 0.207 | 0.63 | 3.27 | 4.74 | 11.4 | 29.00% | 2.15 | 37.50% | 10.3 | -2.6 | 91.8 | 5.80% | 29% |
| Wood, T | CHC | LHP | 44.2 | 2.62 | 64 | 4.61 | 4.69 | 6 | 0.185 | 0.235 | 0.136 | 0.92 | 5.79 | 0.87 | 7.3 | 19.70% | 1.89 | 37.30% | 11.3 | 2.8 | 90.3 | 5.70% | 26% |
| Cecil, B | TOR | LHP | 21.1 | 5.06 | 119 | 3.84 | 4.87 | 3 | 0.318 | 0.308 | 0.333 | 10.38 | 0.00 | 5.73 | 8.9 | 21.90% | 4.2 | 40.30% | 10 | 4.6 | 91 | 5.10% | 29% |
| Smith, W | MIL/SFG | LHP | 24.0 | 4.13 | 119 | 3.93 | 3.83 | 3 | 0.236 | 0.174 | 0.302 | 7.50 | 3.86 | 1.42 | 9.4 | 24.80% | 2.78 | 34.90% | 11.6 | 4.5 | 91.7 | 4.60% | 24% |
| Miller, A | NYY/CLE | LHP | 48.0 | 1.50 | 39 | 1.9 | 1.45 | 6 | 0.175 | 0.163 | 0.208 | 0.00 | 0.96 | 3.00 | 15.4 | 45.10% | 11.71 | 54.40% | 10.9 | 6.3 | 94.3 | 3.20% | 16% |
After the 2015 season, the Syracuse University Diamond Dollars Team concluded that the best bullpen (per player role) was:
Andrew Miller
Zach Britton
Juerys Familia
Darren O’Day
Brett Cecil
This is the best combination of power pitching (fastball velocity) as well as ball movement generated from spin rate and pitcher arm slot (angle). These pitchers are the best in their particular late inning roles because of their ability to get outs. The most interesting pitcher did not make this list due to suffering an injury during the season was Carter Capps.
Carter Capps: (Height: 6’5)
Velocity: Pitch Perceived Velocity Spin Rate Extension
| 101.3 | Four-seam FB | 104.4 | 2,483 |
8.1
|
Capps has a unique pitching motion allowing him to reach farther out and cut distance between him and the plate allowing his 101mph fastball to appear to be moving at 104mph.
Pitchers and catcher play a major role in defining a team’s success throughout the year. Examining these players this in depth allows teams to gather a better understanding of the expected output these players can provide. Fans understand the importance of these players and that is why they also have more time at the beginning of the year to develop their skills before the rest of the team arrives in the spring.
Gennaro, Vince. Diamond dollars: the economics of winning in baseball. Purchase, NY: Diamond Analytics, 2013. Print.
SunSportsFOXSportsFL. “Marlins Mechanics- Carter Capps.” YouTube. YouTube, 13 Aug. 2015. Web. 26 Mar. 2017.