
I chose to work with my entire dataset, totalling 90,579 tweets. In all, Twitter identified 39 languages from the text of tweets using #NoDAPL. They are: ar, bg, ca, cs, da, de, en (US, GB, and AU), es, eu, fi, fr, ga, gl, he, hr, hu, id, it, ja, ko, lv, nb, nl, no, pl, pt, ru, sk, sr, sv, th, tr, uk, vi, xx-lc, zh-ch, and zh-tw. English and its variants are the most prevalent, with 85,044 tweets, or 93.9%. Most other languages have between a dozen and a couple hundred tweets, and some only a single tweet. 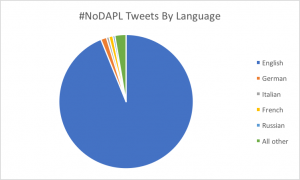
As the Dakota Access Pipeline is an American issue, I am not surprised that the majority of the tweets are in English. There does not seem to be a pattern amongst the tweets in other languages. In analyzing the corpus in Lab 3, I came across several Russian characters that were prevalent, which may explain a portion of the non-English tweets, but there were no other instances of non-English words being used. The only other explanation I can think of is that some indigenous or non-Western words, used in conjunction with English, may have confused the Twitter language algorithm.
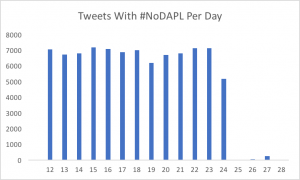
The volume of tweets was relatively consistent over the period I collected, until the 25th of February, when it dropped abruptly to zero. The day before, the last remaining protesters had been removed from the Standing Rock camp by police forces. Given this action, I would have expected the tweeting to increase rather than decrease, but there may be other factors at play as well. In the following days, the volume of tweets is similarly low. Perhaps the final elimination of the camp signaled a symbolic end to the protest, and the hashtag was retired or another was taken up in its place. Looking at Twitter again in April, approximately a month and a half after I finished collecting data, the volume of tweets using #NoDAPL is lower that when I first assessed it in January. The hashtag has not been entirely abandoned, but its use has definitely decreased following the clearing of the protest camps and other events.
The mean, median, and mode for my data were all relatively consistent with other data from the class. The mean number of tweets for #NoDAPL was the fourth highest (behind #ClimateChange, #MakeAmericaGreatAgain, and #BlackLivesMatter). The median, however, was ranked lower, likely because I had several days with zero or nearly zero tweets. Though there is only one other mode listed (for #2a), it is relatively close to the value I found. The mean seems to indicate that my topic was popular on Twitter, ranking amongst other conversations on social issues. Interestingly, the mean number of mentions of #KeystoneXL was a tenth of mine. The two hashtags seem to address the topic differently—#NoDAPL for indigenous rights and the protest, #KeystoneXL for the environmental impact—and the conversations that took place were very different.
The minimum and maximum tweets per day are more revealing. My classmates chose to examine different time periods, so the counts are inconsistent, ranging from a couple thousand over several days to tens of thousands over an entire month. Of the full datasets, there are three with around the same number of tweets: #NoDAPL (74,523), #MakeAmericaGreatAgain (75,619), and #BlackLivesMatter (72,348). The range is most interesting. A couple other hashtags (#LBGT and #islamophobia) had a similar phenomenon of dropping to near zero, but from a maximum of less than a thousand. It is difficult to say without seeing the daily charts, but it is likely that their decreases were more gradual. It is possible that with a sudden drop in usage, #NoDAPL fell from the trending topics list or was deprioritized in favor of other, up and coming hashtags.
The only surprise in my data was the sudden drop on February 25. It could be the result of action by users of the hashtag, manipulation of the hashtag’s ranking by Twitter, or an error in my data collection. As I saw other hashtags with similar rapid changes, I would not be entirely surprised if my data is accurate and there really was a sudden drop in usage. I would like to look into the days before in more detail to see if there is any other information that would explain what happened.
Your reference to Lab 3 was insightful. I wonder if Twitter only detects language by words rather than by characters. I did not think to investigate the language that the non-English characters, that I filtered from Lab 3, belonged to. This may have been helpful in determining Twitter’s ability to detect non-English words.
It was shocking/scary to see that the use of #NoDAPL decreased so rapidly after protesters were removed from Standing Rock. Is support via Twitter dependent upon the physical proximity of people to an issue? This is something that I did not have to investigate since #BlackLivesMatter appears to be less temporal than #NoDAPL.
It may be helpful to look at the actual tweets on Feb. 25-28. I am curious to know if people’s tweets were more hopeful before Feb. 25 than those posted Feb. 25-28. Were tweets posted Feb. 25-28 speaking of defeat, discouragement, expressions of lamentation, etc.?
I think it is really cool how you can straightforward your graph is in displaying what happened on February 25th. I am surprised that such a great portion of people stopped talking about the Dakota Access Pipeline. Like you, I would expect the rate to stay somewhat the same, if not more, and would expect the style of tweets to be different still surrounding that issue. I think making a connection between the actions of the police and the sudden silence of Americans around the #nodapl discussion, or any other ways police increase or decrease the public voice. I’m also curious to see what the “yes dapl” side of the discussion had to say after the removal of the protestors, and if there was an increase in tweets in favor of the Dakota Access Pipeline.