
I chose the most recent 3000 tweets since there has been a lot going on in the realm of keystone XL advancement in the past week or so and I am interested in seeing what it has to say between April 3rd to April 12th.
15 Different languages: Danish (da), German (de), English (en), British English (en-gb), Spanish (es), Finnish (fi), Filipino most likely (fil), French (fr), Italian (it), Japanese (ja), Dutch (nl), Portuguese (pt), Russian (ru), Swedish (sv), xx-cl. The total amount of tweets recorded in english is 2,823 based on the countif formula in excel. Thus, 94.1% of the data collected for this analysis is in English.
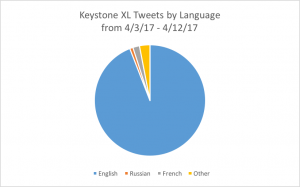
It appears that most of the tweets were in English, which was expected given this issue is residing within Northern America, mostly in the United States. The second most used language was French, accounting for about 3% of the pie chart. This is most likely from the Canadian involvement with the Keystone extension project into Alberta, although I was surprised there was no presence of French Canadian language in the dataset, perhaps there is less Canadian involvement in the past week. I am not quite sure why there is activity relating to Keystone XL in Russian, instead perhaps there is Russians tweeting with one another in their native language within the United States. I am not sure why there are other languages like Dutch, Swedish, Finnish, or Portuguese but I suspect that they may be related to the topic of oil energy as a source and perhaps less about the actual extension project. I find it really cool that there are some very different languages reported to tweet #KeystoneXL, I wonder what contexts each are talking in and why they care. Furthermore, I wonder how intertwined these different languages are, like are they interacting with one another alone or with other English-speaking tweeters?
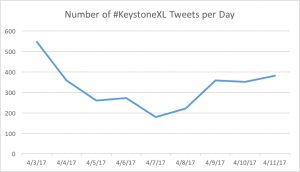
There is a large amount of tweets recorded for April 3rd compared to the rest of the days. In searching through the news I found a ton of articles reporting on the Seattle City Council meeting that occurred that day. A Seattle Times article read that the Seattle City Council casted an unanimous vote “to oppose the Keystone XL Pipeline that the Trump administration signed off on last month and to request that the city’s finance department explore how it might avoid contracting with banks backing the $8 billion project”. Tweets for #KeystoneXL dropped significantly over April 4th and 5th, and a Google News search also resulted in less articles and more insignificant headlines. Most articles reported for these days were further commenting on the the impacts of the pipeline extension, such as “Carbon Footprint of Canada’s Oil Sands is Larger than Thought”. On the 5th however there was an article in the Lincoln Journal Star reported the Nebraska Public Service commission setting a date to review the Keystone XL extension project and host a public hearing “for pleadings, briefs, witnesses and cross examinations by TransCanada’s attorneys and approved interveners” to propel the approval for TransCanada. Although it is reported that no dates are set in stone for public comment but will be closer to the time of the proposed pipeline route. Another decrease from April 6th to the 7th was shown in the graph, as news searches found similar articles reporting the Nebraska public hearing announcement. Most of the news articles found for April 7th generally show a more oppositional theme to the pipeline, like the editorial from the Billings Gazette “Guest Opinion: Trump’s OK can’t make Keystone XL a done deal” or on PennEnvinroment.org titled “Defend the places we love”. Thus it appears that more media releasing opinions about the project’s extension and various involved states on approving the construction has fueled more opinions to be crossfire throughout the Twitter database. Tweets increase again on April 8th as more headlines speak on different sides of the controversial issue. The graph shows a plateau for the 9th, where there were less news about each side of the pipeline issue but there were a good amount of articles pinned on Trump, such as “Busting Donald Trump’s climate Fantasies,” in the Shanghai Daily and “Trump’s ‘Buy American’ Pledge May Be At Risk With His Border Wall” in the Long Island Press. Approaching the 10th and the 11th, there is an increasing amount of news related to Native American protests in North Dakota and lawsuits being made, like “Native American & Environmental Groups File Suit Over Trump’s Keystone XL Pipeline Permit”.
The average tweets per day was found at 325.67, with the median tweets per day found at 352. There was no mode found, but out of the total 2931 recorded for the line graph, the maximum per day was 547 tweets and the minimum was 180 tweets, calculating a range of 367. In terms of the rest of class, I feel like I am getting less tweets per day in general since my topic is pretty narrow, however it seems to fluctuate much more on a day-to-day basis. I think this is mostly due to the Keystone XL project being a hashtag referenced when provoked my the media releasing new articles/information or when the Trump administration and states move towards political acts to push the constructer forward or backwards. Furthermore, I seem to have a significant range given the amount of tweets that I had used for this analysis. Again I credit this large range to the fact that the #KeystoneXL topic fluctuates day-to-day, indicating that when someone has something to say, they will say it. It doesn’t appear to be a popular enough topic for a large amount of people to constantly talk about since its really only relevant as things happen over time.
I used about a week of data and still had less than others, and I credit that to the #keystoneXL to being generally a less tweeted topic as has been seen throughout the semester given my data collection and analysis. However, I think it definitely hits a specific set of populations that invest their time to tweet about things like #KeystoneXL, whatever the context, and speaks a little more clearly about what type of data is being recorded about this topic over time.
Works Cited:
Bacher, Dan. 2017. “Native American & Environmental Groups File Suit Over Trump’S Keystone XL Pipeline Permit”. Cleantechnica. https://cleantechnica.com/2017/04/10/native-american-environmental-groups-file-suit-trumps-keystone-xl-pipeline-permit/.
Beekman, Daniel. 2017. “Seattle City Council Votes To Avoid Banking With Keystone XL Backers”. The Seattle Times. http://www.seattletimes.com/seattle-news/politics/seattle-city-council-votes-to-not-bank-with-keystone-xl-backers/.
Cushion Jr., John. 2017. “The Carbon Footprint Of Canada’s Oil Sands Is Even Bigger Than You Think”. Insideclimatenews.Org. https://insideclimatenews.org/news/04042017/tar-sands-greenhouse-gas-emissions-climate-change-keystone-xl-pipeline-donald-trump-enbridge.
MCKIBBEN, BILL. 2017. “Guest Opinion: Trump’S OK Can’T Make Keystone XL A Done Deal”. The Billings Gazette. http://billingsgazette.com/news/opinion/guest/guest-opinion-trump-s-ok-can-t-make-keystone-xl/article_311ec45b-acc6-5d5d-ae0e-34fee1d820c8.html.
Miller, Christian. 2017. “Trump’s ‘Buy American’ Pledge May Be At Risk With His Border Wall In Propublica”. Long Island News From The Long Island Press. https://www.longislandpress.com/2017/04/09/trumps-buy-american-pledge-may-be-at-risk-with-his-border-wall/.
PennEnvironment,. 2017. “Defend The Places We Love”. Pennenvironment.Org. http://pennenvironment.org/programs/pae/defend-places-we-love.
Sachs, Jeffrey. 2017. “Busting Donald Trump’S Climate Fantasies”. Shanghaidaily.Com. http://www.shanghaidaily.com/opinion/foreign-perspectives/Busting-Donald-Trumps-climate-fantasies/shdaily.shtml.
Star, Nicholas. 2017. “Nebraska Commission Sets Hearing Date For Keystone XL Review”. Journalstar.Com. http://journalstar.com/news/state-and-regional/govt-and-politics/nebraska-commission-sets-hearing-date-for-keystone-xl-review/article_5881efe3-016f-5f9e-88c6-46b52c9e1dcb.html.
It’s hard when you are getting less tweets per day in general since your topic is quite narrow, but it is still cool to see how closely the #KeystoneXL hashtag seems to follow announcements and articles regarding the topic. I think this is evident in your large range of 367, which is a lot when your max was only 547. I wonder if you were able to break down the days by time if you could extrapolate an even CLOSER correlation to media coverage and tweets. It would also be interesting if you were able to compare the “virality” (how viral something is) of the news articles. You could maybe compare the number of shares each of the articles have? There was this really cool app called “BriefMe” that actually had an algorithm for calculating the virality of an article and ranking what was the most viral articles on the Internet throughout the day. They claim they had “the first-ever news ranking system.” The components the algorithm used were how many shares an article had on Twitter and Facebook divided by time. If you could do something like that just for some of the days, it would be really cool to see. Actually now I might do this…
Having the narrow topic you have it makes it incredibly hard to get those tweet and language numbers. #KeystoneXL is a really tough hashtag to have because it is so specific. I thought the points on when these tweets were posted in comparison to when articles came out or when tweets spiked was really fascinating. Keystone has been a really interesting hashtag for me to follow through your project because it is almost been the polar opposite of my #energy hashtag.
I don’t have any cool apps like Ogan, but I do agree that I’d love to see more flux in #KeystoneXL. Obviously that is not your fault, it’s actually quite validating for me to read about your struggles with day-to-day spikes in your hashtag since #standingrock is privy to the same spikes. Also I feel since #KeystoneXL is somewhat in limbo right now, it makes sense that your hashtag would be without a lot of data. I’d love to fast forward a few months and see the direction that your data takes! Also your analysis of the French stemming from Canada is a really cool discovery! Even if it’s logical, I think it is awesome that we have honed our data analysis well enough to read into the data like that. Your average joe would say “oh French – probably tweets form France” yet you dug deeper, and you interpreted your data bearing in mind its complexity.