
After analyzing my data set, I found that I had a total of 34 different languages. These languages consisted of: Ar, bg, ca, cs, da, de, el, en, en-gb, es, fr, he, id, it, ja, ko, lt, lv, msa, nb, nl, no, pl, pt, ro, ru, sk, sr, sv, tr, uk, vi, xx-lc, zh-cn, and zh-tw. Of my 110,181 #ISIS tweets, 82,613 were in English. This means that 74.98, or roughly 75% of all of my tweets were in English.
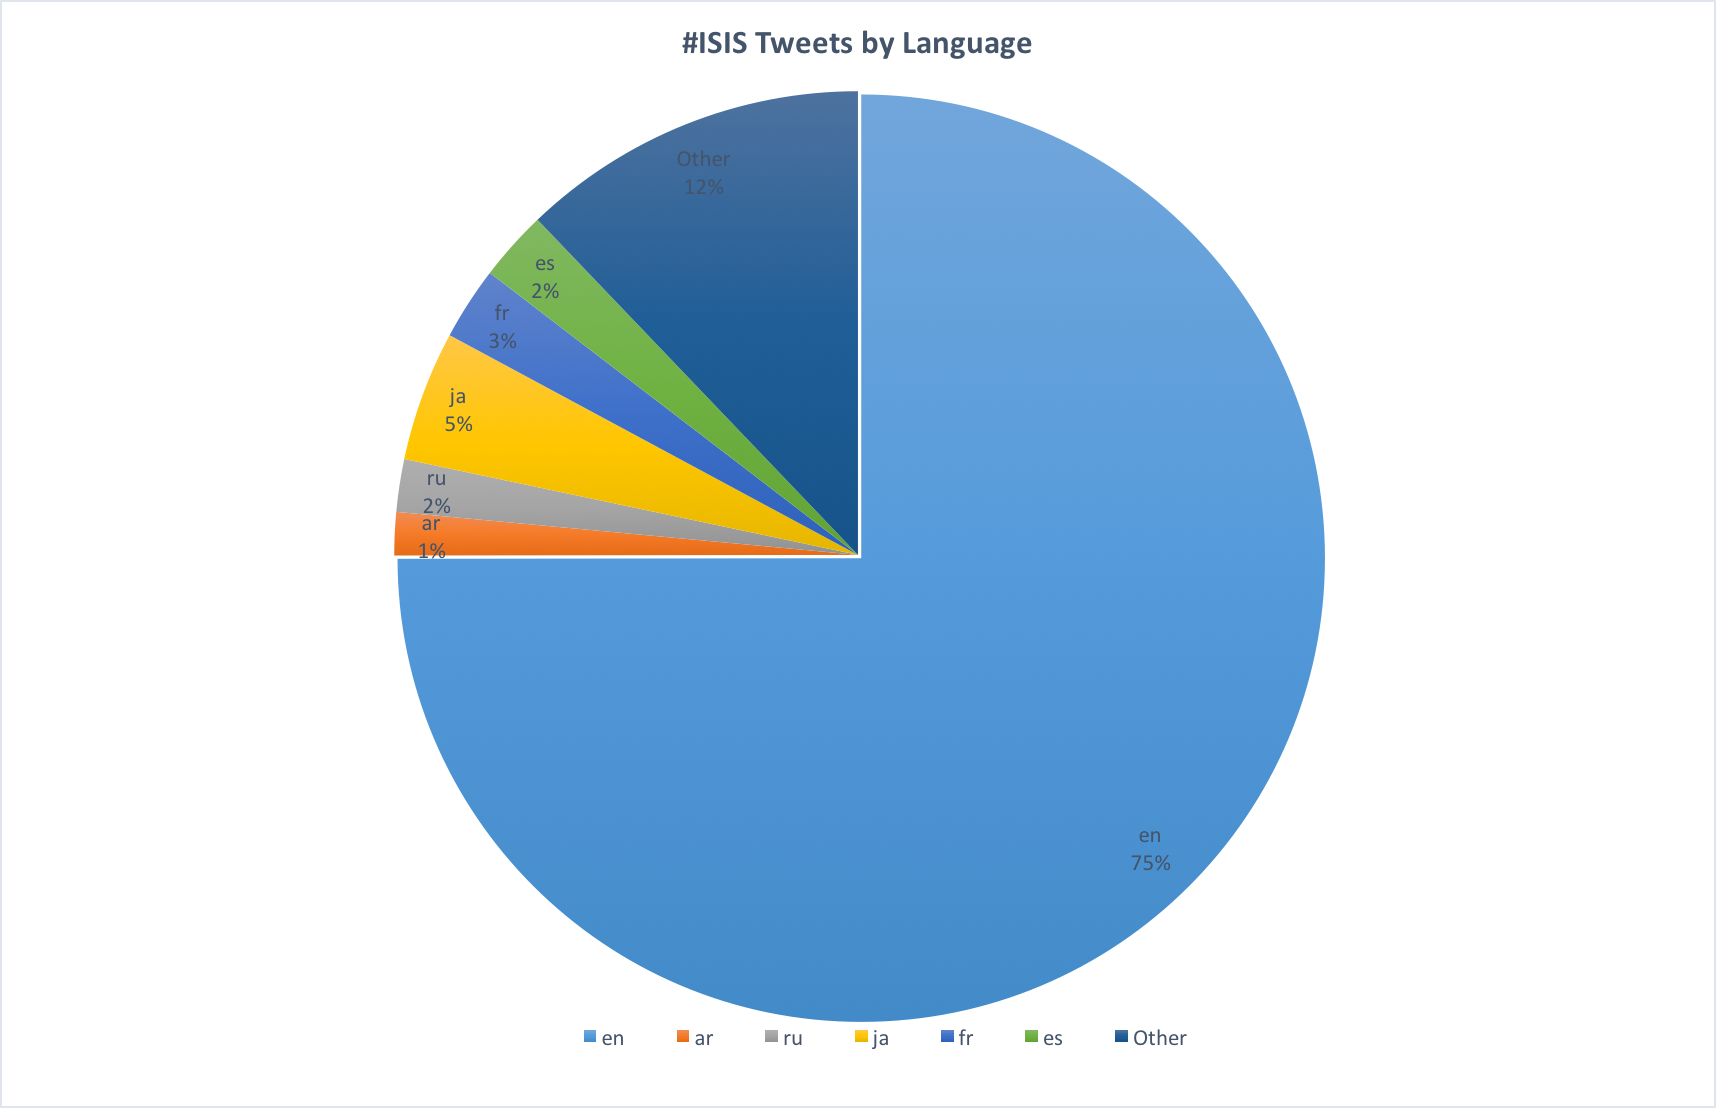
Looking at my pie chart, I was not surprised to find that although there was a clear majority of english tweets, there were also a well distributed number of tweets in other languages. I believe that the high volume of #ISIS tweets in English is largely due to the fact that this is always a hot topic in America, and because there are the highest number of Twitter users in the United States. In addition to this, I believe that there are still a significant portion of tweets distributed over a variety of languages because the topic of #ISIS is prominent globally. Being a notorious terrorist organization, ISIS gets a significant amount of exposure in the media, which leads to people from many different cultures and languages discussing them.
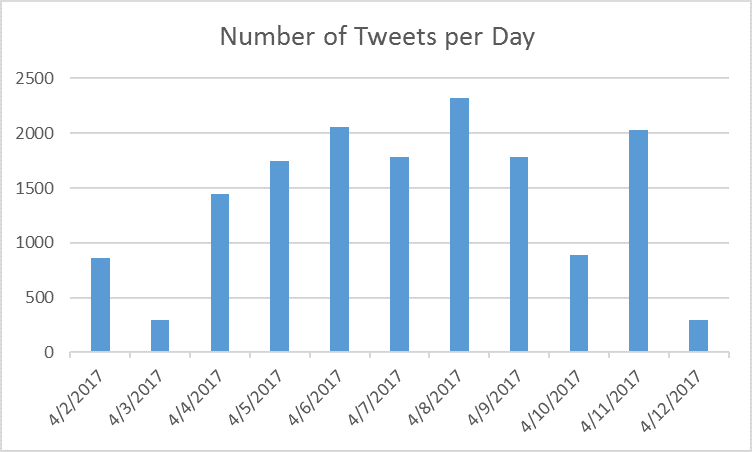
Three current events during this time-span likely explain the rises and falls in the number of #ISIS tweets. On April 6th, ISIS shot down an Iraqi helicopter, killing two pilots in the process. On the same day, ISIS executed 33 people in Syria, their largest mass killing of the year so far. These events made the number of tweets spike on April 6th. On April 8th, reports of U.S. bombing of ISIS in Mosul filled the news. Headlines later that day reported Syrian civilians were killed in these bombings, contributing to the fact that the 8th had the most overall tweets of the days I selected. When looking into the current events during this ten day period, it seemed that there was a news event related to ISIS every single day. This likely explains the consistent nature of the influx of my tweets.
Due to the sheer quantity of my data, I chose to look at the chart over a ten day period to get a better understanding of the ebbs and flows of the tweets. This allowed me to have a more effective visualization of the data, and make associations with current events that would have had an impact on it. Looking at the mean, median and mode of my data, I am not a complete standout from my peers, but there are some differences. One notable difference was that there was a greater relative disparity between the median and mean of my data from the rest of my class. When looking at the mean of a data set, it is the absolute average of all the data collected. In the context of our work, this means that this number averages in all of the data from each date, and it susceptible to a large impact from a day or two of outliers in one direction or another. The median is not impacted by outliers due to the way it is calculated, so in a sense this can often show a more genuine representation of a data set. Because I had two days in which only 297 tweets were recorded, my mean number of tweets shows a lower average than what was typical of my data set. I believe in my case, the median is a better representation of my average tweets because I had two days in which there were only 297 tweets recorded, which was a quarter of what I had recorded on any of the other days. I found this to be particularly interesting, as I often get emails saying that the data recording software used in these labs had failed, leading me to believe that there is a possibility that tweets stopped being recorded at 297 on both of these dates. I also found it interesting that another one of my classmates had a mode of 297, which leads me believe that they had a similar issue.
It is difficult to make an exact analysis on what count of my data set means in the context of the rest of the class, as many of my peers chose different lengths of time to analyze their tweets. Despite this, I was still in the upper half of the class in terms of count. My maximum number of tweets was relatively average in comparison to my classmates, as well as my minimum. What I did notice, however, was that my tweets per day seemed to be more consistent than some of my classmates. I believe this to be due to the nature of my hashtag topic, ISIS. While some of these hashtags will go in and out of discussion, #ISIS will remain popular relatively consistently. I do have spikes in the number of #ISIS tweets, however my tweets do not fall too far out of discussion when there are no ongoing current events related to #ISIS. I believe this accounts for my range, which is relatively average to the class, as my peaks will not create a disproportionate range because #ISIS tweets never slow down entirely.
I believe the most interesting thing that I found from this analysis was how many different languages #ISIS was spoken about in. This shows the truly expansive reach of the topic of #ISIS, something that I had hypothesized would be true but never saw so clearly represented.
Cite:
Moore, Jack. “ISIS Executes 33 in Syria, Its Largest Mass Killing of 2017.” Newsweek. 11 Apr. 2017. Web. 18 Apr. 2017.
Moore, Jack. “ISIS Shoots down Iraqi Helicopter over Mosul, Killing Two Pilots.”Newsweek. 11 Apr. 2017. Web. 18 Apr. 2017.
“Syrian Civilians Killed in Airstrike Allegedly Targeting ISIS.” New York Post. Reuters, 08 Apr. 2017. Web. 18 Apr. 2017.
Jack,
I found it interesting that only 75% of your tweets were in English in comparison to my 89%. The amount of different languages you came across was also different as you had 14 more than me. This makes sense as ISIS isn’t just present in America. I thought you did a great job on the pie chart as it was easy to read and showed the disparity of your data. I also found it interesting that you were able to find that on the days where the most tweets were tweeted lined up with ISIS shooting down an Iraqi helicopter and executing 3 people in Syria. When it comes to the statistics of your data I thought you made a good point that your median is a better representation of your average tweets. I also liked the point you made that #ISIS will remain a popular topic making the number of tweets fairly consisted. I found this to be true for my hashtag also as there was great consistency. I would be interested to see if we have any other similarities in our data. Overall great job on the lab!