Housing in Greater Hartford: Does it Affect Education?
Select suburbs in the Hartford region have seen a significant increase in residents of color over the past twenty years. Our focus for this project will be to explain this shift in housing values and how it affects schools and the neighborhoods where these schools are located.

The Home Index Value Map shows how many homes in Hartford have decreased in value (0.21-0.60). West Hartford has a much higher average home value (1.00-1.49), and Bloomfield, Windsor, East Hartford and Wethersfield all have similar average home values (0.60-1.00).
Hartford and the towns which border Hartford are very unique in terms of racial composition. When you take a closer look at the racial composition of these towns (according to U.S. Census Data): East Hartford is 51.3% White; Hartford is 43.4% Hispanic, Wethersfield is 89.5% White; West Hartford is 79.6% White and Bloomfield is 54.1% Black. These percentages represent a portion of the total population in each of these towns, respectively.
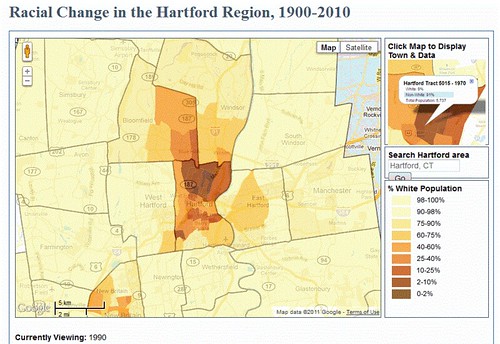
The map (above) shows Racial Change in the Hartford Region in 1990. The darker areas on the map represent concentrated areas where the non-white population is very high.
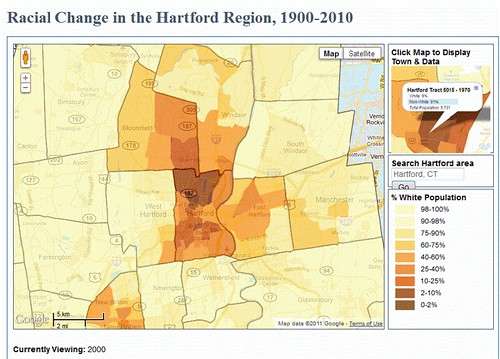
The second map (above) shows the racial composition of the Hartford Region in 2000. Over ten years there has been a significant increase in residents of color. Hartford has the lowest percentage of White population. The White population in Bloomfield is between 2-10% at most, which is the lowest of all of Hartford’s surrounding suburbs.
After examining the maps, it was clear that more and more residents of color began inhabiting Hartford and many of the towns surrounding Hartford, with the exception of predominantly White communities such as West Hartford and Wethersfield. We began to look at sources that could provide more information about these trends.
Explaining the Shift in Racial Composition
According to US Census Data [taken at the time], by 1970, the population in Hartford, CT was down to 158 thousand. In the decades preceding the 1970’s, there was a clear shift in the racial makeup of Hartford’s population. Jamaicans were coming to the city to participate in the labor demand in agriculture, for example. By 1960, the Puerto Rican population in Hartford was around 6,000. The Black population rose significantly as well.
As the city’s minority population grew during the 50’s and 60’s, the whites who formerly resided in these areas were relocating to the suburbs, more importantly, almost entirely all-White suburbs.
“The lowest-income families were concentrated in the largely black North End, while more affluent families were in the western portion of the city near the West Hartford line…” (Weaver 1982: 137).
United States Federal Laws and Policies have also contributed to the decay of poor and minority neighborhoods in Hartford. Racial restrictions on mortgages and housing were
permitted by The Federal Housing Administration until the 1960s.
One factor we considered could have been a causal factor for this shift was Reverse Redlining. “Reverse redlining occurs when a lender or insurer particularly targets minority consumers, not to deny them loans or insurance, but rather to charge them more than would be charged to a similarly situated majority consumer.” [Muhammad & Ehrenreich, 2009]
This was practiced in Hartford and currently, Hartford has the lowest home values in the entire region. With lower home values comes dis-investment in neighborhoods. Banks are replaced with check cash institutions and social services offices. Neighborhoods in Hartford show clear signs of neighborhood tipping, or declining neighborhoods. [Examples of this are front lawns being mostly dirt (no grass) trash scattered on the streets, front or back doors of multi-unit complexes being constantly open (absentee owners), etc.]
Reverse Redlining by lenders and real estate firms and red-lining by banks and other institutions have contributed effectively to the current state of many neighborhoods in the City of Hartford. It is important to note, that you cannot expect residents of any given community to be engaged in said community if others are not.
Researching for the Project
Upon inquiring for information from several Housing authorities both in Hartford and other towns in Connecticut, I was led in the right direction by Sophie Starchman, Family Self-Sufficiency Coordinator of the West Hartford Housing Authority and a graduate of Trinity College.
“Public Housing Authorities are not lenders or insurers. However, we do use Fair Market Rents (determined by the Department of Housing & Urban Development) in Rent Calculations. For instance, if a Landlord requests a rent increase, then their Section 8 Tenant’s Caseworker will complete a Rent Reasonable calculation using FMR (included below), Income Limits, and information from the apartment. Some of the factors that affect the cost of rent for both minorities and non-minorities are: location, census tract, condition, accessibility, unit type, year built, square footage, # of bedrooms and baths, amenities, facilities, and provided maintenance/services. “
In theory, using housing authorities as our starting point was a good idea. One flaw in our preliminary research was that we did not clearly understand the mission of the housing authority before we reached out to them. This is perhaps due to a lack of information on their part, as many of the websites we visited did not discuss the mission of the organization clearly, but rather, listed what they could offer clients.
Next, we emailed the Principals of each of the largest High Schools in the Hartford region (Conard High, Wethersfield High, East Hartford High, Bloomfield High, Windsor High) and asked them about their schools and the neighborhoods where the schools are located. No one replied.
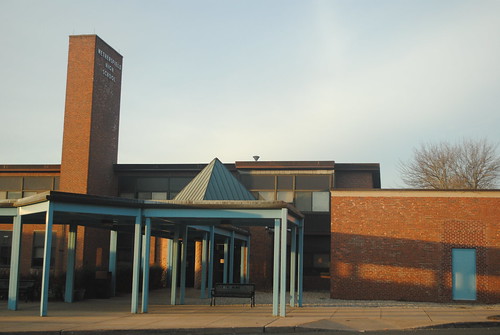
My partner and I decided to take a different approach. We went out into each of the towns surrounding Hartford: Wethersfield, Bloomfield, East Hartford, Windsor and Hartford, and took photographs of the High schools and the neighborhoods where these high schools are located. All of the photographs used in this project belong to us. We did independent research and have cited the scholarly material where we found our information.
In the next section, we will discuss the towns surrounding Hartford, and provide possible explanations for the increase in residents of color inhabiting these areas.
Viewing The Hartford Region
Hartford:
The City of Hartford is the Capital City of Connecticut. In 2010, Hartford was recorded as having a population of 124,775 people. There is a 29.8% White population, a 38.7% Black population and 43.4% of the population were reported as having Latino origin. In Hartford the median household income is $29,190 as opposed to the $67,721 median for the entire state.

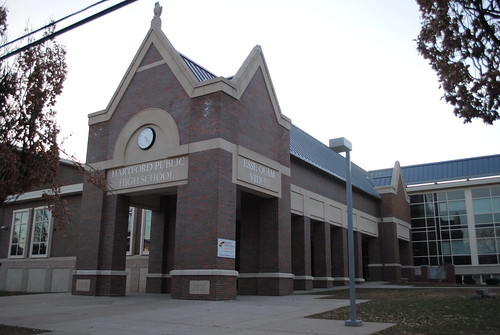
The Hartford Public School system is notorious for being a consistently below average school system. Statewide, the range (%) of students meeting state goal was between 42 and 55 % on the CAPT Test. At Hartford Public High School, the range of students meeting State Goal for all CAPT testing was between 1.9 and 6.6%. Similarly, average SAT scores ranged from 371-387 (out of a possible 800 points) where the Statewide average was between 503 and 507 (out of a possible 800 points).
This is particularly concerning, given the fact that you are given an automatic 200 points on the SAT if you write your name correctly.

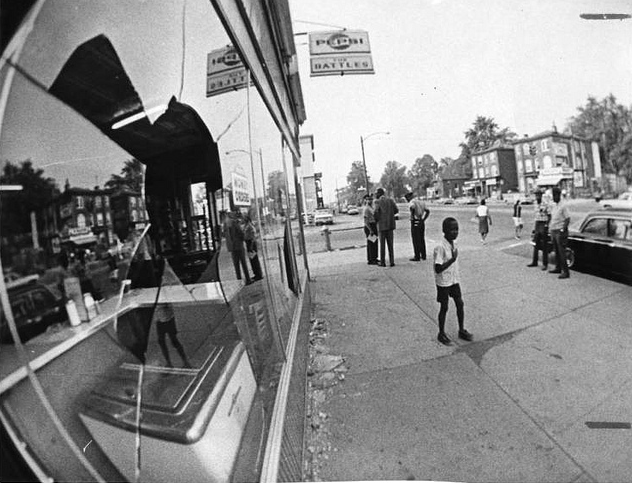
Travel Log: Hartford had much poorer neighborhoods that the other towns we visited. The South Marshall Neighborhood (by Hartford Public High School) was comprised mostly of apartment complexes. On the right side of the street we saw a Habitat for Humanity building site (funded by Trinity College Habitat Club). There were several kids and adults hanging in the neighborhood. Hartford High was the largest school we saw in our travels. Graffiti could be seen in many places around Hartford High and the surrounding neighborhood. Unlike many suburban communities, not everyone in Hartford has access to a painting workshop or a community center. Many youth especially in Hartford use graffiti is a method by which they can express themselves artistically.
Windsor:
Windsor High School presents much diversity. 53.9% of the student body is Black; 31.1% of the student body is White and 10.3% of the Student body is Hispanic. Compared to other schools in surrounding districts, Windsor High has performed proficiently. CAPT scores are much closer to the State average: the range of students meeting state goal is between 28 – 45 % (State Average is between 45 – 60 %) .
Furthermore, the range for SAT scores was between 455 – 470 (of 800 points) compared to the State average of 503-508 (of 800). Graduation rate at Windsor High is 90% (State Average is nearly 92%).
The town of Windsor is a suburb located directly north of the City of Hartford. Windsor is home to four elementary schools, one middle school and one high school. At the time of the last full census survey the number of people in Windsor, CT was 28,237. 65% of the total population is White, while 27% is Black. 5% of the population reported being of Latino or Hispanic origin. The median household income for Windsor is $64,137 putting it right in line with the state average of $67,721.

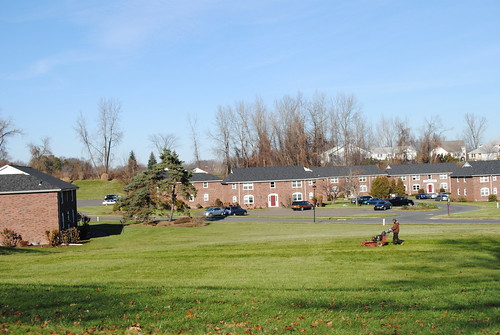
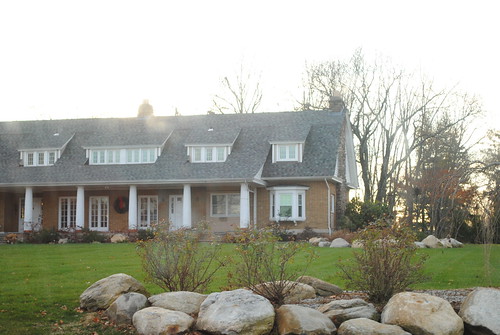
Travel Log: Upon entering Windsor, we saw the town center, which included a post office, banks, shops, a school and a masonic hall. It was clear that the neighborhood was prospering. We had to stop more than once for directions, and ran into a group of teenagers who wanted to lead us in the wrong direction, as we were trying to get to Windsor High School. Eventually, we found someone who lead us to the school. Once we got to the school, we examined the neighborhood. There were for the most part one family homes. It was a quiet suburb, and many of the homes had nice lawns and well kept gardens.
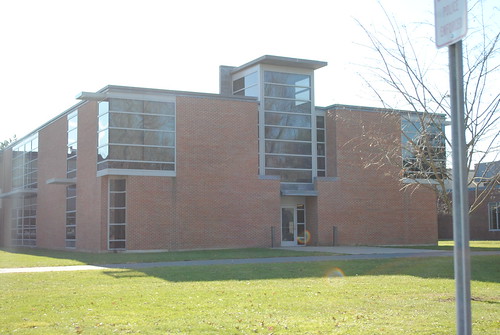
West Hartford:
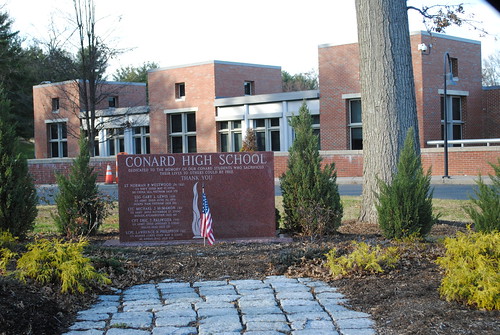
In our research, we examined West Hartford’s Conard High School. Conard is a relatively diverse school, 11% of Conard’s students are Black and 18.5% of students are Hispanic. Conard also has a size-able Asian community rounding out at 10%. The school’s graduation rate is 95% and it’s CAPT and SAT scores are above the state average. Conard continues to maintain an outstanding reputation. As recognized in Newsweek magazine, Conard is rated in the top 1% of American high schools for the number of Advanced Placement (AP) and college credit courses offered, exams taken, as well as its efforts to prepare students for the AP exams.

In the 1940’s, West Hartford included many neighborhoods which were racially restrictive covenants. Racially restrictive covenants refer to contractual agreements that prohibit the purchase, lease, or occupation of a piece of property by a particular group of people, usually African Americans. This practice became common in 1926 after the U.S. Supreme Court decision, Corrigan v. Buckley, which validated the use of said covenants. In towns such as West Hartford, racially restrictive covenants were used to concentrate the “wealth” and a certain population/racial group in particular neighborhoods.
Ms. Mary Everett moved into the Ledgewood Road neighborhood in West Hartford, Connecticut in the 1970s (formerly a racially restrictive covenant from the 1940s). In an interview conducted by the Cities, Suburbs and Schools project, Mary reflects on racially restrictive covenants, the changing racial composition of the population in West Hartford and the many years she has spent living there.
Bloomfield:
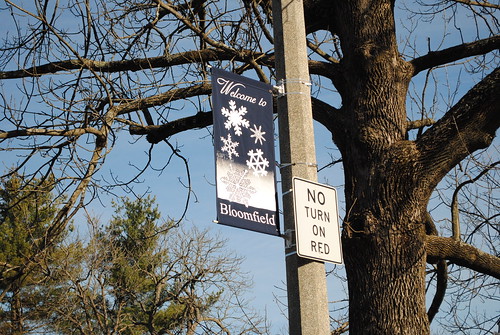
Bloomfield is a suburban area north of Hartford and West Hartford. Bloomfield is a smaller town with a population of around 19,587. The White population for the town of Bloomfield is around 40% while the black population is about 54%. Only 3.7% of Bloomfield’s populati on has reported being of Hispanic or Latino origin.
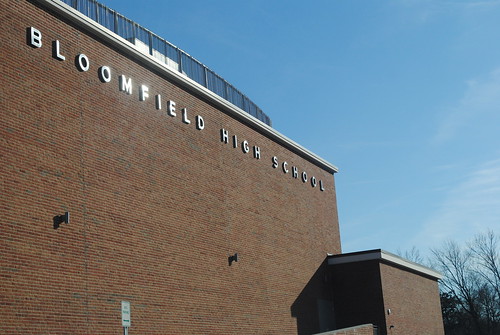

88% of all students at Bloomfield H ig h School are Black. The only statistic that Bloomfield High School has in common with other schools in the State of Connecticut is the Graduation rate. The rate for Bloomfield High School is 91.2%, and the rate for the entire State is 91.3%. According to the most recent research on Bloomfield High School, conducted by the State of Connecticut Department of Education, Bloomfield High was performing at a significantly lower rate than other schools in the State in terms of Standardized test performance. Students at Bloomfield who took the Connecticut Academic Performance Test (Grade 10) were among those students performing below par. In Reading Across the Disciplines, 14% of Students met the State Goal, compared to 45.9 % Statewide. In Mathematics, 18.2% of students met State Goal compared to compared to 48.7% Statewide.
As for the SAT 1, the average score for the School in Mathematics, Critical Reading and Writing was 380, 402 and 403 (out of 800) respectively. The State’s average score ranged significantly higher, 508 in Math, 503 in Critical Reading and 506 in Writing.
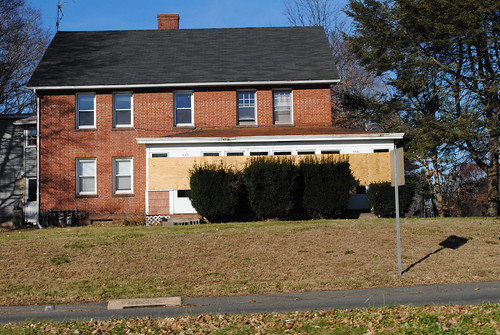
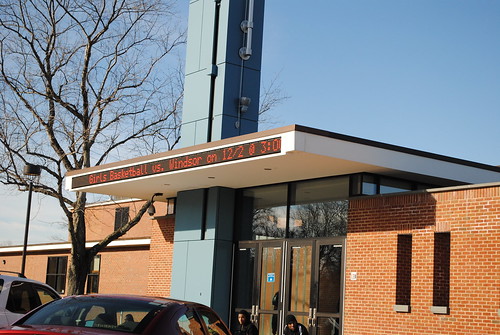
Travel Log: Bloomfield had many rural areas with shopping centers scattered in between. We visited Bloomfield High School which was right across the street from a vacant plot. The neighborhood surrounding BHS had several vacant plots as well, and a few dilapidated homes, as well as a few boarded up buildings, but that was only in the immediate neighborhood. A few minutes north of the school, we found a thriving Town Center, and many one and two family homes. This was one of the only towns we visited where we saw many teenagers/children walking up and down the streets.
East Hartford:
East Hartford has a population of 51,252 people and it resembles a miniature city much like West Hartford. Only 51.3% of the people in East Hartford are White and 26% of the population is black. 25.8% of the population are persons of Latino origin.
The median household income in East Hartford is $48,7 47 which falls below the state average of $67,721.

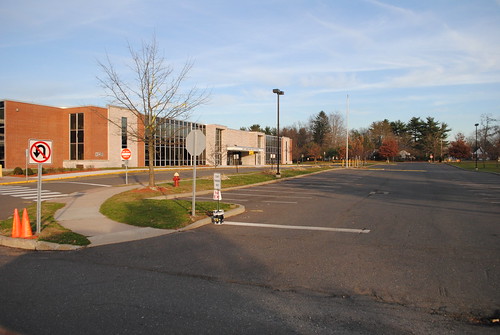
SAT 1 scores were more comparable to the State Average at East Hartford High School. In the subjects of Mathematics, Critical Reading and Writing, the School averages were 432, 435, and 446 (out of 800) respectively. The State scores were 508 in Math, 503 in Reading and 506 in Writing.
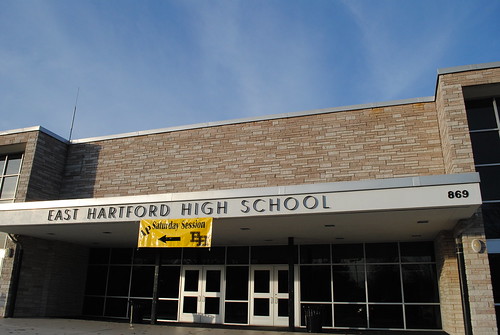
Travel Log: East Hartford High School was the hardest school to find. We did at least three loops on Forbes st. before finding it. Upon reaching the school, we immediately saw that EHHS was connected to another school, CIBA, the Connecticut International Baccalaureate Academy, separated only by a bridge. The school was empty and the neighborhood surrounding it was as well. The immediate neighborhood was comprised of one family homes, only.
Wethersfield:
Wethersfield is a small suburb to the south of the City of Hartford. Wethersfield has a population of 26,668 people. 89.5% of people in Wethersfield.
The median household income is $70,525 which is just above the state average of $67,721. are White and only 3.1% are Black. Around 8.2% of the population is of Latino origin.
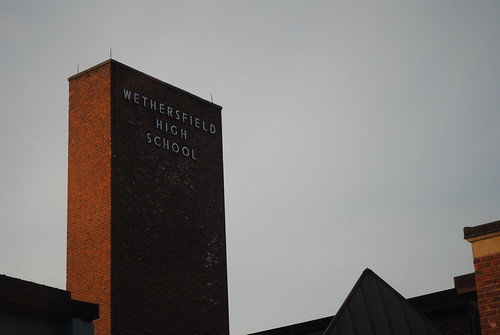
More than 3/4 of the Student body at Wetherfield High School is White (76.1%). Wethersfield High School has met and exceeded the State average in terms of both SAT scores and CAPT scores. The range for SAT scores was 515-532 (State range: 503-508) and for CAPT scores the percentage range of students meeting state goal was between 53 and 71%.
Travel Log: My partner and I both knew exactly how to get to Wethersfield High, because we both took the SAT’s there. Many of the homes in the surrounding neighborhood are one family homes, and were closer together than in other towns (smaller plots). We saw many people walking around the town, walking their dogs, and chatting up their neighbors. It was clearly a different type of community than the previous towns we visited.
CONCLUSION:
The following graphs show the Median Household Income and the Average SAT Math Scores for the six towns that we visited. When these two graphs are placed side by side you are able to see the direct correspondence between Income and Success in Education.
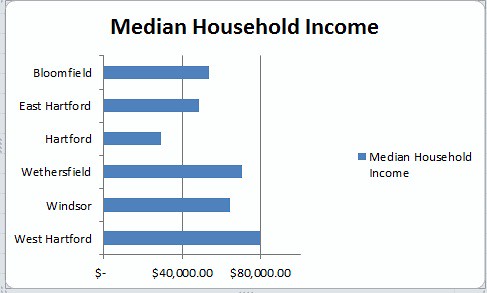
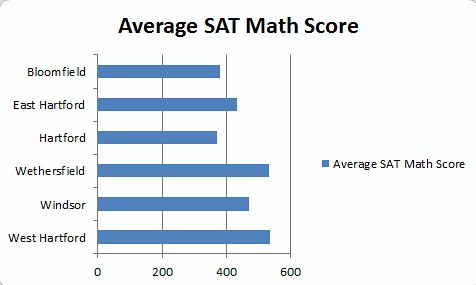
Our travels provided us with a glimpse of what the Greater Hartford area has to offer. There is a lot of diversity in Hartford and it’s suburbs. On our road trip we noticed that not every suburb was created equally and that there is a lot of economic inequality throughout the region. Over the past 30 years the racial composition of the Hartford region has changed tremendously and that racial change is a direct result of housing affordability. Where you can afford to buy a home has a direct correlation with the education that your children are afforded.
Sources:
Everett, Mary. Oral history interview on West Hartford, CT and restrictive covenants (with video) by Candace Simpson for the Cities, Suburbs, and Schools Project, July 21, 2011.Available from the Trinity College Digital Repository, Hartford Connecticut (http://digitalrepository.trincoll.edu/cssp/).
Ehrenreich, Barbara; Muhammad, Dedrick (September 13, 2009). “The Recession’s Racial Divide”. The New York Times. (http://www.nytimes.com/2009/09/13/opinion/13ehrenreich.html?pagewanted=all)
“US Census Bureau: Hartford County.” State and County Facts. Web. 02 Dec. 2011. (http://quickfacts.census.gov/qfd/states/09000.html).
“State Department of Education – CEDaR.” SDE Portal. Web. 04 Dec. 2011. (http://sdeportal.ct.gov/Cedar/WEB/ct_report/CedarHome.aspx)
.
Weaver, Glenn. 1982. Hartford: An Illustrated History of Connecticut’s Capital. Windsor
Publications, Inc.
Wilson, William Julius. 1996. When Work Disappears: The World of the New Urban Poor.
New York: Vintage Books.