In early January of 2002, President Bush signed the No Child Left Behind (NCLB) Act of 2001 into law after an amazingly short eight months of deliberation time in the House of Representatives. The NCLB Act was education reform legislation that endeavored to improve individual students’ outcomes by means of setting very high goals and using state-wide standardization of testing to attain more clear-cut results. However, in its requirements of homogenized education, the NCLB Act is lacking in its consideration of the so-called “achievement gaps” in education, regarding race, income, and special education needs. The state of Connecticut provides a unique context in which to demonstrate how the NCLB Act exacerbated these achievement gaps.
Average Yearly Progress⎯An Accurate Indication of Progress, or an Educational Divide?
At the core of the NCLB Act was the concept of Adequate Yearly Progress (AYP), a binary statistical parameter which is an indication of a school’s annual “status”: if its test scores were higher than those of the previous year, it “made the cut,” so to speak, and made Adequate Yearly Progress. However, if its test scores are unimproved, it fails AYP standards. Schools that fail AYP for more than one year face federally mandated improvements which increase in severity as AYP failures accumulate, ranging from forced redevelopment plans to turning the school over to federal or private control.
In Connecticut, specifically in the Greater Hartford Region (GHR), educational disparities have always been thoroughly studied and combated. The GHR has long been a hotspot of educational negotiations, particularly given its turbulent history of school districting, stark suburbanization and white flight, and very clear concentrations of wealth. Richard Blumenthal, then the Attorney General of the state, has called Connecticut “the national leader in the effort to improve educational achievement, close achievement gaps, and increase accountability.” To attain its schooling goals, the state developed the Connecticut Mastery Tests, which Blumenthal called “a tool which has been strengthening educational quality and narrowing accomplishment disparities.”
Please examine the two interactive maps below. The first map shows the each district’s percentage of schools that are below “proficient,” a score set by the state’s Department of Education after a careful consideration of Connecticut’s demographics, teaching methods, and local curriculum at the end of the 1998-1999 school year. The second map shows the number of AYP failures in each district in the ten-year period since the NCLB Act’s legalization, from 2001 to 2011; since AYP failures are cumulative, the map essentially shows each district’s “rating” at the year 2011. Both maps use the Connecticut Mastery Test as for scores, since the Act allows each state to devise its own standardized testing procedure; Connecticut retained its Mastery Tests. Although the two maps use two different types of academic failure variables, they have been calibrated to the same scalar range; thus shading is comparable between maps as an indication of the magnitude of failure.
Percent of Schools Below Proficient by District 1999
Key: Darker red indicates a greater percent below proficient. Data source: CT Dept. of Education.
Number of AYP Failures by District 2001-2011
Key: Darker red indicates a greater number of AYP failures. Data source: CT Dept. of Education.
The relationship between the two maps reveals that educational disparities have indeed worsened since the 1999 school year. In the 1999 map, one can see a general concentration in central GHR, with pink regions scattered throughout. There is no region that does not have a percentage of schools in which improvement is needed (Don’t be shy⎯go ahead and click on each town!). In the 2011 AYP Failure map, it is clear that not only are the central towns still in need of serious improvement, but also the overall number of dark red, “in trouble” districts has increased. This is the least of it, however. The AYP Failure map also depicts some districts that are curiously devoid of color and have zero AYP Failures. The change between the two maps indicates that there has been a polarization of educational failure⎯indicated by the concentration of red in the districts of the GHR⎯during the years since the enactment of the NCLB Act. Why have the Greater Hartford Region’s scores become so internally contrasting? The answer lies within the NCLB Act’s policy, or lack of adequate policy, on important achievement gap variables: minority groups and income.
The NCLB Act and Minority Groups
The effects of state-wide standardized testing come with its pros and cons. One of the reasons it was adapted to facilitate the collection of scores; simply put it requires less work by the administration. This came with several educational costs, however. One was the loss of specialized testing and informal teaching methods that cater to the needs of those that are not within the majority. Another was an explicit exclusion of minority groups in its measurements of AYP data.
There are two interactive maps below. The first is the same 2011 AYP failure map. The second shows the percent non-White in the GHR, based on 2010 census data; it is consistent with the historical patterns of White-flight and suburbanization and depicts a heavily non-White urban core of Hartford with a White suburban ring surrounding it.
Number of AYP Failures by District 2001-2011
Key: Darker red indicates a greater number of AYP failures. Data source: CT Dept. of Education.
Percent Non-White by District 2010
Key: Darker green indicates a higher number of non-Whites. Data source: U.S. Census Bureau.
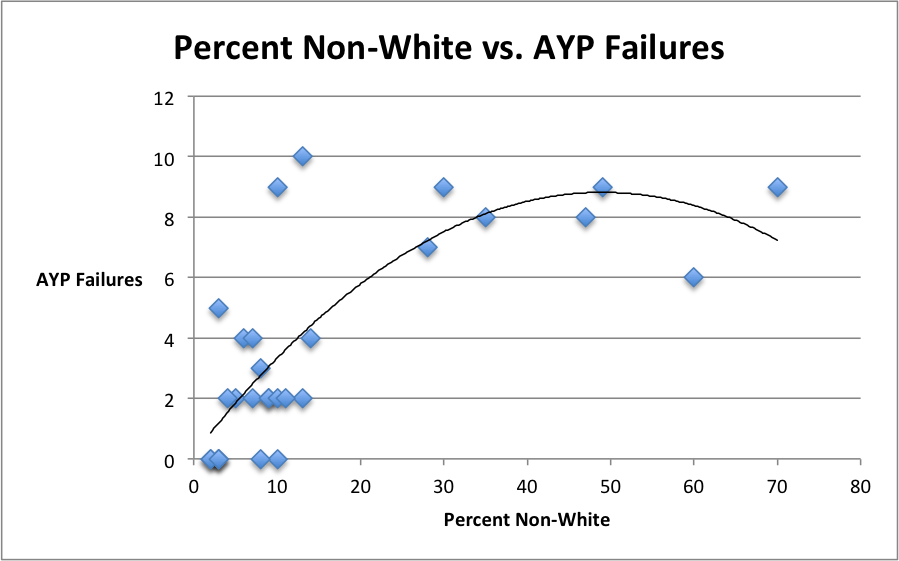
Visually speaking, there is no clear connection. It can be said the heavily non-White urban core has a poor AYP rating, true, but this offers no explanation of dark red regions like Bristol or Enfield, which have low concentrations of non-Whites, or the numerous districts with low levels of non-Whites that have poor AYP ratings. This is reflected in the trend line of the scatter plot, which shows a high concentration of poor AYP scores (high AYP failures) in districts with lower non-Whites. The trend line even begins to come down in areas with extremely high numbers of non-Whites. Thus it cannot be said that the percentage of non-Whites directly correlates with poor AYP ratings. However, there is a pattern that is less immediate: the districts in the 2011 AYP failure map that have zero AYP failures and have no shade of red all have non-White percentages of ten or less. An investigation of this relationship reveals a dynamic of the NCLB Act that encourages a disregarding of small minority groups.
The U.S. Department of Education states that “NCLB did not identify the major racial or ethnic groups for states but instead called upon states to make this determination based upon demographic factors within their state borders.” The NCLB also sets a “minimum group size” of a racial subgroup for inclusion within the statistical confidence interval; in Connecticut schools the number is 50. In other words, racial subgroups with a number of individuals less than 50 will not be counted in AYP scores in Connecticut schools. Since schools have a strong incentive to minimize AYP failures or face budget cuts or federal intervention, and small minority groups do not contribute to the AYP count, there is less of a reason for teachers to focus their efforts on these smaller groups; instead they concentrate on improving the scores of the majority whose scores “matter.”
Gershberg and Hamilton (2007), professors at The New School’s Milano Graduate School for Management and Urban Policy in New York, assert that “Given the diversity of the way schools are organized, current research casts strong doubts on the ability of such tests to consistently evaluate a school’s progress. Worse, testing tools get less reliable when disaggregated by the subgroups of concern in NCLB. In particular, small schools and schools with relatively small groups of different kinds of students pose nearly intractable statistical problems” showing that this issue is indeed recognized as problematic. Their argument calls the Bush Administration’s policy on race “schizophrenic and unprincipled”, citing two cases in the early 2000s involving the University of Michigan and an energy policy, both of which suggested that the Administration’s policies were supportive of even the most obscure of minority groups. The complete disregarding of minorities in the NCLB Act certainly gives weight to Gershberg and Hamilton’s description.
To view Gershberg and Hamilton’s article: http://www.csmonitor.com/2007/0205/p09s01-coop.html
The NCLB and Money: Income, Funding, and Other Monetary Disparities
Another way in which the NCLB Act was harmful to the achievement gaps of education in Connecticut was in matters concerning money. The Act encouraged an association between richer school districts and better educational quality by issuing unfunded, unrealistic mandates, and setting harsh penalties for AYP failures. The two interactive maps below show the number of AYP failures in 2011, and the per capita income of the GHR, based on 2010 census data. Per capita income is calculated by dividing the mean income of the district (as an economic whole) and dividing that value by the number of individuals in that district; it is a useful indication of the aggregate affluence of the district as a whole. Darker blue indicates greater wealth.
Number of AYP Failures by District 2001-2011
Key: Darker red indicates a greater number of AYP failures. Data source: CT Dept. of Education.
Per Capita Income 2010
Key: Darker blue indicates a higher per capita income. Data source: U.S. Census Bureau.

The relationship between AYP failures and per capita income in the GHR’s districts is clear-cut: more affluent towns have less AYP failures. This is reflected in the trend line of the scatter plot: a steady, negative slope representative of the inverse relationship between AYP failures and per capita income. Because of the cutbacks schools faced with AYP failures, they started to take on an “every school for itself” policy, and only the richer schools could afford the best-trained teachers. The threat of the NCLB Act’s punitive policies set schools against each other, whereas before the Act Connecticut, as Blumenthal described it, “was at the forefront” of eliminating income-based disparities, and had implemented inter-district educational components, such as magnet schools, student exchange programs, and culture-specialized curriculums. With the standardization of testing and installation of harsh retributions if Adequate Yearly Progress was not met, only the wealthier districts were able to afford meet the NCLB’s unrealistic goals.
The effect of income disparities on education in Connecticut reached a breaking point in April of 2005, when Connecticut became the first state to challenge the NCLB Act’s educational mandates in a lawsuit filed by Richard Blumenthal, the state’s Attorney General. Blumenthal stated that the “NCLB specifically forbids unfunded federal mandates, saying that the federal government cannot compel states ‘to spend any funds of incur any costs not paid for under this act’ to comply with the statute’s mandates (No Child Left Behind Act of 2001, 20 U.S.C. A Section 7906a). In other words, the law clearly states that the federal government may not impose on states new or additional spending as a cost of compliance.” Simply put, the government issued demands without providing additional funding, forcing poorer districts at a steep disadvantage for meeting the additional testing and teaching protocols implemented by the act.
Unfortunately, the case was overturned by the U.S. Department of Education less than a month later, with the a denial letter that suggested that “Connecticut pay for the additional tests by diverting federal funding from critical supplementary educational programs,” programs which Blumenthal described as “designed to raise achievement among poorer students” and “thereby jeopardized one of NCLB’s primary purposes.” This regrettable turn of events represents a grave infraction of the government’s ruling and reveals how the lack of appropriate funding in the NCLB Act led to income disparities in the Greater Hartford Region, and no doubt in states beyond Connecticut.
To view Blumenthal’s appeal: http://her.hepg.org/content/4376tv744602288m/fulltext.pdf
Conclusion
Since its enactment in 2001, the No Child Left Behind Act has been a contentious issue that has caused measurable inequalities in achievement. I remember the legalization of the law, and, though I was but a third grader, I have a recollection of walking past my school’s teachers’ lounge and hearing them talking about something they called “Every Child Left Behind.” The resounding American promise of equal education opportunities regardless of race or income promises an attempt to minimize any disparity. The NCLB Act’s policies run counter to this pledge. Its “minimum group size” when determining AYP marginalizes minorities and gives less of an incentive to teach them properly. The government’s refusal to provide funds for NCLB mandates despite explicit wording in the Act forbidding this has widened the rift the affluent and the lower-income students. The harsh penalties for failing to meet unrealistic AYP standards have compounded the problem in both the race and income achievement gaps.
As of 2011, the NCLB Act has taken major hits from educational groups, civil rights advocates, and various other egalitarian factions; it has become somewhat fragmented and obscured. The Obama Administration has also implemented other sweeping educational legislation that have taken into account the failings of the NCLB, including the drawbacks of widespread standardization, unrealistic goals, and severe punishments for failure. If nothing else, the NCLB Act’s failings have provided insight into building better educational policy.
About the Author:
Daniel Luke is a sophomore at Trinity College and a Psychology Major, with a triple minor in Urban Studies, English Literature, and Law. He was born and raised in Honolulu and hopes to pursue a career wandering somewhere in the field of law. He enjoys hiking, reading, and surfing the net in his free time.
References
Blumenthal, Richard. “Why Connecticut Sued the Federal Government over No Child Left Behind.” Harvard Educational Review (Volume 76, No. 4), Winter 2006.
Aspey, Susan; Chad, Colby and Smith, Valerie. “Fiscal Year 2007 Budget Request Advances NCLB Implementation and Pinpoints Competitiveness.” U.S. Department of Education: Accessed 5 December 2011.
Gershberg, Alec Ian and Hamilton, Darrick. “Bush’s Double Standard on Race in Schools.” The Christian Science Monitor: Accessed 5 December 2011.
Aspey, Susan. “Charting the Course: States Decide Major Provisions Under No Child Left Behind.” U.S. Department of Education: Accessed 5 December 2011.
Demographic data and CMT scores were collected, respectively, from the websites of the U.S. Census Bureau and the Connecticut Department of Education archives.

