See an updated version of this essay on “Federal Lending and Redlining” in http://OnTheLine.trincoll.edu.

The contemporary racial isolation in the Hartford metropolitan region, similarly to metro areas across the country, undoubtedly stems from a mixture of past and present policies. Past policies, promoted by both private and federal interests, encouraged racial segregation. Despite the fact that explicitly racist policies no longer exist, their legacy often perpetuates inequality. A practice that appears outwardly benign, such as local zoning codes, can maintain historical inequality due to the outcomes created by racist policies in the past. Of all the historical housing barriers faced by ethnic minorities in America, “redlining” is perhaps the most talked about, and for good reason. Redlining is the nickname for the way in which banks evaluated the security of a property value for a loan transaction. This often resulted in downgrading investments in particular neighborhoods due to the way racial and socioeconomic status were used as criteria for determining desirability. Redlining practices played a prominent role in shaping the demographic patterns of cities and suburbs across the U.S.
Formation of the Home Owner’s Loan Corporation: Rating Neighborhood Investment Risks
The Home Owner’s Loan Corporation (HOLC) was established through President Franklin D. Roosevelt’s New Deal Legislation in 1933, as a way to combat home foreclosures during the years of the Great Depression.[i] What is critical to understand is that the HOLC created residential security maps to assess the “trend of desirability” in residential areas in Hartford and over 200 other cities during the late 1930s.[ii] In other words, the HOLC set out to evaluate the insurance risks of homes in order to direct the underwriting criteria of the Federal Home Loan Bank (FHLB) and to provide a detailed guide for the contemporary and future mortgage loan investment decisions of all the newly regulated financial institutions engaged in home mortgage lending.[iii] The major issue is that the HOLC utilized the racial and socioeconomic composition of residents as criteria to determine whether neighborhoods were safe and stable investments for loans, rather than solely focusing on physical property conditions as the deciding factor. For example, a 1937 HOLC appraisal report for a tract of land near downtown Hartford describes the neighborhood as a “slum area now mainly occupied by Negros.”[iv] The appraisal also identifies the residents of this area as predominately “laborers or domestics” and estimates the average annual family income to be around $1,000.00.[v] This report exemplifies the role of race and class in the HOLC rating system – the neighborhood was given the lowest possible rating (Grade D).

HOLC Residential Security Map of Hartford Area 1937
The HOLC created color-coded maps that delineated four grades of housing – green being the highest rated, followed by blue and yellow respectively, while red was reserved for the lowest grade of neighborhood, hence the term “redlining”. This mapping system represents an institutionalized barrier to equal access to property and loans because the Federal Housing Administration (FHA) and private lenders had adopted similar policies and maps in their own underwriting manuals, thus influencing their lending decisions in a racial manner as well. For instance, in the 1936 FHA Underwriting Manual, there are references to “inharmonious racial groups” or “incompatible racial elements” causing decreased value in a neighborhood.[vi] Essentially, the FHA was acknowledging that the presence of ethnic minorities in a mostly white neighborhood was an adverse influence that would damage property values.

The Relationship Between Race and Redlining in the Hartford Region
In the year 2000, West Hartford’s population consisted of about 17% minorities; Hartford’s minority population was recorded at 81%, making it a minority-majority city by a wide margin.[vii] An examination of the Federal HOLC “Redlining” Map from 1937 (shown above) helps to illuminate how two adjacent districts became strikingly racially polarized over the course of about 60 years. It is helpful to compare this map to the 1940 map of Racial Change in the Hartford Region (shown below). The comparison reveals two obvious conclusions: First, the region is overwhelmingly white. Second, the two census tracts in Hartford with a substantial black population, tract eight and nine, are both neighborhoods that were redlined by the HOLC.
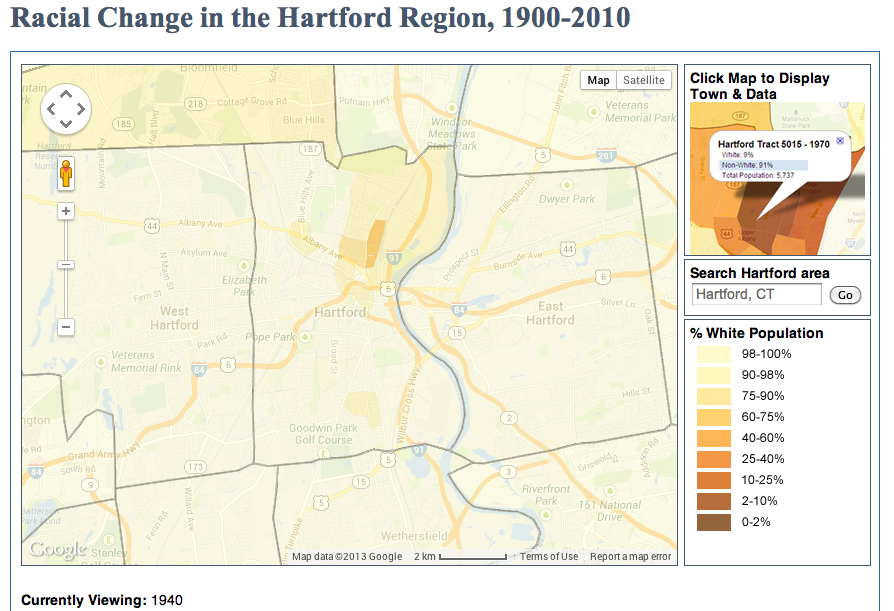
Racial Change in the Hartford Region, 1940
The Hartford neighborhoods that were redlined were also located in slum areas. So, was this low rating due primarily to race, or the poor quality of the housing? The answer is that both factors most likely played a major role, however, a comparison between two areas with similar physical factors, but racial differences provides evidence that a neighborhood’s HOLC rating could be substantially affected by the presence of an “inharmonious racial group”. Through an examination of HOLC appraisal reports, it is apparent that area B-5 (North End of Hartford) and area C-9 (South End of Hartford) were neighborhoods with similar physical character in 1937. Both neighborhoods predominately consisted of two family houses that were 15-20 years old, in fair-good condition, and in a comparable price range. Even the socioeconomic breakdown of the two neighborhoods was close; B-5 had an estimated annual family income of $1,800.00 and up, while C-9 was estimated at $1,500.00 and up. However, area B-5 was rated “blue”, while area C-9 received a “yellow” rating. This difference in rating can most likely be attributed to the racial composition of the neighborhoods. Both had a small population of Italians, but area B-5 had no black population, while area C-9, although slight (approximately 1%), contained a black demographic. One remark from the appraisal of C-9 acknowledges this, “The Negro families are confined to Roosevelt Street. Lenders suggest caution in the selection of loans.”[viii] This demonstrates that the HOLC rating system focused as much on racial composition as it did on the physical quality of neighborhoods.
The Legacy of Racialized Housing Barriers
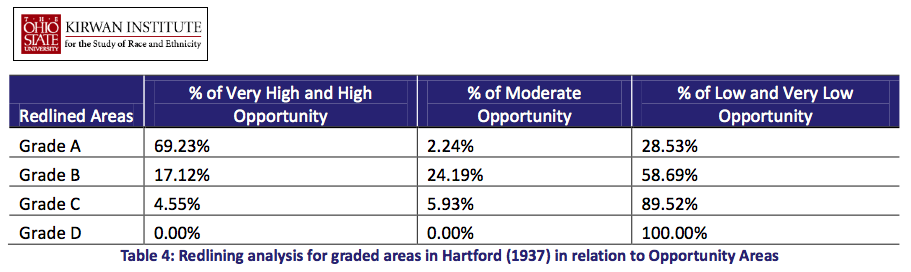
The Fair Housing Act of 1968, which is title VIII of the Civil Rights Act, made redlining on a racial basis an illegal practice. Yet, this did not mean lending institutions were expected to approve all loan applications. There is evidence that redlining continued in the Hartford region as late as 1977, manifesting itself as a systematic disinvestment of urban properties by banks and insurance companies.[ix] Redlining had serious ramifications for minorities in cities like Hartford. The racialization of space through real estate marked a shift from use-value to market-value, giving property a value that could grow or decline partially based on the racial composition of a neighborhood. New data has reinforced the fall-out caused by redlining. It shows that the neighborhoods redlined in the 1930s are now the areas of lowest opportunity in Hartford.[x] These high poverty areas are a result of past disinvestment caused by an undesirable status that was racially motivated. In the end, it is clear that simply outlawing racist policies of the past does not necessarily fix the damage that has already been done.
[i] Home Owners’ Loan Corporation, United States, Federal Home Loan Bank Board and Federal Savings and Loan Insurance Corporation, (1933), Federal Home Loan Bank Board, Home Owners’ Loan Corporation, and Federal Savings and Loan Corporation Annual Reports: 1933, accessed Oct 5, 2013 from FRASER, http://fraser.stlouisfed.org/docs/publications/holc/1933_annualrpt.pdf
[ii] University of Connecticut Libraries Map and Geographic Information Center – MAGIC (2012), “Federal HOLC “Redlining” Map, Hartford area, 1937,” accessed October 5, 2013 http://magic.lib.uconn.edu/otl/doclink_holc.html.
[iii] James Greer, “The Home Owner’s Loan Corporation and the Development of the Residential Security Maps,” in Journal of Urban History 39, no. 2 (2013), 276.
[iv] Home Owners’ Loan Corporation, “Residential Security Map and Area Descriptions, Hartford-West Hartford-East Hartford, Connecticut”, (1937), Box 64, City Survey Files, Record Group 195: Records of the Federal Home Loan Bank Board, National Archives II, College Park, Maryland, available from the Trinity College Digital Repository, Hartford, Connecticut (http://digitalrepository.trincoll.edu)
[v] HOLC, “Residential Security Map and Area Descriptions,” Area D1.
[vi] United States, Federal Housing Administration, Underwriting manual: underwriting analysis under title II, section 203 of the National housing act (Washington, 1936)
[vii] Town of West Hartford Planning and Zoning Commission, 2009-2019 West Hartford Plan of Conservation and Development, 14.
[viii] HOLC, “Residential Security Map and Area Descriptions,” Area C9.
[ix] Education/Instruccion, Fair Housing At Its Worst: Redlining in Hartford Connecticut, report 9 (Hartford, 1977), 179. available from the Trinity College Digital Repository, Hartford, Connecticut (http://digitalrepository.trincoll.edu)
[x] Jason Reece et al., People, Place, and Opportunity: Mapping Communities of Opportunity in Connecticut: A Report Commissioned by the Connecticut Fair Housing Center (Kirwan Institute for the Study of Race and Ethnicity, The Ohio State University, 2009), 16.
Excellent lead image! It effectively and memorably supports the points being made in your opening paragraph—and introduces readers to a relevant piece of primary source evidence. To complete the caption’s source information, provide the date (or “n.d.” if none is given) and list the archives or personal collection in which the material is held. A particular strength of the entry is that it introduces readers to the complex concept of institutionalized racism in a comprehensible manner by skillfully utilizing this local example to make abstract ideas concrete. There are a few spots where the language needs to be more precise in order to communicate your desired meanings. For example: “Essentially, the FHA was acknowledging that the presence of ethnic minorities in a mostly white neighborhood was an adverse influence that would damage property values.” This formulation accepts the FHA’s logic because it describes them as “acknowledging” (i.e., accepting or admitting the existence or truth of”) ethnic minority presence as an adverse influence. To communicate that the FHA became complicit in perpetuating biased beliefs that construed ethnic or racial integration as damaging, a different verb is needed.
In addition to solidly supporting the claims made in the essay with evidence from primary sources, you made good use of the rhetorical strategy of imagining a possible objection and then putting it to rest with data. In particular, the passage that begins, “So, was this low rating due primarily to race, [DELETE THE COMMA] or the poor quality of the housing,” works very well. Strong work overall. Bravo!