Transferring the Visualization’s Ownership:
For this project, Kaitlyn and I have used Google Fusion Tables and GitHub to manipulate the data into a Visualization. Transferring the ownership of the visualization should be easy since Google Fusion Tables can be shared and edited by the Hartford Food System through email. Google Fusion Tables creates the map part of the online visualization, and editing these tables change the points and polygons. With the power to edit the Google Fusion Tables, the Hartford Food System will be able to add new data and upkeep old data while simultaneously updating the online map. In case the Hartford Food System change other parts of the visualization like the legend or the position of the maps, Kaitlyn and I will share the code via GitHub. This code can be ‘forked’ from our project’s repository and then edited if necessary.
Adding and Updating the Visualization’s Data:
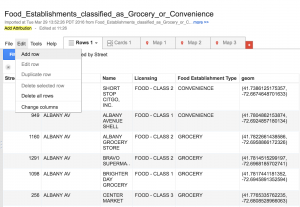
Data about food establishments in Hartford can be found on the city’s open data site. For example, the data that we used for our food establishment types here. The city of Hartford also updates this data on a regular basis. Current data can also be edited by double clicking on the table’s cells or selecting the ‘edit’ button that appears next to the cell.
New data can be singularly added by selecting ‘edit’ on the toolbar and then ‘Add Row’, while new data sets can be uploaded as excel and KML format by creating a new Google Fusion Table document.
The polygon’s map information can also be altered and updated. Currently, we are using the 2014 ACS 1-year estimates for the data in the Polygon. This information can be updated annually. To do this, new American Community Survey data sets should be uploaded to a new Google Fusion Table and ‘merged’ with the Hartford Census tract KML file. Both spreadsheets must share the same information in at least one column, like the names of food establishments. More information and the step-by-step instruction on how to merge spreadsheets on Google Fusion Tables can be found here.
Changing the Visualization’s Characteristics:
The ability to change the colors and information displayed by the polygons can be done in Google Fusion Tables. To do this, the Hartford Food System can select the ‘Map 1’ tab and then ‘change feature styles’ or ‘change info window” button on left side of the screen.
However, if the Hartford Food System decides to change the data point colors or the legend’s characteristics they will have to modify code in GitHub. In his data visualization book, Jack Dougherty explains step by step the process how to extract, or ‘fork’, a visualization’s code to another GitHub account. Kaitlyn and I will share the link to our GitHub repository so the Hartford Food System can extract the visualization’s code.
Data Sources:


