Posts

Trinity College news features DataViz students and community partners

Posted on

The Trinity College online news recently featured our DataViz student and Hartford community partnerships. Read the full story, and learn more about this semester’s partnerships and their final presentations.

Norah Do '18 (far left) worked on a DataViz seminar project with Julie Geyer (far right) of Capital Workforce Partners. Photo by Andrew Concatelli.
Norah Do ’18 (far left) worked on a DataViz seminar project with Julie Geyer (far right) of Capital Workforce Partners. Photo by Andrew Concatelli.


Assignment 10: Presentation and transfer and training plan-KNOX

Posted on

Part 1: Update the data and photos
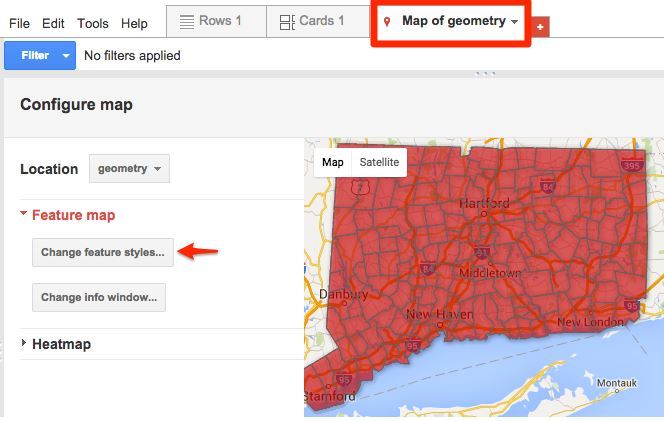
Go to Google fusion point table and click on “Rows 1” on the tabs
To update current data in the spreadsheet:
-Click certain cell to edit the data information.

To add more columns or rows:
-Click “file” in the upper panel and “import more rows”; or click “edit” and “add row”.
-Click “edit” and go to “change columns”, “create a new column”. Select type among text, number or location.

To update photos:
-Upload photos on WordPress, and copy the html link. (photos have to be on the website and have a html link in order to appear on the map)
-Insert the link under the photo column

Part 2: Maintain the website
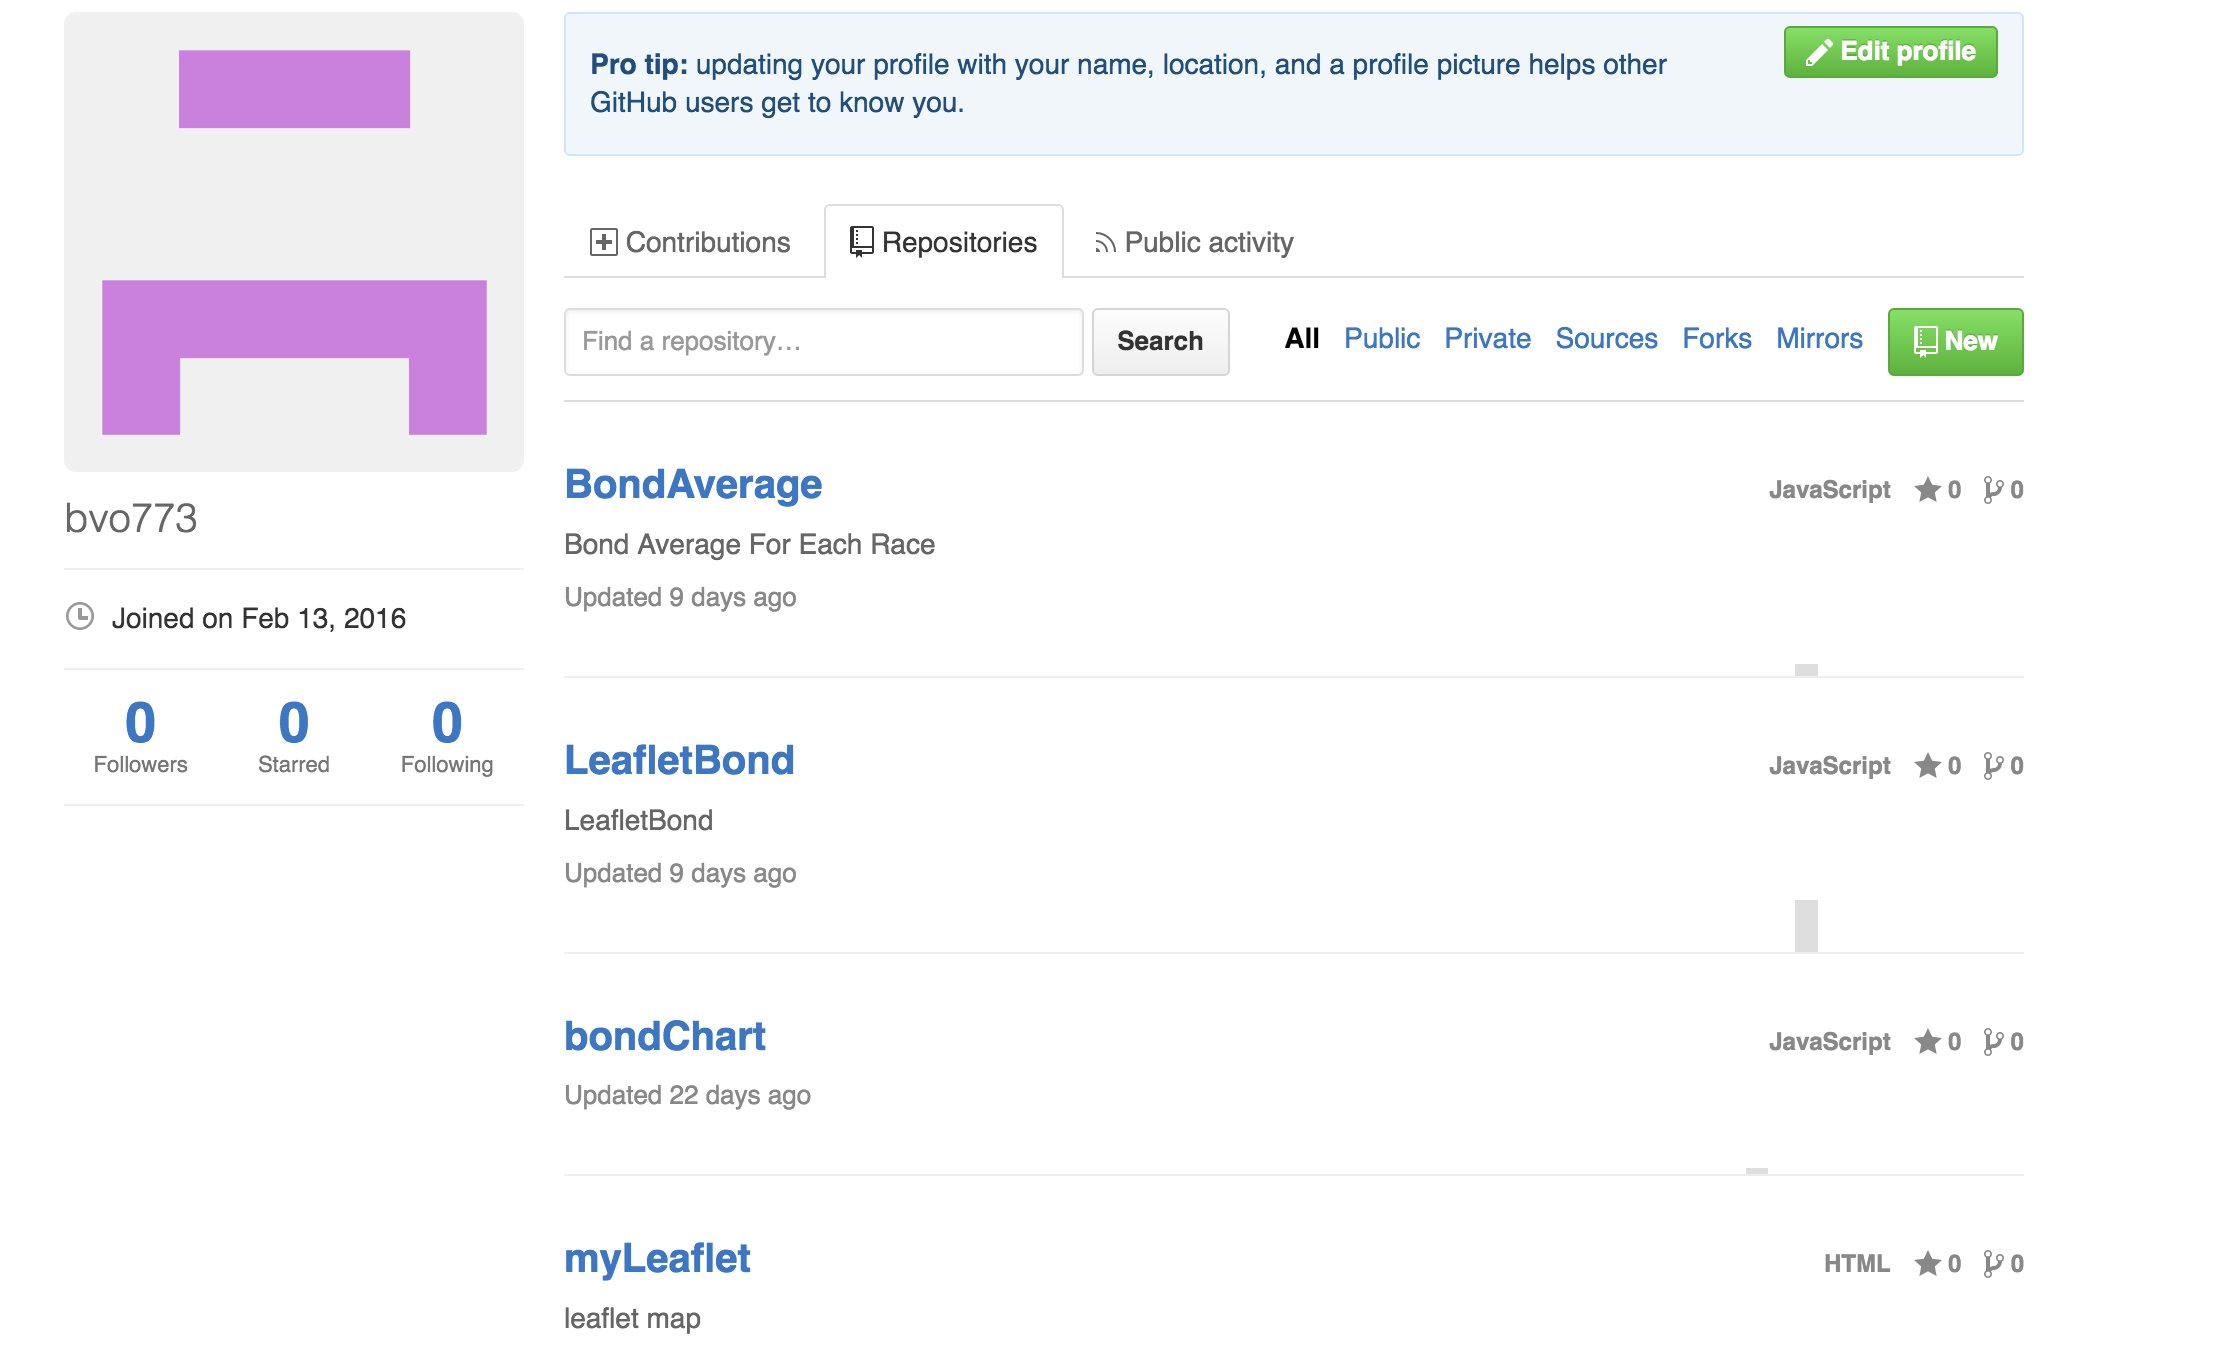
1. Sign up for a free GitHub account
2. Go to the current repository I use for community garden map. Click “fork” on the top right corner to make your own copy of the map.
Screen Shot 2016-04-21 at 下午11.10.27
3. Your new repository automatically starts opens the “master” branch. Go to “branches” and delete all branches besides the master branch. Use the drop-down menu to create a new branch, and name it “gh-pages” (which is short for GitHub Pages), and press enter or return on your keyboard.
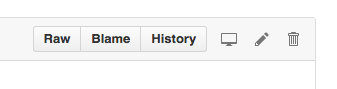
4. Go to gh-pages and README.md file to change the link to your new map. Click on the second icon, “edit”, to make changes. Under “Demo”, there’s the current link to the map: http://doris0221.github.io/fusion-point-polygon-4/index.html. Delete “doris0221”, which is my username, and change it into your username. Scroll down to the bottom and click on green button to “commit changes”.
Screen Shot 2016-04-21 at 下午11.18.13

Screen Shot 2016-04-21 at 下午11.21.20

Part 3: Change website and map appearance:
1. Stay on gh-pages and go into index.html. Click “edit” to make changes. Read in detailed and pay attention to where it says “MODIFY”.
2. For example, if you want to change the title that appears on the website, simply look for the current title “KNOX Community Gardens Map” and replace it with the new title.
Screen Shot 2016-04-21 at 下午11.29.06
3. In index.html, you can change the following features:
Website title
Description on the top left corner
Address tool
Filter tool (checkbox icon color and titles)

Reference: Data Visualization for All –Jack Dougherty

DataViz Final

Posted on

Presentation

Which files need to be transferred? How are they labeled? Who owns or has access to them?
The bond data file was in excel format and it was found on the State of Connecticut Library public record online. It was labelled based on the type of bonds, race, date, and amount. The data is owned by the State of Connecticut Judicial branch and everyone can have access to them.

What info and training does the partner need to maintain or update the dataviz? Spell out the steps in your post, and refer to DataVizForAll if needed.

My partner is already an expert in Data Visualization. However, if he wants to manipulate the data and change it. He can go to my github.

1) Go to my github: link
2) Choose a repository on which visualization they want to edit
repository_
3) Go to the main.js file and edit the code in the function
test

Injury Prevention Center Presentation – Data Visualization Final

Posted on

Files that need to be transferred:

  • Excel Files: 
    • The population of children in each town and the total population from Social Explorer. I own the file and it is also located in Google Fusion. It is labeled as: 2010-2014-ACS-Children Population-Data.xlsl
    • The calculations of police arrest rates of the Greater Hartford Area. Within the excel file, there are multiple spreadsheets that also contain the calculations of total population without child involvement for five years. I own the file and plan to input individual spreadsheets into Google Fusion. It is labeled as: greaterhartford-arrest-rate.xlsl
    • List of 169 towns with the troop label. I own this file and this is also located in Google Fusion. This is labeled as: CT-towns-troops.xlsl
    • The calculations of police arrest rates of Connecticut. I own this file and this is also located in Google Fusion. This file is labeled as: CT-arrest-polygon.xlsl
    • The calculation of 2010-2014 total police arrests. I own this file and is labeled: 2010-2014-total-arrest-rate.xlsl
  • Google Fusion:
    • Greater Hartford polygon map is labeled as: Greater-Hartford-Police-Arrest-Rates-2010-2014 and will be shared with Garry.
    • Connecticut Troop polygon map is labeled as:  CT-Troops-Arrest-Data and will be shared with Garry.
    • Connecticut Police Arrest polygon map is labeled as: CT-Polygon-Shape-Map and will be shared with Garry.
    • All of the excel files will also be uploaded on Google Fusion and will be shared with Garry and make him the owner
  • Shape Map Files: 
    • Connecticut map shape file of 169 towns. I own this geojson file and is is labeled as: CT-towns-polygon-shape.geojson
    • Connecticut troop map shape file. I own this kml file and is labeled as: CT-troops.kml

Step By Step Instruction on Updating/Maintaining Maps

Part A:  Google Fusion

  1. In order to create a thematic polygon map, there are two types of files that need to be merged:
    • Data Table: the numerical values for each polygon and is your normal excel or csv file.
    • Geographic borders: series of points that draws each polygon. This can be shape files can be found from open source data such as MAGIC UConn Libraries or refer to the DataVizForAll book for direct links to the shape files.
  2. How to Upload data tables:
    • In Google Drive, click New > Google Fusion Tables. Import each sample file, one at a time, by selecting “From this computer” and navigating to the file. Click Next to confirm the data upload. google fusion upload
    • Then, a columns and rows of data will appear, just like the excel sheet.
  3. Merge Data and Border Files: This step is important in creating the choropleth map.
    • In order to merge the data table and geographic borders, the two files must share a common column. For instance, a town name
    • google fusion merge
    • Then, go to File –> Merge –> and select the geographic borders. Note: your geographic borders file will not show up unless you upload it into Google Fusion.
    • Select the matching column types to merge. The goal is to match the correct column type, even if the town names do not appear in the same order. google fusion match merge
    • Afterwards, a new link will pop up to direct you to the new Google Fusion table where the data table and geographic borders are merged.
  4. Creating Thematic Map
    • Click on the Tab labeled Map of Geometry. Make sure the Location is Geometry to get the thematic map. Next, click on change feature styles under Feature Map.
    • google fusion thematic map
    • This will allow you to change the color scheme, the appropriate ranges, and the overall appearance of the map. Try to play with the buckets and gradient tab that is located in Polygons –> Fill Color. Note: If you want to have your range in quartiles, Google Fusion calculates the range for you. However, make sure the starting range is less than the lowest number and the highest number is higher than the highest range. If you do not change the range, then the polygon map will not change color.  google fusion change feature style
    • Legend: To make the legend appear on the map, click on Automatic legend which is located under the Legend Header. Afterwards, click on “show polygon fill legend”. Then, you can customize the title and position of the legend
    • Customize Window Data/Information: When you hover over the map, a window of information will pop up. To customize the type of information you want shown, click on “Change info window’ which is located under Feature Map. Then, a window will pop up where you’ll be able to click on information that you want to include. google fusion info window
    • Hover over a polygon to visually see the information included in the window.
  5. The thematic map is now complete! To share this map, make sure you change the settings to anyone who has a link can access the map.

References/Pictures: DataVizForAll by Jack Dougherty