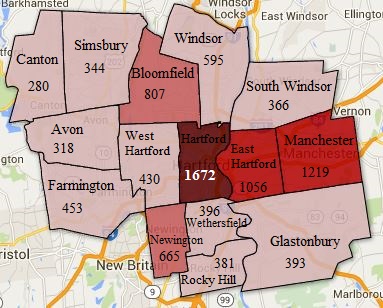

What is done: The first map is a clip of the Greater Hartford polygon map. The shaded polygon map represents the amount of arrests made from 2010-2014. Based on the shading, the darkest color represents the greatest arrest made versus the lighter shaded polygon which shows a lower range of arrest rates. Since this map was time sensitive and Garry just wanted a still picture of the map, I used Paint to label the town names and the rates of arrests made. The second and third map shows the troops of Connecticut and the arrest rates made from 2010-2014. There are police departments that cover multiple towns in Connecticut which is why there are Troop data. Troop data allows the audience to visualize the arrest rates in greater regions. The same color coding for the ranges apply.
What needs to be done:
Compile data to create entire state of Connecticut Map that is shaded just like Map 1
Currently working on Google Slides with Garry
Current Progress on Excel:
Interval Data:
https://www.google.com/fusiontables/DataSource?docid=1wBYD2HR4soYIS98UUoG-6pn-GKE2Vr_9Dl0ggOlJ
2010-2014 OCD Assault Rates:
https://www.google.com/fusiontables/DataSource?docid=1mkGpeGUjdsWO_0Ibw4ukuCPORwzQe4RU61xJMU2W