Transferring Ownership
Because we decided to use Google fusion tables transferring ownership is simple. I will add you as the main owner of the fusion table, right now the owner is Linda, which will allow you to access the map through your Gmail and will also give you full editing privileges. For the map to be reachable for other people within Girl Scouts by using a Google fusion template I will be able to create an interactive web page were the Map can be viewed but not edited. And this page can be easily reached with a simple URL you can distribute to anyone who wants to view and use the map.
Spreadsheet Update:
1)When new Girl Scout data is updated you will need to pull Girl data from iMIS using the LB Data Viz Query (girl)
2)When you data is now imputed into a new excel sheet before you begin organizing your town data you will need to convert the smaller wrong town names to the correct ones using VLOOK up. VLOOK up instructions can be found here. You will need to use this excel page to convert your town names: VLOOK up town data.
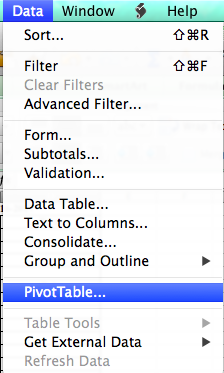
3) When new data on Girl Scout participation is available in order to convert this into a usable spreadsheet for Google fusion you first step is to create a pivot table showing the number of Girl Scouts in each town by age group. To create a pivot table you will need to highlight the entire spreadsheet then go into Data and then click pivot table.
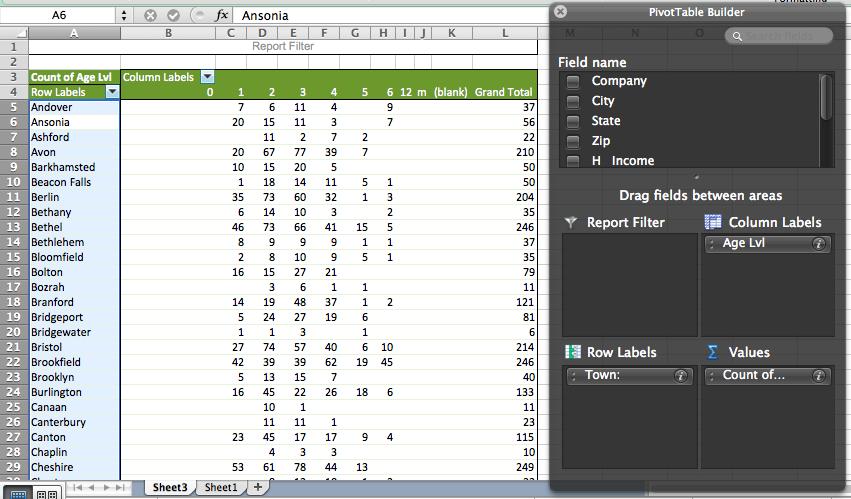
You will then need to organize you data into these groups at shown in the picture below.
4) Once your Girl Scout population by town data is organized your next step is to create a spreadsheet with both census population data and Girl Scout participation data. You can use the same population template spreadsheet each time the only thing that will need updating is the percentage of Girl Scouts compared to residences.
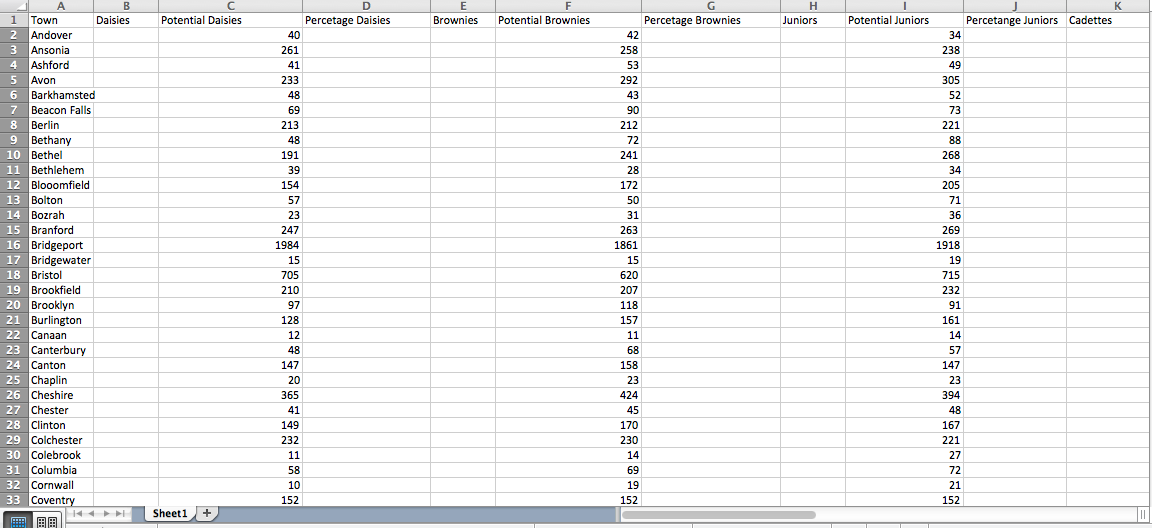
Your spreadsheet should be set up in a format like this. Your Columns for each age group should be labeled as such: Town, Daisies (number of Daisies in town), Potential Daisies (population in town), and percentage (actual Daisies over potential Daisies) Once you input the new Girl Scouts data you need to find the percentage of Girl Scouts over Census data.
Google Fusion Map Update:
1) Once your spreadsheet is organize you will need to input your new spread sheet into a google fusion table. You will then need to merge it will the MAGIC town borders of Connecticut. Under file in your google fusion table you will need to click merge and it will give you an option to merge your fusion table with a table on your desk top (town borders). You can access the Magic town borders here. For more help on merging data look to the Data Viz For All Booklet.
2) You will then need to copy the color codes and percentage ranges from you old maps. You will need to create 7 maps using google fusion tables exactly like the ones I initially created using the new data. For help using Google fusion tables look to Data Viz For All Booklet. Once you tables are finalized you will be able to update the GitHub code to update the template.
GitHub Update:
1) Updating GitHub is simple once your maps are updated and finalized you will want to go into file on your google fusioon map and then to about this table. You will then see
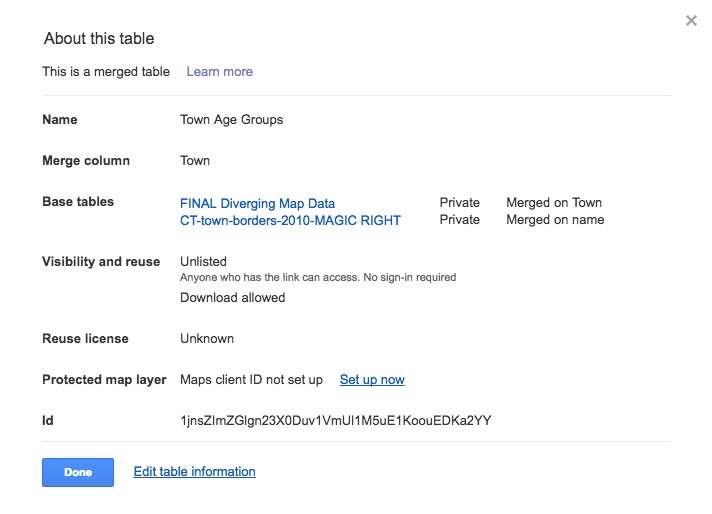
You will then need to do a hard copy of the ID at the bottom of the list. This ID is different for every map within this google fusion table so when importing these IDs into the GitHub code it will be different for each map.
2) You will then need to go into your fusion-girl-scouts repository making sure you are editing within your gh-pages. You will need to go into your  file and then into your
  file. This is where you will be updating your map and points within the template. Once in your maps_libs.js file you will then need to scroll down to line 26
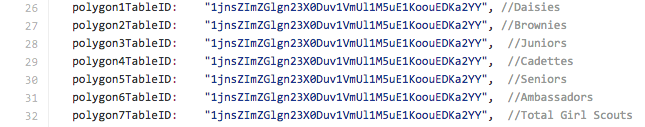
Within this code is where you will import your new polygon IDs that you copied from your google fusion table. Each ID is labeled with each age group.
3)Once your IDs are updated you will want to check that your map updated correctly by scrolling down on your main repository page and click on the demo link. It may take a while for the maps to update but before you do a pull request to update your master branch you want to make sure the maps are inserted correctly.
4)*This step is not necessary until you have made changes to your gh-pages that are perfect and finalized. To make a pull request to your master branch to have your repository completely updated you will need to click on the  new pull request page. It will then ask you to check which GitHub profile to pull from and you will want to click on
 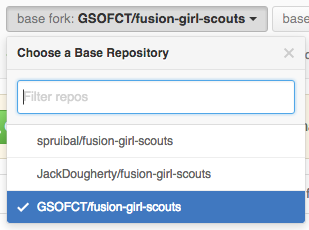 GSOFCT. Once you are have clicked on your own repository you need to create a pull request to you master from your gh-pages which will look like this
  . You can then create your pull request.
5)Depending on how much your data has changed you may need to edit the range of percentages the map is basing its data off of for each individual age group. You can find this on your google fusion table under change feature style in fill color. You will also need to update the percentages under the color legend on the template map within GitHub. You can access this in your file and then in your file. You will then need to scroll down to line 170. 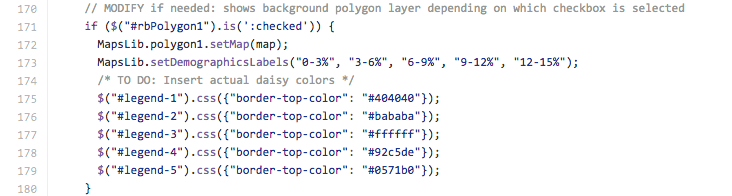
There is separate code for each age group and within this code you can edit the color codes for the legend as well as the percentages under each color. Each code is labeled under each age group.
Population Data:
1) Once new population data for CT is released you will need to update the population data as well. The best source for specific age break downs is from the Department of Public Health for Connecticut. You will have to download their data called Connecticut Town Population by Age Sex Race and Hispanic Ethnicity for the next census. The data surrounding race is not important for the data needed for your partner potential map so you will have to extract the specific data you need for this large data set.
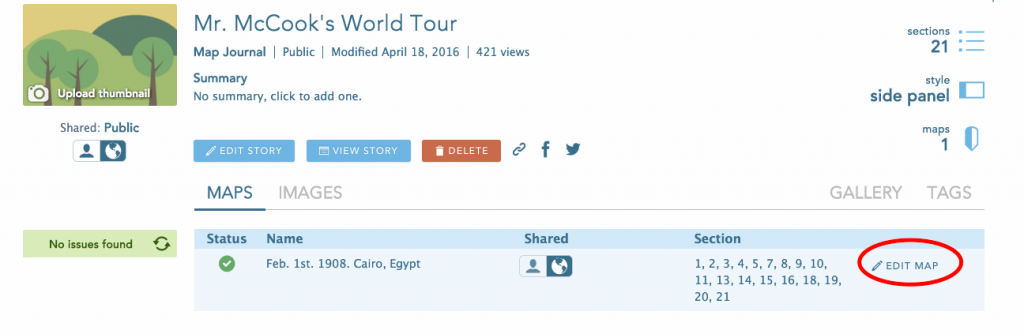 Select the map in use, click on “Edit map”.