Using data from 2007-2012 grade level cohorts in various Hartford Public Schools, the chart demonstrates the percent of students at proficiency on the CMT. You are able to compare between schools and see the specific achievements of each year when hovering over and clicking a specific point on the line chart. For more information, see tutorial here.
Author: Veronica Armendariz
Currently a student at Trinity College with a strong interest in teaching mathematics, volunteering, and tutoring.
Housing Mobility Map with CT Open Communities Alliance
 Open Communities Alliance is a new civil rights organization that promotes access to opportunity for all people through education, organizing, advocacy, research, and partnerships. Erin Boggs, executive director of CT OCA, began working on a “Housing Mobility Map” with Prof. Jack Dougherty at the Connecticut Inequality Hackathon in spring 2014, and Trinity students continued to assist her in summer 2014. Read more about what Jack learned by participating in his first hackathon.
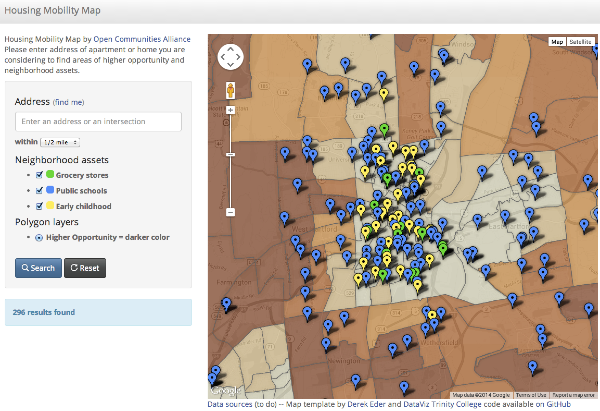
The Housing Mobility Map (based on Derek Eder’s open-source template) allows families and housing counselors to enter the address of a possible apartment or house, view surrounding neighborhood assets, and evaluate the level of opportunity in that census tract, based on a recent report commissioned by the CT Fair Housing Center. To explore the current version of this tool, enter in the apartment or home you are considering here.
The Relationship Between Free/Reduced Lunch and Percentage of Minority Students in Schools
Ex
CT Voices Choice Watch scatter chart
CT Voices came to us with spreadsheet data of CT schools by racial minority, percent free & reduced lunch, and school type (charter, magnet, technical, etc.)

We worked with CT Voices to transform this tabular data into an interactive scatter chart for the web: