In building on the map I created last week, I was able to use HTML code to include a legend to the map I created through the Layer Wizard. I still want to add several features, but it is definitely an improvement from the very first map I made. Eventually I would like a drop down menu so viewers can switch through the years. Right now, the map displays data from 2013, but if you click on one of the school’s, you can see the percentage of students who are proficient from 2007-2013. Switching between years would allow viewers to see how each school has progressed over time.
Category: xSpr14 Assignments
Assignment 5: Updates on A4 of Park Watershed Schools
Using Google Fusion Wizard, I was able to combine the point layer of the schools and the polygon layer of the watershed together. I will have to play around with the colors of the points as well as the watershed for my final map. I would also like to be able to show the schools in the watershed alone and take out the other schools. But the map below is starting to look more to how I would like my final map to look like.
Now that I can add layers to point maps, I would like to add more to my final map. For example, it would be nice to include boundary lines of the municipalities, parks/nature centers/libraries, impaired water systems, etc. My next step is to search for other shape files with the above details in either the Trinity GIS folders or by downloading them.
Working with Center for Children’s Advocacy
This semester, I’m working with an organization located in Hartford called Center for Children’s Advocacy. This organization is a group of attorneys and other advocates who work to make sure that all children in Connecticut are given legal rights. The center mainly works with abused and neglected children, but also has a large focus on improving the educational success of Connecticut’s teens by preventing truancy and collaborating with the juvenile justice system. The main part of the work the center does is through legislature, by fighting for laws that ensure the well being of all children.
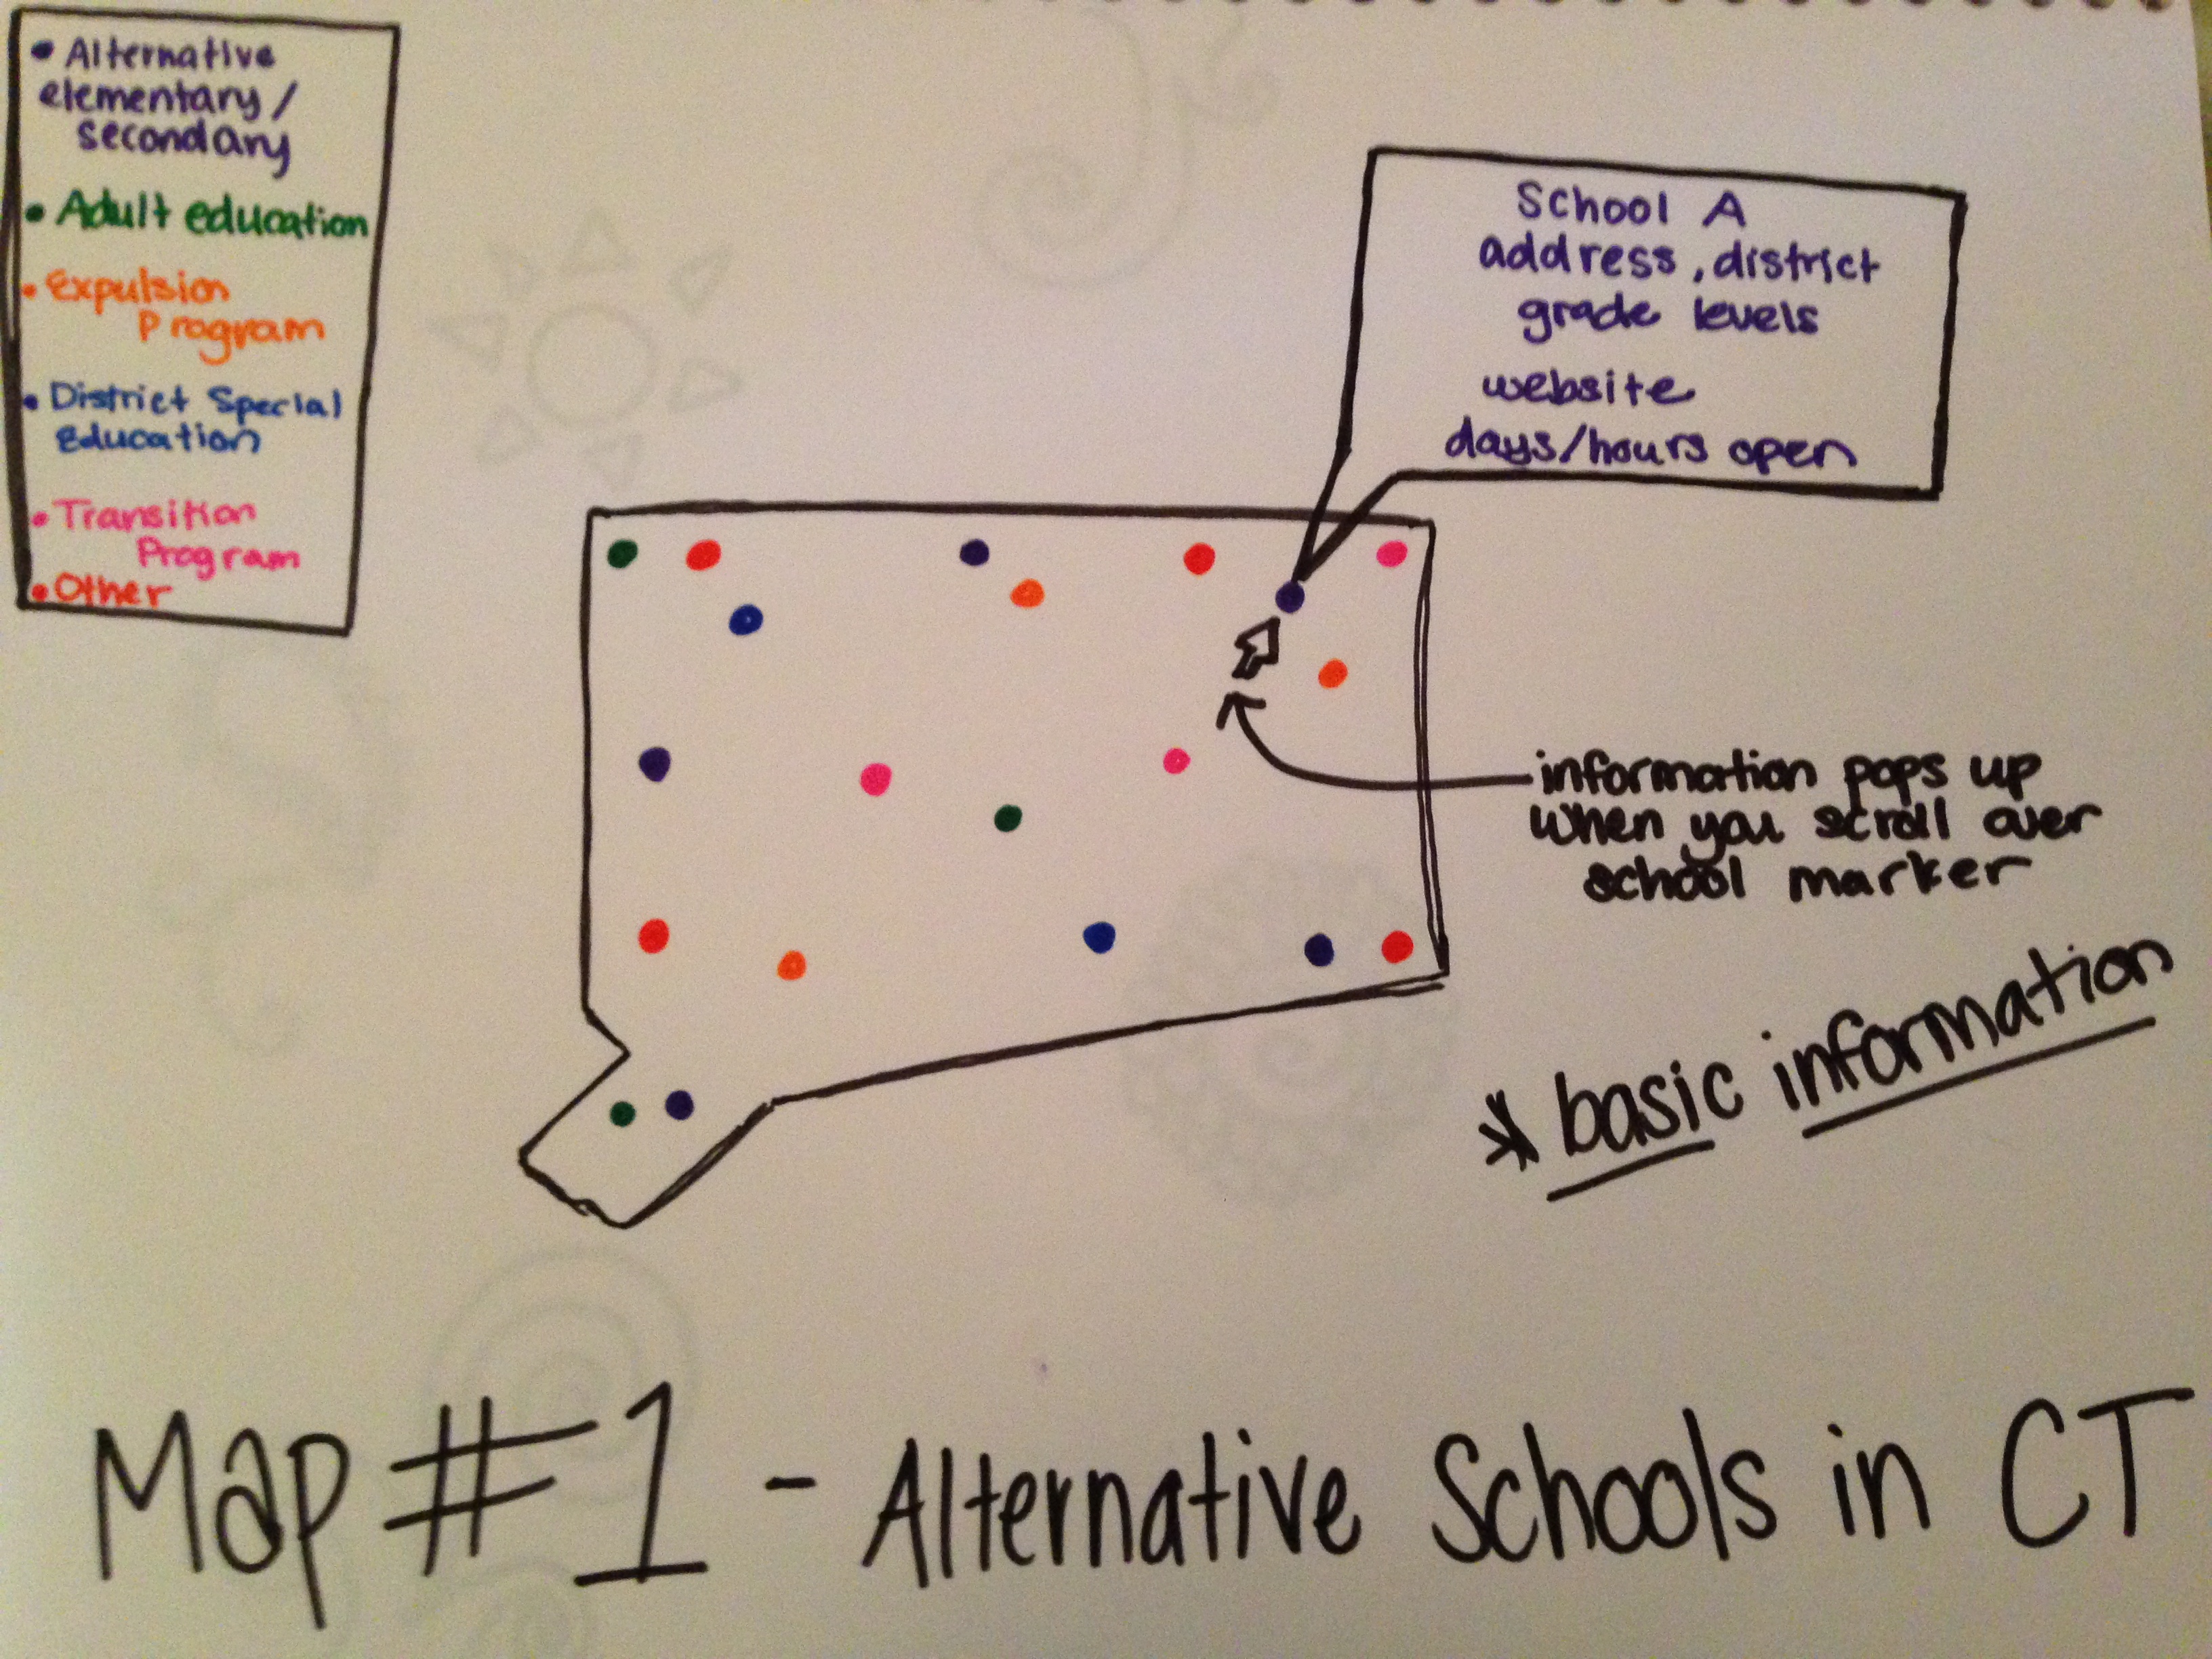
My main involvement with Center for Children’s Advocacy is by helping them pass new legislature on Alternative Schools in Connecticut. Currently, Alternative Schools are not held to the same standards as government public schools, which has allowed them to get away with offered a sub-par education. The goals that Center for Children’s Advocacy and I have are to create an interactive map that enables parents to see their options for alternative schooling, while also making the public aware of the glaring differences between alternative and public schools in the quality of education. The hope is for these maps to show where alternative schools are, where they’re needed, and facts about the education they offer, which in turn will force these schools to be held accountable to at least the public, if not the legislature.
Below is a sample of a 2D representation of what a data visualization for Center for Children’s Advocacy might look like. Note: This is not actual data.
Update to last week’s maps
The maps below are an updated version of last week’s maps, using the Google Fusion Tables Layer Wizard. The maps are a combination of polygons and points, and shows the four Hartford school zones superimposed on the point map. The Layer Wizard is somewhat limiting as it does not offer an easy solution to include a legend. There is a help section that provides the html code for legends, but never having worked with coding before, I am slow to figure it out.
***Maps to come — Issue with hosting HTML on Google Drive