Trinity College recently invited faculty to respond to a call for proposals to create massive open online courses (MOOCs) for our edX platform. Here’s a copy of my submission.
Data Visualization For All
Proposal to Trinity College edX
by Jack Dougherty, Professor of Educational Studies
last updated March 1, 2016
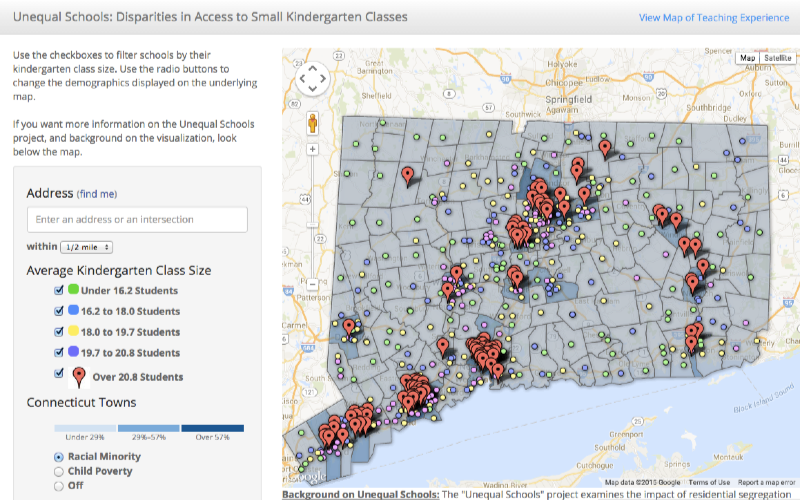
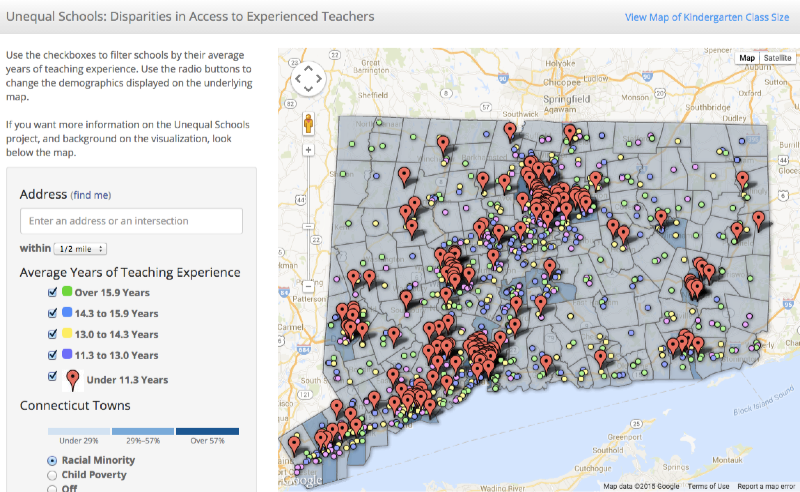
1. Course Title and Description: I propose to create Data Visualization For All, an introductory massive open online course for the Trinity edX platform. A growing number of free software tools now allow ordinary users to transform data tables into interactive charts and maps. By learning how to design and embed meaningful visualizations on our own websites, the breadth and depth of our communication becomes more powerful than conventional paper. This course introduces design principles for working with easy-to-learn tools, including step-by-step tutorials, short videos, and real-world examples. The learning objective is best summarized by the course tagline: “Tell your story and show it with data.”
This online course expands on my Data Visualization internship seminar, FORG 210-04, which I first taught in Spring 2014 and am currently teaching in Spring 2016. Trinity students from various majors (including anthropology, computer science, economics, educational studies, environmental science, mathematics, psychology, public policy, and sociology) meet with me for one hour per week and learn to co-create data visualizations with their Hartford community partner organizations, in fields such as public health, economic development, food distribution, policy journalism, and education reform. Currently, we are videorecording the seminar to capture excerpts of student questions and rich examples for possible inclusion in the online course. Learn more and view the syllabus at http://commons.trincoll.edu/dataviz.
This introductory online course has no prerequisites, and is designed to make data visualization more widely accessible to all. While teaching our seminar, Veronica Armendariz (Trinity ‘16) and other contributors and I have begun writing an open-access digital textbook, Data Visualization for All (http://DataVizForAll.org). This book will provide the content for much of the online course, which I envision as six one-week units:
- Design Principles for Data Visualizations
- Find and Transform Data
- Create and Embed Interactive Charts
- Point Maps Versus Polygon Maps
- Modify Code Templates on the Web
- Tell Your Story and Show the Data
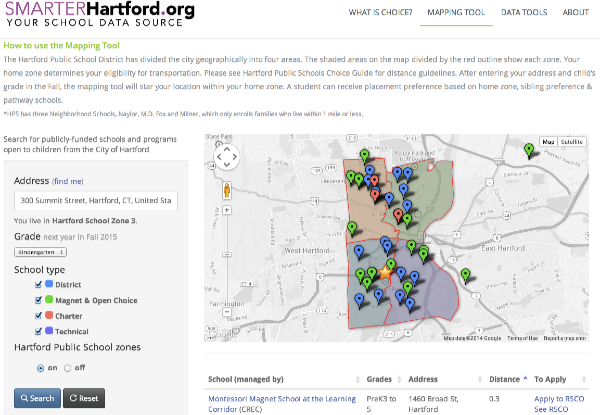
First, we begin with design concepts and essential spreadsheet skills (inserting formulas, sorting, pivot tables), which many Trinity students tell me that no one has ever taught them. Second, we create and embed charts and maps using easy-to-learn tools with a graphical user interface, such as BatchGeo, Tableau Public, and Google Fusion Tables. Finally, we learn how to modify existing code templates and host them online with user-friendly GitHub browser tools. Although the course presumes no prior experience with coding, it concludes by teaching students how to “tweak” existing data visualization code that can be found and shared online.
2. Audience: The online course is designed for two audiences. First, Trinity students who enroll in future semesters of the credit-bearing data visualization internship seminar will work through the online instructional content before class, to allow for more interaction and discussion during class. Second, learners from outside Trinity will enroll in the edX course. Trinity students and I have led half-day data visualization workshops for non-profit organization staff, sponsored by the Hartford Foundation for Public Giving. Although I have not publicized Data Visualization for All beyond these workshops, GitBook statistics reveal that nearly 10,000 visitors have discovered the online book-in-progress, and over 500 have downloaded a free e-book, since April 2015.

3. Distinctiveness: This online course will highlight Trinity’s urban engagement and community learning initiative. Data visualization examples will be drawn from two years of Trinity student partnerships with Hartford non-profit organizations, and our efforts to help them tell their stories and show their data. In our current internship seminar, seven Hartford community partners have granted permission and have been video recorded while working with their Trinity students.
4. Research and Design, and Benefit to Trinity Students: This data visualization course is well-suited to the online format because the core learning objective is to teach students how to communicate more effectively on the web. Also, the online format allows individual students to replay tutorial videos at their own pace, and it also brings together a community of learners to share links and comment on each other’s visualizations. Trinity students in future Data Visualization internship seminars will benefit from online course material before class, to allow more interaction and discussion during our one-hour weekly class sessions. Finally, pending funding, Trinity students who completed the course may be hired to work as “virtual teaching assistants” and respond to off-campus learners’ questions on the edX discussion board.
5. Timing: I propose to launch the edX course in February 2017. This schedule allows me and an instructional technologist to create the course in Fall 2016, and to preview it with the next cohort of Trinity students in the Data Visualization internship seminar in January 2017.
6. Stipend: I plan to request a course stipend rather than a TU release.