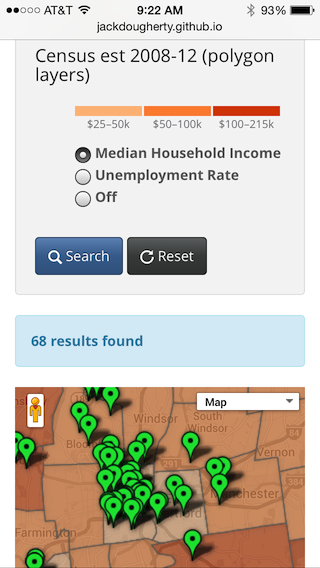
 Thanks to open-source code and inspiration from Derek Eder in Chicago, we have created a dynamic polygon legend for our search-and-filter map template that draws data from user-friendly Google Fusion Tables. When users click on different thematically shaded background layers, the data ranges magically appear in the legend. Check out the demo that displays schools (points) on top of two polygon layers: median household income and unemployment rates for Connecticut towns. Download the code and build your own with our instructions. It even looks good on a smartphone!
Category: Jack Dougherty
Housing Mobility Map with CT Open Communities Alliance
 Open Communities Alliance is a new civil rights organization that promotes access to opportunity for all people through education, organizing, advocacy, research, and partnerships. Erin Boggs, executive director of CT OCA, began working on a “Housing Mobility Map” with Prof. Jack Dougherty at the Connecticut Inequality Hackathon in spring 2014, and Trinity students continued to assist her in summer 2014. Read more about what Jack learned by participating in his first hackathon.
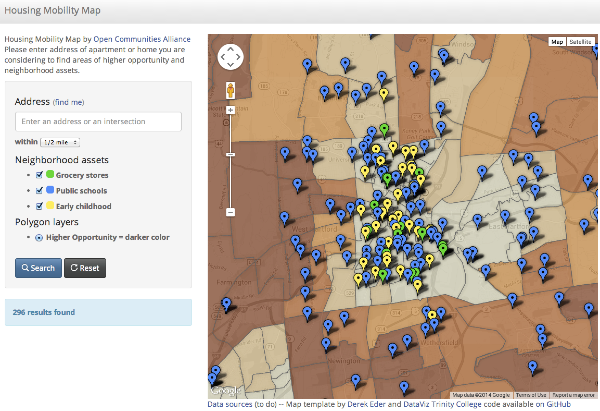
The Housing Mobility Map (based on Derek Eder’s open-source template) allows families and housing counselors to enter the address of a possible apartment or house, view surrounding neighborhood assets, and evaluate the level of opportunity in that census tract, based on a recent report commissioned by the CT Fair Housing Center. To explore the current version of this tool, enter in the apartment or home you are considering here.
Advice on embedding versus linking visualizations
If you have a medium-sized visualization that is no more than 600 pixels wide, you can safely embed it in a WordPress post using our iframe tool.
However, if your visualization is very large (such as the full width of a web page), you may wish to describe it in your post and include a link to the page, like this.
Sample CT Open Data interactive chart with Tableau Public
Last week, the Connecticut Open Data portal opened with a handful of files to demonstrate the state’s initiative in sharing public data. Check out the data that’s currently available on the Socrata platform at https://data.ct.gov
Also, I was curious to find out what types of interactive data visualizations could be easily created with Tableau Public (free download, but Windows only, requires free account for web services). This application competes with Google Fusion Tables, a free cross-platform data visualization tool, which I’ve been teaching to my Trinity students.
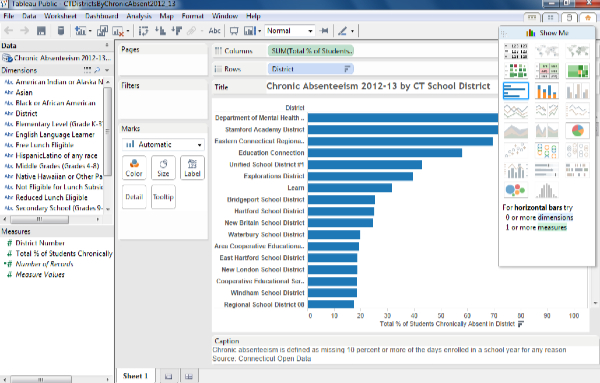
Tableau Public has limitations, and users are encouraged to upgrade to Tableau Desktop (free trial, but full retail price is $999, with education/non-profit discount; Windows only). One limitation of Tableau Public is the lack of a direct link to the CT Open Data/Socrata web platform, which means that I could not display “live” data. Therefore, I had to export a sample data file into Excel, and upload into Tableau Public, where the dashboard allowed me to construct an interactive chart with “static” data. The interface seemed relatively straightforward to me, but I’ve used dozens of data tools over the years. The chart-design mode below seemed similar to the Microsoft Excel pivot table feature, if you’ve ever used that one.
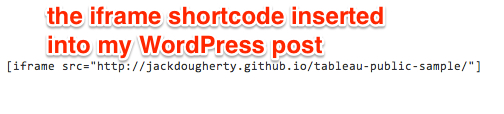
Next, I created a free Tableau Public web services account to save my work online, and it generated a results screen with a long HTML embed code. To display the interactive visualization on your own site, users need to host this code on another live website, and in my case, I simply pushed it into a GitHub Pages repository, as I’ve taught my students to do in our DataViz book-in-progress. To embed that live site on this WordPress.org post, I embedded an iframe with the URL source into the text/code view.
The live data visualization appears below — be sure to explore its interactive features.
Overall, Tableau Public — when used in combination with a web hosting platform — looks like a relatively easy way for non-profit organizations to create interactive data visualizations and embed them on their websites. At first glance, Tableau Public appears to have a wider range of out-of-the-box visualization designs than Google Fusion Tables. So why did I decide NOT to teach Tableau Public to my Trinity students in spring 2014? The major roadblock is that the application is currently Windows-only, and most of my students use Macs. While I have Windows virtualization (e.g. Parallels) installed on my Mac, that’s not a luxury that’s available to most of my students. Still, Tableau recently announced that it will release a Mac version in the second quarter of 2014, though it’s unclear to me whether this means the free Tableau Public and/or the not-so-free Tableau Desktop. Wait and see.
Update for community partners
Dear community partners,
Thank you for hosting a Trinity intern from our Data Visualization seminar this semester. My students are just beginning to learn how to design and create interactive charts and maps that fit your organization’s needs, and I’m delighted that you’re participating in this learning experience.
At the link below, you can read more about our seminar and the other community partners. Guests are welcome to sit-in on any of our Monday 12-1pm sessions (I bring a light lunch meal to share), or to follow our work online at: http://commons.trincoll.edu/dataviz/
Currently, Trinity interns are prioritizing their partner’s data visualization needs and sources, and writing up a public post about the early stages of their projects. Also, I’ve instructed our interns to discuss our public-private policy with you. We design our work for the open web, but we also understand cases where individual-level data must be confidential or works-in-progress must be hidden from public view until approved by the organization. Read more at: http://commons.trincoll.edu/dataviz/public-private/
While you’re welcome to contact me at any time with questions, I’ll be sending you a mid-semester online intern evaluation on March 10th, and a final one in late April. Finally, I hope that you can attend ONE of our public presentations: Mon April 21st at 12 noon OR Wed Apr 23rd at 5:30pm, with details on our site.
regards,
Jack Dougherty, Trinity College
http://commons.trincoll.edu/jackdougherty