This semester, I’m working with an organization located in Hartford called Center for Children’s Advocacy. This organization is a group of attorneys and other advocates who work to make sure that all children in Connecticut are given legal rights. The center mainly works with abused and neglected children, but also has a large focus on improving the educational success of Connecticut’s teens by preventing truancy and collaborating with the juvenile justice system. The main part of the work the center does is through legislature, by fighting for laws that ensure the well being of all children.
My main involvement with Center for Children’s Advocacy is by helping them pass new legislature on Alternative Schools in Connecticut. Currently, Alternative Schools are not held to the same standards as government public schools, which has allowed them to get away with offered a sub-par education. The goals that Center for Children’s Advocacy and I have are to create an interactive map that enables parents to see their options for alternative schooling, while also making the public aware of the glaring differences between alternative and public schools in the quality of education. The hope is for these maps to show where alternative schools are, where they’re needed, and facts about the education they offer, which in turn will force these schools to be held accountable to at least the public, if not the legislature.
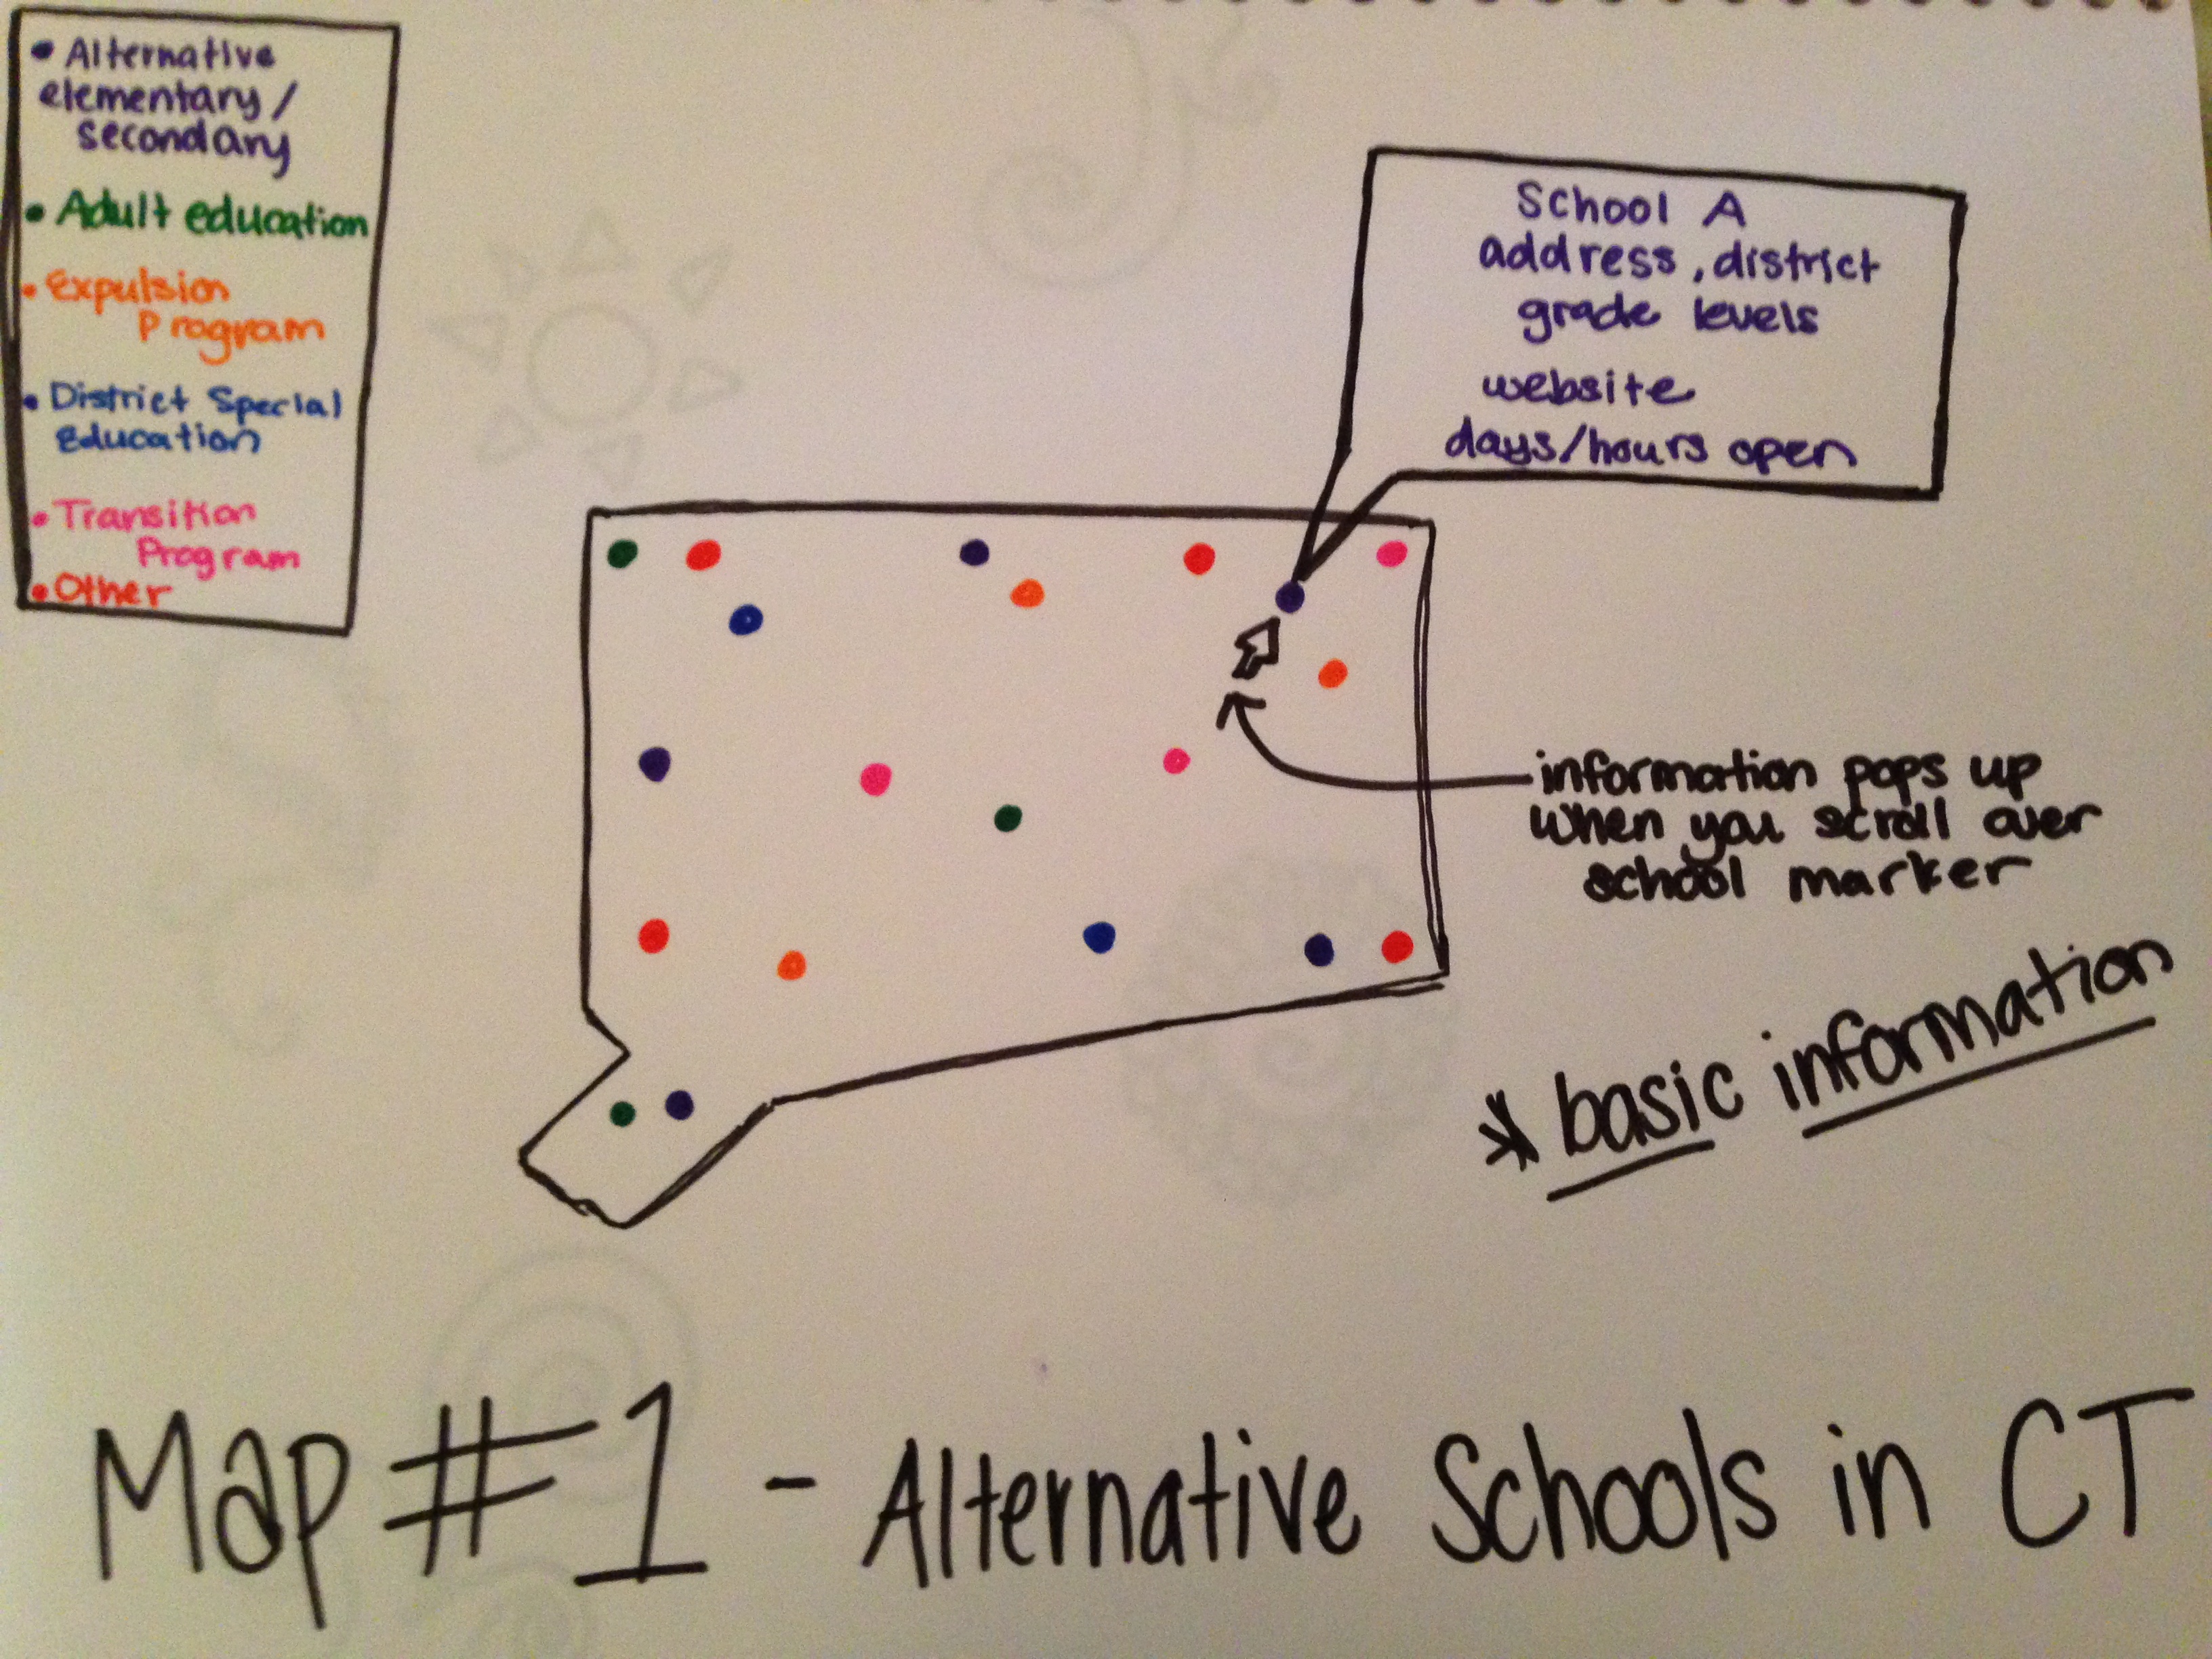
Below is a sample of a 2D representation of what a data visualization for Center for Children’s Advocacy might look like. Note: This is not actual data.