Open Communities Alliance is a new civil rights organization that promotes access to opportunity for all people through education, organizing, advocacy, research, and partnerships. Erin Boggs, executive director of CT OCA, began working on a “Housing Mobility Map” with Prof. Jack Dougherty at the Connecticut Inequality Hackathon in spring 2014, and Trinity students continued to assist her in summer 2014. Read more about what Jack learned by participating in his first hackathon.
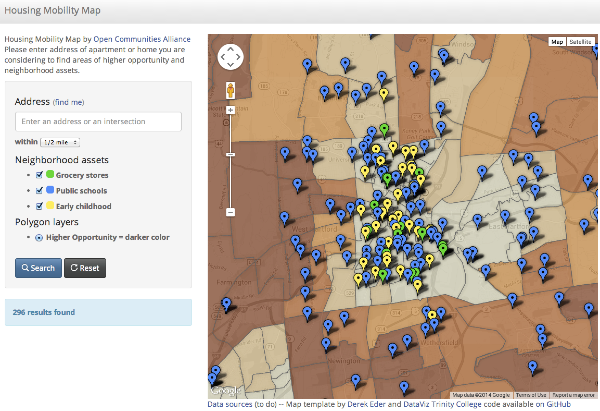
The Housing Mobility Map (based on Derek Eder’s open-source template) allows families and housing counselors to enter the address of a possible apartment or house, view surrounding neighborhood assets, and evaluate the level of opportunity in that census tract, based on a recent report commissioned by the CT Fair Housing Center. To explore the current version of this tool, enter in the apartment or home you are considering here.
Click to explore the current version of the Housing Mobility Map.
Water quality and quantity are measurable in our bodies, rivers and built environments. We depend on this natural product to sustain us and keep communities flowing and regulated. Every being on this planet depends upon water. Yet, we still face challenges convincing our neighbors, peers, and communities to work together and give people the tools to make differences that improve our one and only shared natural earth.
Click to view live map in a new tab/window.
In order to develop a successful watershed stewardship, we need to identify interested groups, such as schools, home owners, park friends & groups or municipalities, etc., who live on or around the river. Many people don’t realize that their own back yard contributes to the health of a stream ecosystem. For example, lawn fertilizers or salt deposits washed from rainstorms can quickly build up in our reservoirs or drainage systems. These problems created by us can lead to myriad issues including changing the pH, temperature, or even flow of the river, which can ultimately deteriorate the river and organisms over time. The Park River Watershed can help orient these interested groups towards annual activities that improve water quality and gather information from these events and organizations. Thus, we are able to gain aggregate site specific data.
Collected data can then be forwarded to state and federal environmental programs or government agencies as well as nonprofits that work on the larger water bodies such as Connecticut River Watershed Council and Save the Sound, which is the Long Island Sound coastal environmental nonprofit group.
With help from Trinity College students, Shaina Lo and Veronica Armendariz were able to create data visualizations about certain schools in the Park Watershed that incorporates environmental goals into their school curriculum. Public school information was obtained from the SmartChoices website, and the Park Watershed Project categorized the school data. From this website, one can read further on deciphering the differences between the types of SmartChoices schools around the Hartford area region. SmartChoices includes public school in the city of Hartford as well as 19 other suburban towns.
This interactive data visualization can help parents around the Hartford area view specific schools they are interested in for their children that are concentrated on environmental goals. It my also be helpful for teachers or people interested in the educational system to help them discover these specific schools that are in or around the Park River Watershed.
Below are the descriptions and color identifications for each school:
Yellow/1) Water or wetland adjacency: school grounds are within walking distance of a river, brook, or pond. This increases opportunity for water quality monitoring, environmental research and stream stewardship.
Green/2) Environmental goals: School curriculum prioritizes natural sciences, which increases potential for local environmental research and stewardship.
Purple/3) A nature trail, park, or open space within walking distances indicates opportunities for classroom or extra curricula site specific (environmental activities).
Pink/4) Science goals could include topics such as medicine or technology that is not directly related to the environment.
Red/5) STEM schools are schools that concentrate on Science, Technology, Engineering, and Math.
Last semester I took Methods into Environmental Science and worked along the Park River in Hartford, CT on water quality. Mary Pelletier, who runs the Park River Watershed spoke in our class and discussed about our watershed and what her job consisted of. I also took the course Analyzing Schools with Professor Rachel Leventhal-Weiner in the Fall where I was introduced to the different forms of education systems especially in and around the Hartford community. With the combination of these two classes as well as an interest in taking GIS (Geographical Information Systems) I found the course and internship Data Visualization very appealing.
I think starting the semester off already knowing some things, such as who one’s community partner is, what area one wanted to work in, etc. was important to figure out before the class actually began. It was nice having already spoken with Mary even if it was mainly over the phone to establish that initial relationship prior getting down to business. I do agree that since this course was offered for the first time in this way, at times I did feel confused and distracted as Jack was writing the book along the way. I had never heard of GitHub before, and I also never realized how much one could do with a Google Drive. But I also never experienced any huge issues where I was not able to get my questions answered or solved either through Jack, Veronica or by consulting the Data Visualization ebook online.
When choosing between the different curricular models listed, I would recommend option 2. My reasons for this is because I do believe keeping this course as it is makes sense. As long as we sharpen it up a bit — and now that the book is written — students in the future will not feel as though the course is being written as it is being taught. I like the idea of a 0.5 credit class because we are learning a lot of material that I personally will be utilizing in the future. Adding the 0.5 internship with the class credit is great as well. This gives students the opportunity to partner and pair up with a community organization, but students do not feel like the whole point of the class is doing what the community partner wants. I feel as though options one and three might create even greater confusion for future students. Establishing that relationship with Mary early on definitely helped me shape my project idea. I think that meeting and pairing up with a community partner half way through the semester might just make things more chaotic as students may feel awkward or uncomfortable working so closely to someone in such a short amount of time.
The culmination of the final projects and the presentations at the Community Learning event on Wednesday was a perfect way to end the course. I know community learning was not stressed as much throughout the course. But I truly believe a class such as this one is imperative for students to participate in some time throughout their Trinity career. One question, I think Jack asked Veronica, Marissa, and me, was why we thought community learning was important especially incorporating it into an internship like Data Visualization. We all had great responses; but I replied that students usually do assignments for classes because we finish it for a grade in the end. When we work on a community learning initiative, we learn the importance of professional work where everyone will see the things we have done publicly. It’s important to remember that when we work on a community learning project we are involving more than just ourselves.
The tools I have been using for my data visualization are all public and can be found online. As of right now, I am the owner of the graphs and tables I’ve made. However, by creating a Gmail account, anyone can access the Google Fusion and Wizard tables. I would simply have to share it with anyone who wishes to view or edit any changes. Organizations and non-profits, such as the Park River Watershed, could easily create an general account, which would make things easier and more convenient when handling data changes and switching over to who has accessibility to update it.
I also received sample data of the ‘interdistrict’, ‘district’, and ‘more Pre-K centers’ from Professor Jack Dougherty who retrieved this data from SmartChoices. From this website, one can distinguish between the different types of SmartChoices schools around the Hartford area region further.
Finally, I created data visualization through GitHub repositories, which can be easily found by searching my username: slo2293. Data and HTML coding here can be forked with other users and updated through Java Script. Jack has also created a wonderful tutorial for first time users to understand here in his Data Visualization WordPress. Though coding is not for everyone, there are other files one can search for to tweak for their liking.
Overall, the data and tools that I worked with were all pretty standard in terms of difficulty of accessing or understanding things. GitHub and Google Drive are public sites for anyone to create an account, and the SmartChoices descriptions are all public.
Water quality and quantity is measurable in our bodies, rivers and built environments. We depend on this natural product to sustain us and keep communities flowing and regulated. Every being on this planet depends upon water. Yet, we still face challenges convincing our neighbors and peers to work together and give people the tools to make differences that improve our one and only shared natural earth.
In order to develop a successful watershed stewardship, we need to identify interested groups, such as schools, home owners, park friends & groups or. . . municipalities, etc., who live on or around the river. Many people don’t realize that their own back yard contributes to the health of a stream system. For example, lawn fertilizers or salt deposits washed from rainstorms can quickly build up in our reservoirs or drainage systems. The Park River Watershed can help orient these interested groups towards annual activities that improve water quality and gather information from groups, so as to aggregate site specific data.
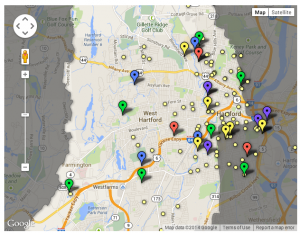
For my Methods in Environmental Science course last fall (2013), I studied the water quality of the Park River between upstream and downstream. The map I created in ArcGIS as well shows the various river patterns that run throughout the watershed.
Collected data can then be forwarded to state and federal environmental programs or organizations, government agencies as well as nonprofits that work on the larger water bodies such as Connecticut River Watershed Council, and Save the Sound, which is the long island sound coastal environmental nonprofit group.
Utilizing the GitHub tool, I was able to play around with the town boundary and watershed boundary lines. GitHub allows one to turn on or off the different types of polygon layers present. I also have divided the SmartChoices Schools into three different types of schools: Interdistrict, district, and Pre-K centers. You can learn more about what SmartChoices is here.
This interactive data visualization helps parents around the Hartford area to view specific schools they are interested in for their children. It my also be helpful for teachers or people interested in the educational system to help them discover these specific schools that are in or around the Park River Watershed. Please see this link to my map here.
Below are the descriptions and color identifications for each school:
Yellow/1) Water or wetland adjacency: school grounds are within walking distance of a river, brook, or pond. This increases opportunity for water quality monitoring, environmental research and stream stewardship.
Green/2) Environmental goals: School curriculum prioritizes natural sciences, which increases potential for local environmental research and stewardship.
Purple/3) A nature trail, park, or open space within walking distances indicates opportunities for classroom or extra curricula site specific. environmental activities.
Pink/4) Science goals could include topics such as medicine or technology that is not directly related to the environment.
Red/5) STEM schools are schools that concentrate on Science, Technology, Engineering , and Math.
Data is constantly changing especially when incorporating new and existing school information. But I hope this was a small step into teaching others about how important a watershed does affect us and our community. Thanks for checking my page out!
 Open Communities Alliance is a new civil rights organization that promotes access to opportunity for all people through education, organizing, advocacy, research, and partnerships. Erin Boggs, executive director of CT OCA, began working on a “Housing Mobility Map” with Prof. Jack Dougherty at the Connecticut Inequality Hackathon in spring 2014, and Trinity students continued to assist her in summer 2014. Read more about what Jack learned by participating in his first hackathon.