Water quality and quantity are measurable in our bodies, rivers and built environments. We depend on this natural product to sustain us and keep communities flowing and regulated. Every being on this planet depends upon water. Yet, we still face challenges convincing our neighbors, peers, and communities to work together and give people the tools to make differences that improve our one and only shared natural earth.
In order to develop a successful watershed stewardship, we need to identify interested groups, such as schools, home owners, park friends & groups or municipalities, etc., who live on or around the river. Many people don’t realize that their own back yard contributes to the health of a stream ecosystem. For example, lawn fertilizers or salt deposits washed from rainstorms can quickly build up in our reservoirs or drainage systems. These problems created by us can lead to myriad issues including changing the pH, temperature, or even flow of the river, which can ultimately deteriorate the river and organisms over time. The Park River Watershed can help orient these interested groups towards annual activities that improve water quality and gather information from these events and organizations. Thus, we are able to gain aggregate site specific data.
Collected data can then be forwarded to state and federal environmental programs or government agencies as well as nonprofits that work on the larger water bodies such as Connecticut River Watershed Council and Save the Sound, which is the Long Island Sound coastal environmental nonprofit group.
With help from Trinity College students, Shaina Lo and Veronica Armendariz were able to create data visualizations about certain schools in the Park Watershed that incorporates environmental goals into their school curriculum. Public school information was obtained from the SmartChoices website, and the Park Watershed Project categorized the school data. From this website, one can read further on deciphering the differences between the types of SmartChoices schools around the Hartford area region. SmartChoices includes public school in the city of Hartford as well as 19 other suburban towns.
This interactive data visualization can help parents around the Hartford area view specific schools they are interested in for their children that are concentrated on environmental goals. It my also be helpful for teachers or people interested in the educational system to help them discover these specific schools that are in or around the Park River Watershed.
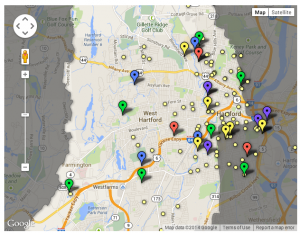
Below are the descriptions and color identifications for each school:
Yellow/1) Water or wetland adjacency: school grounds are within walking distance of a river, brook, or pond. This increases opportunity for water quality monitoring, environmental research and stream stewardship.
Green/2) Environmental goals: School curriculum prioritizes natural sciences, which increases potential for local environmental research and stewardship.
Purple/3) A nature trail, park, or open space within walking distances indicates opportunities for classroom or extra curricula site specific (environmental activities).
Pink/4) Science goals could include topics such as medicine or technology that is not directly related to the environment.
Red/5) STEM schools are schools that concentrate on Science, Technology, Engineering, and Math.
