Prospect Ave, A Game of Inches: Educational Opportunity Between Hartford & West Hartford

Posted on

Rolling the Dice on Prospect Ave

Prospect Ave:

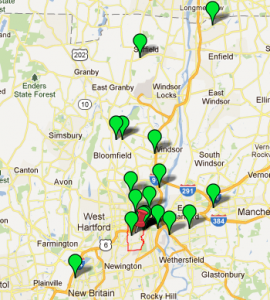
Source: Prospect Ave from Google Maps 4

Prospect Ave is one of the main roads which connects Hartford and West Hartford and the specifoc differences in lifestyle between the odd numbered and even numbered houses will be the focal point of my argument. It is one of the original roads in CT and has been around since the time of redlining when many of Hartford’s minority residents began to trickle in. In the mid – late 1900’s, Prospect Ave was a landmark for where the suburbs ended and the ghettos formed due to redlining. It was this landmark that not only marked a severe change in housing and economic status but also in regards to the educational opportunity of the areas of Hartford and West Hartford. The left of the map consists of West Hartford public schools as well as the educational opportunity which comes along with the financial status of the area. On the right, Hartford public schools and educational inequality for those who were not blessed with the same financial opportunities.

Intro

The word segregation carries many different meanings for many different people. It is used mainly to describe the hardships and separations that minorities have faced and will face in the future. Today most people, however, don’t think of segregation having to do with educational opportunity. Within the past hundred years, Hartford Connecticut has gone through more change than almost any other city in the U.S. Hartford. One of the largest problems in Connecticut today is the achievement gap in education. The tricky part in getting people to pay attention to this problem is that to most people it is old news. Many policies have been implemented, money has been given to schools, and there is still a serious problem in Connecticut. In Connecticut the CMT or the Connecticut Mastery Test determines the standard for achievement. The CMT tests students in the areas of Mathematical reasoning, reading, writing, and science. I believe that this is incredibly important and deserving of a website due to the fact that it many people discuss the achievement gap in CT but disregard the massive discrepancy between the neighboring cities of Hartford and West Hartford. It is always important to look at the fine print in each study, and the fine print within the CT achievement data is the incongruity between West Hartford and Hartford, which has one of the lowest performances on the CMT.

Below is a sample question from the CMT online practice test as well as a link to the CMT full practice test:

Source: CMT Practice Test 1

The Hartford area is unlike any other area where at one point you can be in one of the poorest cities in America and within a 10-minute drive down the road be in one of the richest. Educational achievement gap is nothing new but the fact that when compared to low-income students from other states, Connecticut’s low-income students place in the bottom tier of achievement tests. This is due to the sole purpose of the cycle that has been created in Connecticut. Children who grow up in the impoverished areas especially Hartford don’t get the same experience out of their schooling due to their financial limitations. Due to these limitations in Hartford many youths either make it through high school to get a mediocre job, drop out before school ends, become affiliated with gangs, or worse. It is completely different when one lives in West Hartford. There is more money for education and therefore the children who live there or go to school there have a much higher chance of making it in the real world. I believe that there is a direct correlation between the achievement gap and the past racial inequality of the early 1900’s, the newer economic inequality of CT, and the educational inequality between Hartford and West Hartford in today’s society. Those points, along with the data from the national center of education statistics and the Connecticut counsel for educational reform I believe will be crucial in deciding why Hartford, CT has such a difference between its wealthy and poor in regards to education. In my opinion, the ridiculous discrepancy between low performers and high performers echoes the states ridiculous gap between wealthy and poor and between once segregated and non-segregated in Hartford. The gap between low income and high-income students in Connecticut is one of the highest in the U.S. Most people when they hear the words achievement or inequality automatically assume that the topic at hand is due to race. In the case of Connecticut, the gap began as a racial problem and has slowly evolved over the years into an economic one. This evolution has molded race and economic status into one determinant of educational outcome depending on how much money ones family makes, what race you are, and most importantly which side of Prospect Ave you were live on.


Prospect Ave Then:

Source: Map of racial makeup on both sides of Prospect Ave from the year 1920. Maps provided by UConn Magic 3
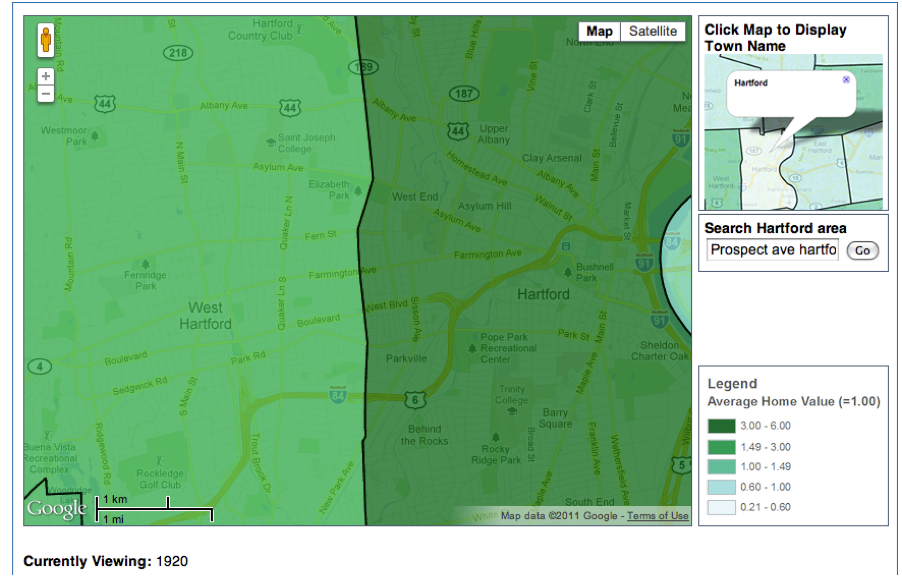
Above: Map of home value index on both sides of Prospect Ave from the year 1920. Map provided by UConn Magic 3

Since the abolition of slavery, minorities had been trickling up north for a chance at equal opportunity. “As the Reconstruction Era drew to a close, black-white relations came to be governed by the increasingly harsh realities of the Jim Crow system, a set of laws and informal expectations that subordinated blacks to whites in all areas of social and economic life”(American Apartheid, 9). These Jim Crow laws did not augment segregation, they simply regulated in which ways whites and blacks made contact. The main limitation Jim Crow laws helped to construct is the ghetto. The first ghettos were created in response to the overwhelming amount of minorities that occupied the north during industrialization. Since minorities were denied home ownership in white areas minority neighborhoods began to form. From the 1930’s on we begin to see the majority of barriers in housing begin to rise which would eventually lead to educational boundaries. It was at this time when “redlining” was born. The largest contribution in terms of educational opportunity from redlining was the beginning of the “suburbs”. The suburbs, at the time, were neighborhoods where whites could live without the worry of minorities moving in and as more blacks migrated to the north more whites moved out to the suburbs. Suburbs consisted of richer households, which provided more money to the state for their district and therefore had more prestigious schools to send their kids to. The decade went on and ended in suburban domination of economic status in West Hartford. For Hartford however, record unemployment, inflation, falling wages, increasing income inequality, and rising rates of black poverty continued to downgrade the educational opportunity of children. The ghetto had created the underclass, an area of economic non-sufficiency and educational mediocrity, which was nearly impossible to escape.

Prospect Ave Now:

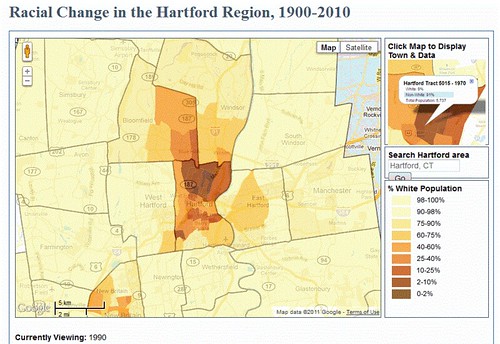
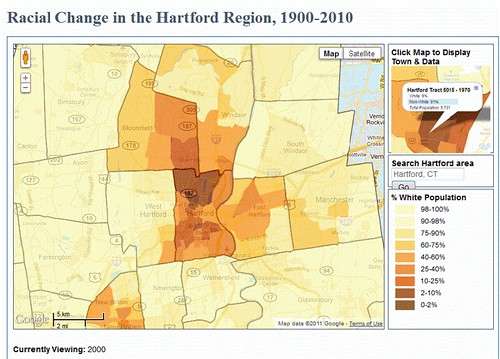
Source: Map of racial change on both sides of Prospect Ave from the year 2010. Maps provided by UConn Magic 3
Source: Map of home value index on both sides of Prospect Ave from the year 2010. Map provided by UConn Magic 3

Through the creation of ghettos and redlining however minorities were trapped into the low-income housing they are today in Hartford. Hartford has become one of the poorer areas and is mostly consistent of minorities whereas West Hartford has become one of the more well off cities in Connecticut. Hartford today, due to these constraints looks a lot different than it used to and its youth are paying the price. The only difference between then and now is that the reasons for inequality of schooling have shifted from racial to economic. Today families in Hartford cant afford supplies, books, or in some cases to even send their children to school. This is due to the economic constraints they have which were passed on from the racial constraints they once had as well.

The Story of Two Hypothetical Students

Enrique

To create the best argument for my example I will be using two hypothetical students: Enrique and Erik. Enrique is a boy from Hartford, CT. He is in the 8th grade and goes to a public school in the Hartford district. Him and his parents were born and raised in Hartford not far from Trinity College and have never left the state of Connecticut. Enrique’s father is in and out between multiple jobs but cannot seem to keep a stable one during these times of financial insecurity. His mother is working two jobs as both a caretaker during the day as well as a nighttime manager for a local restaurant. Enrique very recently took the CMT at his middle school and has just gotten the results back in the mail. Before we take a look at his scores I believe it is incredibly important that we take a look at the main characteristics of his district in order to decide whether or not Enrique was given the same opportunity of success as the students on the other side of Prospect Ave in West Hartford.

Even though the students are completely hypothetical cases the data that is being used to describe them is real.

1. Economic:

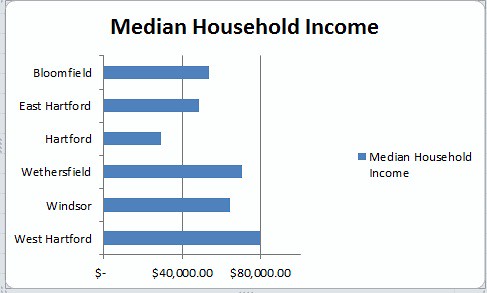
Hartford is listed as one of the poorest areas in the state of Connecticut as of a 2009 study. The average family income is $28,300, which is $38,734 less than the state average of $67,034 and $50,188 less than the average family income in West Hartford. These economic troubles are a main reason for why the Hartford public school system and the families involved in it can’t afford supplies, books, or in some cases to even send their children to school. These economic hardships do not allow for children to have the possibilities of tutors and practice tests in order to get them ready for the CMT.

Source: Hartford CT Profile 6

2. Enrollment:

Source: State Deptartment of Education 8

The enrollment in the Hartford public school district is just about 21,000 students, which is 11,000 more students than its neighboring West Hartford public school district. This is an important stat firstly, because it greatly throws off the student teacher ratio. Schools with a low student to teacher don’t allow kids the best chance to succeed due to the fact that when there are more students in the class the teacher has fewer time with each individually. Students need time to ask their teachers questions and more importantly to have quality one on one time with them to cement their skills. Secondly, this is important because of how little money the Hartford public school system has to spend once it has reached it budget due to the per pupil expenditure rate which will be covered in the next section.

3. Per Pupil Expenditure:

Source: State Deptartment of Education 8

Source: State Deptartment of Education 8

Since enrollment is in regards to the topic of finance it is also important that we take a look at the per pupil expenditure for the Hartford public school system. Since Hartford has about 11,000 more kids than the West Hartford district they should receive a substancial amount more money for those extra students. It is important to look at how the money given to the the schools are spent, especially in comparison to West Hartford. For the most part both districts are similar but total spending is in favor of Hartford. Hartford’s district is spending $3,000 more than West Hartford’s but is that really enough money to make up for those extra 11,000 children? When taking into account a child’s education and future it is not simply enough to split $3,000 11,000 ways. When you divide all that money up it comes out to roughly 27 cents per child. The lack of money that is donated to the Hartford public schools due to their economic status doesn’t satisfy the necessities that each child needs. Although they are given an amount which is supposed to meet the needs of the child, it really doesn’t. Higher enrollment with a smaller budget leads to the lack of school supplies, food, and teachers that we see within the Hartford public school system.

4. Staff:

Source: State Deptartment of Education 8

The staffs of Hartford public schools are paid just around the state average. This amount of money is paid out to them because it is not easy teaching in this district of public schools. Teachers here have one of the toughest jobs in Connecticut in teaching in Hartford. It is hard to find people who genuinely love teaching to the extent in which they do. Many students do not care about their performance and have fallen into a performance stereotype of “I cant get good grades so why try” and the teachers are the ones who must inspire them to change that. These numbers are similar to those of West Hartford and are one of the few closely comparable stats between them.

Source: State Deptartment of Education 8

Although the statistics for teachers were very similar to that of West Hartford it is important that staff experience and qualification are taken into account as well. Hartford’s percentage of teachers with their masters degree or higher is much lower than West Hartford’s as well as a good amount of the surrounding districts. This is a severe blow to the children’s ability to learn and prepare for the CMT. It is not about how much money the teachers make but more importantly whether or not they will be able to provide the students with the mental stimulation they need in order to continue to learn. Teachers with master’s degrees are able to provide that stimulation and push the children to learn which is necessary in order for them to do well on their testing.

District CMT Performance Since 1993:

A data table representation of CMT performance in Hartford since 1993. Data source: Connecticut Mastery Test 10 & Connecticut Student Assessment 11

Results:

Source: State Deptartment of Education 8

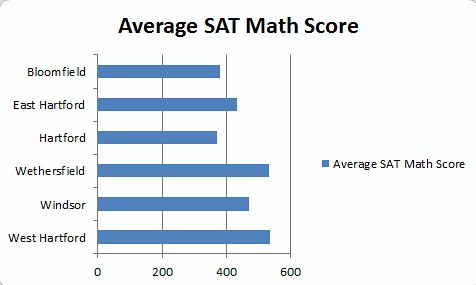
Now that we have looked both the averages in CMT scores for this year, as well as the positives and negatives in regards to the opportunities provided by the Hartford public school system, it is time that we look at Enrique’s results. He scored a 220 on the mathematical section, a 230 on the reading section, a 210 on the writing section, and a 220 on the science section. All of these numbers are similar to the district averages with a few points being higher or lower here and there. It is important to remember that Enrique just like so many of the other children in Hartford public schools sadly, was not put in a position to succeed from the get go.  His scores are a reflection of how the racial inequality in the Hartford area stemming from the mid 1900’s has influenced the economic status as well as the educational success even for today’s youth.

Erik

Erik is the representation of a hypothetical boy from West Hartford, CT. Erik is in the 8th grade and from a very well off family in the West Hartford area. Him and his parents are born and raised in West Hartford and have been living in the same area all their collective lives. His father is a very successful lawyer and his mother is a stay at home mom. Erik attends public school in the West Hartford district and has just gotten his CMT scores back. Erik has been going to the best public schools in the area all of his life which have allowed him to train for the CMT through practice tests and adequate teaching over the past 8 years of him being in school. Before we take a look at the results of the CMT it is important that we look at the differences that Erik has had over the past years of learning in comparison to that of someone in the Hartford public school system. They are as follows:

1. Economic

West Hartford is listed as one of the top 50 wealthiest places in America. The average family income is $78,488, which is $11,000 more than the state average of 67,034. These economic benefits are crucial in funding the phenomenal public schools of the district. This economic superiority also allows for other benefits, which can yield to higher scores on the CMT such as tutors and practice tests.

Source: West Hartford CT Profile 5

2. Enrollment

Source: State Deptartment of Education 7

The enrollment of West Hartford public schools is at just about 10,000 kids, 11,000 less than that of Hartford public schools. This allows for smaller classes, which yields for more individual time and attention from the teacher on a daily basis. This alone time with teachers due to student teacher ratio allows students to learn in a one on one environment and gives them a safe environment to ask questions that they may not want to ask in front of their peers. They have more structured time to go over individual problems, which can lead to higher scores on their CMT testing.

3. Per Pupil Expenditure

Source: State Deptartment of Education 7

Source: State Deptartment of Education 7

West Hartford has very similar numbers to Hartford in regards to most categories. However, it is incredibly difficult for West Hartford to match the same per pupil expenditure due to the fact that they have 11,000 less children to take care of. The main difference in the two groups is in the the total expenditure category where Hartford is about $2,000 ahead of the state average and about $3,000 ahead of West Hartford. This shows a major lack in proper funding in the Hartford district. Hartford is given more money for the 11,000 more students they have, but even though they receive more money for those students is it really enough. $3,000 is not that substantial of a difference for 11,000 students especially when taking into account everything that those students need in order to get the most out of their schooling experience. Since they have fewer students enrolled and a much more manageable budget than surrounding districts they can afford better supplies and much more of them in comparison to other districts.

4. Staff

Source: State Deptartment of Education 7

The staff of the West Hartford public schools is paid very similarly to that of the Hartford public school district. It is important to note that since the teachers are being paid so much they are expected to get the most out of their students, which they have shown the ability to do more than those from Hartford. The hefty amount of money that they are being paid reflects the strength of their teaching ability as well as their experience. This stat is the only closely comparable stat between West Hartford and Hartford.

Source: State Deptartment of Education 7

It is not just important to note the amount of money the staff is being paid but also how qualified the teachers are. The amount of money they are being paid is due to the economic standing of West Hartford but is also due in part to the fact that they are the best and brightest out of most CT teachers. The fact that just about everyone in the West Hartford schooling district says so much about the quality of his or her teachers. In comparison with Hartford there is almost a 25% difference in teachers who have already obtained their masters. Teachers in West Hartford have had more time learning how to teach and therefore have a better chance in provoking more thought and stimulating student’s minds, better preparing them for the CMT.

West Hartford CMT Results Since 1993:

A data table representation of CMT performance in Hartford since 1993. Data source: Connecticut Mastery Test 10 & Connecticut Student Assessment 11

Results:

Source: State Deptartment of Education 7

Now that we have looked at a few of the main points which makes the West Hartford public school system so different, it is time for the results of Erik’s CMT. His results are very similar to those of many West Hartford’s public school students. Erik scored a 275 on math, a 260.3 on reading, a 270 on writing, and a 267 on science. His scores are very close to the averages listed above which is a greater example of just how well the West Hartford public school system prepare their children for the tests. Erik was blessed to be live on the more prominent side of Prospect Ave. West Hartford is much more financially well off and therefore students like Erik have a higher opportunity. It is apparent that even in today’s society there are still benefits stemming from the suburbs of the early 1900’s.

Closing

The results between both of the public school systems are astounding. It is apparent that over time race has attributed to economic status. It is also apparent that economic status provides a much more efficient and superior environment for education. More money means better supplies, better teachers, and more opportunities. Overall the West Hartford school system has demonstrated that it prepares its children for the CMT and also for all forms of education better than the Hartford public school system. As stated earlier, West Hartford was one of the earliest suburbs in CT and therefore has always had more opportunity as well as more money to fund education. The next step in this process is figuring out the first leap that needs to be made in order to catch the Hartford public school system up in hopes to get their achievement scores a little bit closer to those on the other side of Prospect Ave.


About the Author:

Bobby Moore is a junior at Trinity College in Hartford, Ct. He is from Silver Spring Maryland. Before Trinity went to the Landon School in Bethesda, Maryland. Bobby is an Educational Studies major with his concentration being in gender and racial studies.

Footnotes

1. Connecticut CMT. “Interactive Web Sample Items.” Interactive Web Sample Items. N.p., n.d. Web. 11 Dec. 2011. <cuacs8.mck.ncsu.edu/mathsampleitems/main.html>.

2. Department of Education. “The Center for Comprehensive School Reform and Improvement – State Achievement Data Web Sites.” The Center for Comprehensive School Reform and Improvement – Home. N.p., n.d. Web. 11 Dec. 2011. <http://www.centerforcsri.org/index.php?option=com_content&task=view&id=341&Itemid=23>.

3. Dougherty, Jack . “Maps created with UConn MAGIC | On The Line.” On The Line | a public history web-book by Jack Dougherty & colleagues Fall 2011 preview edition. N.p., n.d. Web. 11 Dec. 2011. <http://ontheline.trincoll.edu/maps/>.

4.Google. “Google Maps.” Google Maps. N.p., n.d. Web. 11 Dec. 2011. <http://maps.google.com/>.

5. “West Hartford, Connecticut (CT) profile: population, maps, real estate, averages, homes, statistics, relocation, travel, jobs, hospitals, schools, crime, moving, houses, news, sex offenders.” Stats about all US cities – real estate, relocation info, house prices, home value estimator, recent sales, cost of living, crime, race, income, photos, education, maps, weather, houses, schools, neighborhoods, and more. N.p., n.d. Web. 11 Dec. 2011. <http://www.city-data.com/city/Hartford-Connecticut.html>.

6. “Hartford, Connecticut (CT) profile: population, maps, real estate, averages, homes, statistics, relocation, travel, jobs, hospitals, schools, crime, moving, houses, news, sex offenders.” Stats about all US cities – real estate, relocation info, house prices, home value estimator, recent sales, cost of living, crime, race, income, photos, education, maps, weather, houses, schools, neighborhoods, and more. N.p., n.d. Web. 11 Dec. 2011. <http://www.city-data.com/city/Hartford-Connecticut.html>.

7. State Department of Education. “State Department of Education – CEDaR.”SDE Portal West Hartford. N.p., n.d. Web. 11 Dec. 2011. <http://sdeportal.ct.gov/Cedar/WEB/ct_report/SnapshotGeneral.aspx>.

8. State Deptartment of Education. “State Department of Education – CEDaR.” SDE Portal Hartford. N.p., n.d. Web. 11 Dec. 2011. <http://sdeportal.ct.gov/Cedar/WEB/ct_report/SnapshotGeneral.aspx>.

9. Douglas Massey, American apartheid : segregation and the making of the underclass (Cambridge  Mass.: Harvard University Press, 1993).

10. “Connecticut Mastery Test – Connecticut State Department of Education.”. N.p., n.d. Web. 13 Dec. 2011. <http://www.csde.state.ct.us/public/cedar/assessment/cmt/cmt_data.htm>.

11. eMetric. “Connecticut Student Assessment.”. N.p., n.d. Web. 13 Dec. 2011. <http://www.ctreports.com/>.

Housing in Greater Hartford: Does it Affect Education?

Posted on

Housing in Greater Hartford: Does it Affect Education?

Select suburbs in the Hartford region have seen a significant increase in residents of color over the past twenty years. Our focus for this project will be to explain this shift in housing values and how it affects schools and the neighborhoods where these schools are located.

Home Value Index in Hartford Region, 1910
Click to open in a new tab/window. Map created by MAGIC, University of Connecticut (http://magic.lib.uconn.edu/otl/timeslider_homevalue.html)


The Home Index Value Map shows how many homes in Hartford have decreased in value (0.21-0.60). West Hartford has a much higher average home value (1.00-1.49), and Bloomfield, Windsor, East Hartford and Wethersfield all have similar average home values (0.60-1.00).

Hartford and the towns which border Hartford are very unique in terms of racial composition. When you take a closer look at the racial composition of these towns (according to U.S. Census Data): East Hartford is 51.3% White; Hartford is 43.4% Hispanic, Wethersfield is 89.5% White; West Hartford is 79.6% White and Bloomfield is 54.1% Black. These percentages represent a portion of the total population in each of these towns, respectively.

Map # 1
Click to open in a new tab/window. Map created by MAGIC, University of Connecticut (http://magic.lib.uconn.edu/otl/timeslider_racethematic.html)

The map (above) shows Racial Change in the Hartford Region in 1990. The darker areas on the map represent concentrated areas where the non-white population is very high.

Map # 3
Click to open in a new tab/window. Map created by MAGIC, University of Connecticut (http://magic.lib.uconn.edu/otl/timeslider_racethematic.html)

The second map (above) shows the racial composition of the Hartford Region in 2000. Over ten years there has been a significant increase in residents of color. Hartford has the lowest percentage of White population. The White population in Bloomfield is between 2-10% at most, which is the lowest of all of Hartford’s surrounding suburbs.

After examining the maps, it was clear that more and more residents of color began inhabiting Hartford and many of the towns surrounding Hartford, with the exception of predominantly White communities such as West Hartford and Wethersfield. We began to look at sources that could provide more information about these trends.

Explaining the Shift in Racial Composition

According to US Census Data [taken at the time], by 1970, the population in Hartford, CT was down to 158 thousand. In the decades preceding the 1970’s, there was a clear shift in the racial makeup of Hartford’s population. Jamaicans were coming to the city to participate in the labor demand in agriculture, for example. By 1960, the Puerto Rican population in Hartford was around 6,000. The Black population rose significantly as well.

As the city’s minority population grew during the 50’s and 60’s, the whites who formerly resided in these areas were relocating to the suburbs, more importantly, almost entirely all-White suburbs.

“The lowest-income families were concentrated in the largely black North End, while more affluent families were in the western portion of the city near the West Hartford line…” (Weaver 1982: 137).

United States Federal Laws and Policies have also contributed to the decay of poor and minority neighborhoods in Hartford. Racial restrictions on mortgages and housing were
permitted by The Federal Housing Administration until the 1960s.

One factor we considered could have been a causal factor for this shift was Reverse Redlining. “Reverse redlining occurs when a lender or insurer particularly targets minority consumers, not to deny them loans or insurance, but rather to charge them more than would be charged to a similarly situated majority consumer.” [Muhammad & Ehrenreich, 2009]

This was practiced in Hartford and currently, Hartford has the lowest home values in the entire region. With lower home values comes dis-investment in neighborhoods. Banks are replaced with check cash institutions and social services offices. Neighborhoods in Hartford show clear signs of neighborhood tipping, or declining neighborhoods. [Examples of this are front lawns being mostly dirt (no grass) trash scattered on the streets, front or back doors of multi-unit complexes being constantly open (absentee owners), etc.]

Reverse Redlining by lenders and real estate firms and red-lining by banks and other institutions have contributed effectively to the current state of many neighborhoods in the City of Hartford. It is important to note, that you cannot expect residents of any given community to be engaged in said community if others are not.

Researching for the Project

Upon inquiring for information from several Housing authorities both in Hartford and other towns in Connecticut, I was led in the right direction by Sophie Starchman, Family Self-Sufficiency Coordinator of the West Hartford Housing Authority and a graduate of Trinity College.

“Public Housing Authorities are not lenders or insurers. However, we do use Fair Market Rents (determined by the Department of Housing & Urban Development) in Rent Calculations. For instance, if a Landlord requests a rent increase, then their Section 8 Tenant’s Caseworker will complete a Rent Reasonable calculation using FMR (included below), Income Limits, and information from the apartment. Some of the factors that affect the cost of rent for both minorities and non-minorities are: location, census tract, condition, accessibility, unit type, year built, square footage, # of bedrooms and baths, amenities, facilities, and provided maintenance/services. “

In theory, using housing authorities as our starting point was a good idea. One flaw in our preliminary research was that we did not clearly understand the mission of the housing authority before we reached out to them. This is perhaps due to a lack of information on their part, as many of the websites we visited did not discuss the mission of the organization clearly, but rather, listed what they could offer clients.

Next, we emailed the Principals of each of the largest High Schools in the Hartford region (Conard High, Wethersfield High, East Hartford High, Bloomfield High, Windsor High) and asked them about their schools and the neighborhoods where the schools are located. No one replied.

My partner and I decided to take a different approach. We went out into each of the towns surrounding Hartford: Wethersfield, Bloomfield, East Hartford, Windsor and Hartford, and took photographs of the High schools and the neighborhoods where these high schools are located. All of the photographs used in this project belong to us. We did independent research and have cited the scholarly material where we found our information.

In the next section, we will discuss the towns surrounding Hartford, and provide possible explanations for the increase in residents of color inhabiting these areas.

Viewing The Hartford Region

Hartford:

The City of Hartford is the Capital City of Connecticut. In 2010, Hartford was recorded as having a population of 124,775 people. There is a 29.8% White population, a 38.7% Black population and 43.4% of the population were reported as having Latino origin. In Hartford the median household income is $29,190 as opposed to the $67,721 median for the entire state.

Hartford Public High School
Hartford Public High School (Photo by Carlos Velazquez)

The Hartford Public School system is notorious for being a consistently below average school system. Statewide, the range (%) of students meeting state goal was between 42 and 55 % on the CAPT Test. At Hartford Public High School, the range of students meeting State Goal for all CAPT testing was between 1.9 and 6.6%. Similarly, average SAT scores ranged from 371-387 (out of a possible 800 points) where the Statewide average was between 503 and 507 (out of a possible 800 points).

Hartford Public High School
Hartford Public High School (Photo by Carlos Velazquez)

This is particularly concerning, given the fact that you are given an automatic 200 points on the SAT if you write your name correctly.

Hartford, CT
South Marshall Street Neighborhood (Photo by Carlos Velazquez)

Travel Log: Hartford had much poorer neighborhoods that the other towns we visited. The South Marshall Neighborhood (by Hartford Public High School) was comprised mostly of apartment complexes. On the right side of the street we saw a Habitat for Humanity building site (funded by Trinity College Habitat Club). There were several kids and adults hanging in the neighborhood. Hartford High was the largest school we saw in our travels. Graffiti could be seen in many places around Hartford High and the surrounding neighborhood. Unlike many suburban communities, not everyone in Hartford has access to a painting workshop or a community center. Many youth especially in Hartford use graffiti is a method by which they can express themselves artistically.

Windsor:

Windsor High School presents much diversity. 53.9% of the student body is Black; 31.1% of the student body is White and 10.3% of the Student body is Hispanic. Compared to other schools in surrounding districts, Windsor High has performed proficiently. CAPT scores are much closer to the State average: the range of students meeting state goal is between 28 – 45 % (State Average is between 45 – 60 %) .

Windsor High School
Windsor High School (Photo by Carlos Velazquez)

Furthermore, the range for SAT scores was between 455 – 470 (of 800 points) compared to the State average of 503-508 (of 800). Graduation rate at Windsor High is 90% (State Average is nearly 92%).

Residential Neighborhood, Windsor, CT
Residential Neighborhood, Windsor, CT (Photo by Carlos Velazquez)

The town of Windsor is a suburb located directly north of the City of Hartford. Windsor is home to four elementary schools, one middle school and one high school. At the time of the last full census survey the number of people in Windsor, CT was 28,237. 65% of the total population is White, while 27% is Black. 5% of the population reported being of Latino or Hispanic origin. The median household income for Windsor is $64,137 putting it right in line with the state average of $67,721.

Windsor, CT
Neighborhood next to Windsor High School Residential (Photo by Carlos Velazquez)

Travel Log: Upon entering Windsor, we saw the town center, which included a post office, banks, shops, a school and a masonic hall. It was clear that the neighborhood was prospering. We had to stop more than once for directions, and ran into a group of teenagers who wanted to lead us in the wrong direction, as we were trying to get to Windsor High School. Eventually, we found someone who lead us to the school. Once we got to the school, we examined the neighborhood. There were for the most part one family homes. It was a quiet suburb, and many of the homes had nice lawns and well kept gardens.

West Hartford:

Conard High School
Conard High School (Photo by Carlos Velazquez)

In our research, we examined West Hartford’s Conard High School. Conard is a relatively diverse school, 11% of Conard’s students are Black and 18.5% of students are Hispanic. Conard also has a size-able Asian community rounding out at 10%. The school’s graduation rate is 95% and it’s CAPT and SAT scores are above the state average. Conard continues to maintain an outstanding reputation. As recognized in Newsweek magazine, Conard is rated in the top 1% of American high schools for the number of Advanced Placement (AP) and college credit courses offered, exams taken, as well as its efforts to prepare students for the AP exams.

West Hartford,CT
Neighborhood next to Conard High School (Photo by Carlos Velazquez)

In the 1940’s, West Hartford included many neighborhoods which were racially restrictive covenants. Racially restrictive covenants refer to contractual agreements that prohibit the purchase, lease, or occupation of a piece of property by a particular group of people, usually African Americans. This practice became common in 1926 after the U.S. Supreme Court decision, Corrigan v. Buckley, which validated the use of said covenants. In towns such as West Hartford, racially restrictive covenants were used to concentrate the “wealth” and a certain population/racial group in particular neighborhoods.

Ms. Mary Everett moved into the Ledgewood Road neighborhood in West Hartford, Connecticut in the 1970s (formerly a racially restrictive covenant from the 1940s). In an interview conducted by the Cities, Suburbs and Schools project, Mary reflects on racially restrictive covenants, the changing racial composition of the population in West Hartford and the many years she has spent living there.

West Hartford Mansion 3
West Hartford Mansion (Photo by Carlos Velazquez)

Bloomfield:

Bloomfield, CT
"Welcome to Bloomfield" (Photo by Carlos Velazquez)

Bloomfield is a suburban area north of Hartford and West Hartford. Bloomfield is a smaller town with a population of around 19,587. The White population for the town of Bloomfield is around 40% while the black population is about 54%. Only 3.7% of Bloomfield’s populati on has reported being of Hispanic or Latino origin.

Bloomfield High School
Bloomfield High School (Photo by Carlos Velazquez)

Bloomfield High School (2)
Bloomfield High School (Photo by Carlos Velazquez)
Bloomfield High School (3)
Bloomfield High School (Photo by Carlos Velazquez)

88% of all students at Bloomfield H ig h School are Black. The only statistic that Bloomfield High School has in common with other schools in the State of Connecticut is the Graduation rate. The rate for Bloomfield High School is 91.2%, and the rate for the entire State is 91.3%. According to the most recent research on Bloomfield High School, conducted by the State of Connecticut Department of Education, Bloomfield High was performing at a significantly lower rate than other schools in the State in terms of Standardized test performance. Students at Bloomfield who took the Connecticut Academic Performance Test (Grade 10) were among those students performing below par. In Reading Across the Disciplines, 14% of Students met the State Goal, compared to 45.9 % Statewide. In Mathematics, 18.2% of students met State Goal compared to compared to 48.7% Statewide.

As for the SAT 1, the average score for the School in Mathematics, Critical Reading and Writing was 380, 402 and 403 (out of 800) respectively. The State’s average score ranged significantly higher, 508 in Math, 503 in Critical Reading and 506 in Writing.

Bloomfield, CT
Boarded up House, Bloomfield, CT (Photo by Carlos Velazquez)

Travel Log: Bloomfield had many rural areas with shopping centers scattered in between. We visited Bloomfield High School which was right across the street from a vacant plot. The neighborhood surrounding BHS had several vacant plots as well, and a few dilapidated homes, as well as a few boarded up buildings, but that was only in the immediate neighborhood. A few minutes north of the school, we found a thriving Town Center, and many one and two family homes.  This was one of the only towns we visited where we saw many teenagers/children walking up and down the streets.

East Hartford:

East Hartford has a population of 51,252 people and it resembles a miniature city much like West Hartford. Only 51.3% of the people in East Hartford are White and 26% of the population is black. 25.8% of the population are persons of Latino origin.

The median household income in East Hartford is $48,7 47 which falls below the state average of $67,721.

East Hartford, CT
Neighborhood next to East Hartford High School (Photo by Carlos Velazquez)
East Hartford High School
East Hartford High School (Photo by Carlos Velazquez)

SAT 1 scores were more comparable to the State Average at East Hartford High School. In the subjects of Mathematics, Critical Reading and Writing, the School averages were 432, 435, and 446 (out of 800) respectively. The State scores were 508 in Math, 503 in Reading and 506 in Writing.

East Hartford High School
East Hartford High School (Photo by Carlos Velazquez)

Travel Log: East Hartford High School was the hardest school to find. We did at least three loops on Forbes st. before finding it. Upon reaching the school, we immediately saw that EHHS was connected to another school, CIBA, the Connecticut International Baccalaureate Academy, separated only by a bridge. The school was empty and the neighborhood surrounding it was as well. The immediate neighborhood was comprised of one family homes, only.

Wethersfield:

Wethersfield, CT
Suburban Home, Wethersfield, CT (Photo by Carlos Velazquez)

Wethersfield is a small suburb to the south of the City of Hartford. Wethersfield has a population of 26,668 people. 89.5% of people in Wethersfield.

The median household income is $70,525 which is just above the state average of $67,721. are White and only 3.1% are Black. Around 8.2% of the population is of Latino origin.

Wethersfield High School (2)
Wethersfield High School (Photo by Carlos Velazquez)
Wethersfield High School
Wethersfield High School (Photo by Carlos Velazquez)

More than 3/4 of the Student body at Wetherfield High School is White (76.1%). Wethersfield High School has met and exceeded the State average in terms of both SAT scores and CAPT scores. The range for SAT scores was 515-532 (State range: 503-508) and for CAPT scores the percentage range of students meeting state goal was between 53 and 71%.

Travel Log: My partner and I both knew exactly how to get to Wethersfield High, because we both took the SAT’s there. Many of the homes in the surrounding neighborhood are one family homes, and were closer together than in other towns (smaller plots). We saw many people walking around the town, walking their dogs, and chatting up their neighbors. It was clearly a different type of community than the previous towns we visited.

CONCLUSION:

The following graphs show the Median Household Income and the Average SAT Math Scores for the six towns that we visited. When these two graphs are placed side by side you are able to see the direct correspondence between Income and Success in Education.

Median Household Income
SAT SCORES
Average SAT Math Scores

Our travels provided us with a glimpse of what the Greater Hartford area has to offer. There is a lot of diversity in Hartford and it’s suburbs. On our road trip we noticed that not every suburb was created equally and that there is a lot of economic inequality throughout the region. Over the past 30 years the racial composition of the Hartford region has changed tremendously and that racial change is a direct result of housing affordability. Where you can afford to buy a home has a direct correlation with the education that your children are afforded.

Sources:

Everett, Mary. Oral history interview on West Hartford, CT and restrictive covenants (with video) by Candace Simpson for the Cities, Suburbs, and Schools Project, July 21, 2011.Available from the Trinity College Digital Repository, Hartford Connecticut (http://digitalrepository.trincoll.edu/cssp/).

Ehrenreich, Barbara; Muhammad, Dedrick (September 13, 2009). “The Recession’s Racial Divide”. The New York Times. (http://www.nytimes.com/2009/09/13/opinion/13ehrenreich.html?pagewanted=all)

“US Census Bureau: Hartford County.” State and County Facts. Web. 02 Dec. 2011. (http://quickfacts.census.gov/qfd/states/09000.html).

“State Department of Education – CEDaR.” SDE Portal. Web. 04 Dec. 2011. (http://sdeportal.ct.gov/Cedar/WEB/ct_report/CedarHome.aspx)
.

Weaver, Glenn. 1982. Hartford: An Illustrated History of Connecticut’s Capital. Windsor
Publications, Inc.

Wilson, William Julius. 1996. When Work Disappears: The World of the New Urban Poor.
New York: Vintage Books.

Desegregated Schools with Segregated Classrooms: The Reality of Racialized Tracking at Magnet Schools

Posted on

Desegregated Schools with Segregated Classrooms

The Reality of Racialized Tracking at Magnet Schools

Introduction

Over the past decades, politicians, civil rights leaders, and community organizers have worked to give every Hartford child the opportunity to attend a racially and socioeconomically integrated school. Sheff v. O’Neill is a landmark civil rights lawsuit filed by Elizabeth Horton Sheff and other parents against then-Governor William O’Neill in 1989, claiming that the severe racial and socioeconomic isolation of Hartford school children violated the state’s constitution. However, this situation is not unique to Hartford. The Sheff case has implications for the dynamic between urban and suburban disparities nationally. The de facto segregation that the lawyers argue is to blame for the poor educational opportunities of Hartford students is, in fact, pervasive in nearly every city nationwide. All students stand to benefit from more racially integrated schools.

One aspect of the settlement, the creation of inter-district magnet schools, serves as one of the strongest means of remedying racial segregation in public schools, by bringing together children from both suburban towns and the city. “Magnet schools may very well be effective tools for desegregating at the building level. However, magnet schools may exacerbate or even cause within-school segregation.” 1 The goal of Sheff v. O’Neill is to promote desegregated schools. However its measure of desegregation is incomplete. Desegregation measured only at the school level does not indicate segregation at the classroom level.  Put simply, while an overall school may be technically desegregated, individual classrooms can remain highly segregated virtually eliminating any benefit of desegregation. “By definition, it is paradoxical to attach the label ‘desegregated’ to a magnet school that operates segregated classrooms. Nevertheless, the commonly accepted definition of desegregation permits a magnet school with racially segregated classrooms to be deemed desegregated.” 1 We argue that the state should create a more effective definition of desegregation that includes not only the overall school but also the classroom level. The state needs to addresses racialized tracking in desegregation efforts.

Sheff v. O’Neill

Sheff plaintiffs advocated for the State of Connecticut to uphold the constitutional rights of children in Hartford schools to equal opportunity. They argued that the Connecticut’s districting system based upon city and suburban boundary lines led to racially segregated schools. 3 “Hartford Public Schools’ population consisted of 91 percent minority students, surrounded by suburban district comprised of 88 percent white students.” 4 Although in 1996, the State Supreme Court ruled in favor of Sheff plaintiffs, “the Court did not specify a goal, remedy, or timetable to resolve the problem, stating that this responsibility belonged to the legislative and executive branches.” 5

Students in Hartford Attending Racially Isolated or Racially Integrated Schools

In 2003, the Sheff v. O’Neill reached to an agreement, to provide at least 30 percent of public school minority students with an educational experience with reduced isolation by using interdistrict magnet schools, the Open Choice program, and interdistrict cooperative programs. 3 Moreover, the agreement required the state to open and maintain two new interdistrict magnet schools in Hartford per year. Even though the state was pressured to take actions to alleviate the violation, this goal is not directly enforceable. Four years later, the goal was only met with approximately 10% of students attending less racially isolated schools. 5

Click Here to View the Sheff II Stipulation and Order (2008)

Since the state failed to make significant progress towards the goal (Sheff I), the plaintiffs returned to Court several times and lead a discussion on a second settlement. The Sheff plaintiffs claimed that the State was not doing enough to fill new magnet schools to capacity, declaring the state’s efforts to integrate Hartford students inadequate. Thus, the plaintiffs saw very little progress made by the state. On the other hand, the State “responds that it has complied with the settlement by opening two magnet schools per year, while phasing in grade levels as planned.” 8 The State managed to create 22 interdistrict magnet schools and enrolled 1,000 minority Hartford children in suburban schools. Both parties expressed common interest in increasing the racial, ethnic, and economic integration of Hartford Public School students.

Under the current settlement agreement (Sheff II), the plaintiffs requested more magnets schools to be built and increasing the number of seats for Hartford children in suburban public schools. In addition, the state and the plaintiffs agreed to achieve at least 35% of Hartford minority children have access to racially integrated schools by 2010-11 and 41% by 2013.

Check out the original 1989 complaint here!

The Magnet School

What are magnet schools? What is its role in public education?

Magnet School Population in Hartford

Magnet schools are public schools – they are tuition free schools that serve many different populations. Magnet schools are bureaucratically part of the public school system, which makes them different than private or charter schools. Public school districts oversee magnet schools. In some cases, however, inter-district magnet schools are operated by a separate system, like the schools part of the Capitol Region Education Council in Hartford that are managed by the Regional School Choice Office. Parents must apply for admission to magnet schools, which is frequently awarded through a lottery process. Inter-district magnet schools are financed through a mixture of state and local funds with certain schools receiving income from various federal or private sources. The bulk of operating costs, however, are covered through state allocation and the tuition the magnet school charges a student’s home district.

Available Magnet Schools for a Hartford Student Entering the 9th Grade

Magnet schools are different than zoned neighborhood public schools for in two respects. The first difference is the curriculum they offer. Magnet schools are not necessarily academically better than regular public schools; rather, magnet schools are able to offer more focused or unusual curricular offerings. For example, magnet schools in Hartford include the Greater Hartford Academy of Performing Arts and the University High of Science and Engineering, among others. The second difference is the student population magnet schools serve. Inter-district magnet schools enroll students across school district and town boundaries. Consequently, magnet schools generally have more diverse populations in terms of both race and socioeconomic status than zoned public schools.

Higher socioeconomic diversity and more specialized curriculum are benefits of magnet schools. There are, however, multiple drawbacks. Magnet schools are not neighborhood schools. Students sometime travel considerable distances to their magnet schools. If the distance along isn’t enough, the community dynamic present at a magnet school can be different than that at a zoned neighborhood school. This is not to imply it is worse, rather only that it is different. Also, unlike regular public schools, admission to magnet school is not guaranteed. Admission is based on academic merit or lottery. For example, in Hartford where admission is lottery based, a parent could apply to several inter-district magnet school but be accepted to none. Because of widespread popularity certain schools have large numbers of applications limiting acceptance to only a lucky few. Magnet schools are not without their faults and are not guaranteed to successfully create desegregation.

Tracking

Jeanie Oakes argues that there is a strong relationship between race or ethnicity and tracking as well as indirectly related to other socioeconomic characteristics. Her research found “the predominant pattern in racial composition, with disproportionately large percentages of white students in high-track classes and of nonwhite students in low-track classes.” 9 Her studies illustrate “classroom segregation does exist in many schools that are racially balanced at the building level…and evidence suggests that magnet schools often operate racially imbalanced classes”. 1 Minority students are over-enrolled in basic or remedial classes because of racialized tracking policies.

“The two factors repeatedly identified as causing classroom segregation within otherwise desegregated buildings are (1) methods of assigning students to academic programs, such as tracking, ability grouping, and remedial pull-out programs and (2) disciplinary practices that discriminate against minority students”. 1 There are differences in the quality of the educational experiences in different track levels. Disproportionately large percentages of poor and minority students are more likely to be placed in low-track classes. They benefit least from schooling and receive a poorer quality of educational experience in classrooms. On the other hand, affluent white middle and upper class students are more likely to be placed in the high-track classes and receive better quality instructions. High track classes prepare students for success in college academic work, while the low-track classes prepare students low occupational level jobs. As a result of students in different track levels being exposed to different material, nonwhite students do not have the same opportunities to learn the same content as the white students. This creates inequality in the distribution of knowledge.

We propose schools to practice detracking in the classrooms. Detracking is a response to remedy the inequalities caused by tracking. We are not arguing that tracking itself is the problem. Rather, we argue the problem is the failure to effectively address the strong correlation between race and academic track in school desegregation policies. “In detracked setting, educators intentionally group student heterogeneously, balancing groups in terms of race, gender, and academic ability.” 12 When classes are detracked, students from various backgrounds are brought together. As a result, it breaks down socioeconomic barriers and allows students to benefit from one another academically. Low-track students are given the opportunities to develop academic skills, while white students’ preconceptions and stereotypes about minority students’ abilities are diminished. To provide a better education for all, classes should be detracked. Consequently, detracking is a reform that would help lessen the academic disparities among low-income and minority students.

What We Know and What We Don’t

Each year, the State of Connecticut publishes strategic district and individual school profiles. Each district and every public K-12 school is included. Click here to see a sample school profile: HMMS Strategic School Profile (2009-2010). This information is all publically available on the CT State Department of Education. The school profiles provide a wealth of specific information, including racial demographics, testing performance, total hours of instruction time, along with many other quality indicators. However, references to tracking are absent from the report. Much of this is following No Child Left Behind (NCLB) regulations that require enrollment and school testing data be disaggregated according to gender, major racial and ethnic groups, disability, English proficiency, and economic status. NCLB addresses the fact that historically, the academic progress of limited English proficient students and certain minority groups was inadequate. Because performance data was only assessed previously at the school-wide level, variations among subgroups remained hidden (1). Although this stipulation of NCLB has had significant impact on awareness of educational disparities, it only requires that schools disaggregate testing data. It does not require schools address other forms of racial disparities within the school environment, such as tracking.

The Sheff v. O’Neill settlement set guidelines for school desegregation. The case legally defined desegregation, which now defined as no more that 75% minority students. However, even when combined with the previously discussed NCLB testing standards this percentage enrollment does not sufficiently address tracking patterns within school. Schools do not officially report racial demographics of the different academic tracks. Although through ethnographic data and other academic research it is recognized that minority students are disproportionally placed in low-track classes, there is minimal state or district wide data on this subject. Searching through the CT Department of Education website, individual district or school pages, and CEDaR (the CT government database for education statistics and research) yields no specific information. While a school may be considered desegregated and report testing differences among historically under performing subgroups, we have no information regarding racial demographics within the classrooms. Put simply, we have no widespread statistical data regarding school tracking.

Conclusion

The Sheff plaintiff measures its goal of integrated schools by having the state meet at least 30% of Hartford minority public students educated in racially integrated settings, which is defined as having a student population that is no more than 75% minority. According to the case, “reduced-isolation setting refers to an educational setting with reduced racial, ethnic, and economic isolation”. Schools “provide a reduced-isolation setting if its enrollment is such that the percentage of minority students in the school does not exceed the Desegregation Standard.” 13 Simply, schools can be labeled reduced isolation settings without acknowledging academic disparities within the school. As long as the school meets the enrollment percentage the school is considered desegregated. However, how can true desegregation and equal opportunity be defined using only a simple numerical standard?

We believe that measuring desegregation only at the overall school level is ineffective because it does not provide insight into intra-school policies or practices. Minority students enrolled in a magnet school meeting Sheff desegregation guidelines may in fact be racially isolated within the school because of tracking practices. It is not enough to just evaluate the level of desegregation based on the calculated percentage of Hartford minority students who were enrolled in magnet schools. We argue that court’s definition of desegregation should apply to classrooms as well as schools. In order to analyze effectiveness of desegregation, there needs to data on classroom racial balance. “Nevertheless, because academics have failed to evaluate desegregation plans in terms of their success in eliminating within-school segregation, magnet schools have been deemed effective desegregation tools”. 1 Although we realize that school desegregation is an enormously complex and highly politicized issue, we believe that more can be done with respect to how desegregation is defined at the policy level. Future legislative goals should incorporate the racial composition of the classrooms to more fully ensure that students are receiving an integrated education. Requiring racially integrated classrooms is necessary to bridge the educational disparities between cities and suburbs.

If you are interested in more information about the Sheff Movement or magnet schools, we encourage you to visit the links below:


About the Authors

Pornpat Pootinath  is a sophomore at Trinity College, CT majoring in Educational Studies and Sociology. She serves as an academic facilitator at Hartford Magnet Trinity College Academy and teaches ninth-grade mathematics. On campus, she is a resident assistant, teaching assistant, public relations of AASA, and an active member of Stop the Raids.

Nathan Walsh is a senior Educational Studies Major at Trinity College. His academic interests include urban education reform and the role of public education as a tool for social change.

  1. Kimberly West. “A Desegregation Tool That Backfired: Magnet Schools and Classroom Segregation.” The Yale Law Journal, Vol. 103, No. 8, Symposium: The Informal Economy (Jun., 1994): 2567. http://www.jstor.org/stable/797056.
  2. Kimberly West. “A Desegregation Tool That Backfired: Magnet Schools and Classroom Segregation.” The Yale Law Journal, Vol. 103, No. 8, Symposium: The Informal Economy (Jun., 1994): 2567. http://www.jstor.org/stable/797056.
  3. “Sheff Movement: Quality Integrated Education for All Children” http://www.sheffmovement.org/index.shtml.
  4. Jack Dougherty, Christina Ramsay, and Jesse Wanzer, “Sheff v. O’Neill: Weak Desegregation Remedies and Strong Disincentives in Connecticut, 1996-2008,” in From the Courtroom to the Classroom: The Shifting Landscape of School Desegregation, ed. Claire Smrekar, and Ellen Goldring (Cambridge, MA: Harvard Education Press, 2009).
  5. “Sheff Movement: Quality Integrated Education for All Children” http://www.sheffmovement.org/index.shtml.
  6. “Sheff Movement: Quality Integrated Education for All Children” http://www.sheffmovement.org/index.shtml.
  7. “Sheff Movement: Quality Integrated Education for All Children” http://www.sheffmovement.org/index.shtml.
  8. “Sheff Movement: Quality Integrated Education for All Children” http://www.sheffmovement.org/index.shtml.
  9. Jeanie Oakes. Keeping Track: How Schools Structure Inequality (New Haven: Yale University Press, 1985).
  10. Kimberly West. “A Desegregation Tool That Backfired: Magnet Schools and Classroom Segregation.” The Yale Law Journal, Vol. 103, No. 8, Symposium: The Informal Economy (Jun., 1994): 2567. http://www.jstor.org/stable/797056.
  11. Kimberly West. “A Desegregation Tool That Backfired: Magnet Schools and Classroom Segregation.” The Yale Law Journal, Vol. 103, No. 8, Symposium: The Informal Economy (Jun., 1994): 2567. http://www.jstor.org/stable/797056.
  12. Mica Pollock. Everyday Antiracism: Getting Real about Race in School (New York: New, 2008).
  13. Sheff v O’Neill, Stipulation and Proposed Order, Connecticut Superior Court, April 4, 2008, available from The Sheff Movement website, http://www.sheffmovement.org/pdf/SheffPhaseIIStipandOrder.pdf
  14. Kimberly West. “A Desegregation Tool That Backfired: Magnet Schools and Classroom Segregation.” The Yale Law Journal, Vol. 103, No. 8, Symposium: The Informal Economy (Jun., 1994): 2567. http://www.jstor.org/stable/797056.

A Step-by-Step Guide for Parents: School Choice Shouldn’t be this Complicated

Posted on

The purpose of this website is not to tell parents about each individual school in Hartford and its suburbs, but rather it is to show what kinds of options Hartford families have for schools for their children.

Where can I start?

This chart explains the types of schools starting with interdistrict and district. The district path is not as extensive, although there is still a considerable amount of information a parent should know about staying within district schools. If you select interdisctrict schools, you will learn more about Open Choice,  Magnet Schools and Charter Schools. Clicking on each heading will also take you to a website that can provide more information about that particular type of school. In addition, we have hyperlinked other useful information such as brochures, applications and current research. This tool should serve as a guide for parents and anyone interested in school choice in the Hartford region.

With this flow chart it is much easier to understand which options are available with the different interests that parents have for placing their students in a school in Hartford and the surrounding suburbs.  To go one step further, if you click on the links below, there is an in-depth definition of what each option is.

CREC –> HPS

DISTRICT

How much choice is too much?

A clear solution to Hartford’s battle with equal education has been to implement more options for parents. However, with too much choice it becomes increasingly difficult to figure out the best pathway for your student.  The following picture depicts district and interdistict schools at the elementary level near Trinity College. In this search, 35 schools were listed – and this is only elementary.

Source: SmartChoices1

With all of this choice, we hope to help Connecticut parents make sense of the options they have. If parents are more aware of their options, they can make more informed decisions for their child. Parents must consider a number of factors when choosing a school: location, demographics, test scores, size, etc.

How did we end up with all this choice?

The history of school choice in Hartford goes back decades from now and includes many different types of school reform and programs with the goal of continuing to decrease the separation of race from school to school in both cities and suburbs.  The most basic of all school choice options began in the 1950’s where students had the ability to choose which type of school they wished to attend, for example: a technical school where students could choose a specialty and be trained specifically for it, or a “regional agriculture science and technology education center.” 2
In 1966 school choice expanded to suburban and city students.  Project Concern allowed urban students to attend suburban schools, giving them a different type of education and opportunity, as well as integrating the racially separated schools, which is a similar goal of the school choice programs in Hartford today.  The number and types of schools continued to increase under Project Concern with the opening of Hartford’s first regional magnet school in 1991 and the opening of the first charter school in 1997.
The Project Concern program was the basis of school choice in Hartford until 1998-1999 with the introduction to today’s current Open Choice Program.  The Open Choice Program was even more effective in equalizing the racial demographics of schools because it not only allowed urban students to attend suburban schools, but also suburban students to attend urban schools. 3
People seemed to be content with the new Open Choice Program in Hartford until the subject hit the headlines with the case of Milo Sheff versus William A. O’Neill in 1996.  The case brought attention to the fact that “public school students in the City of Hartford attended schools that were racially, ethnically, and economically isolated in violation of the Connecticut Constitution…”4 With this news brought to the attention of the Supreme Court, stipulations were made to decrease racial separation within schools completely by 2013.  These goals have been redefined after the state did not meet them in 2007, and so in 2008, a new “phase” of stipulations were set.  Some of the new demands include: “the State shall examine the demand for seats in reduced-isolation settings by Hartford-resident minority students based on the number of Hartford-resident minority applicants…” 5 This means that depending on the number of minority students who apply to the Open Choice program, schools must be aware that the number of minority students they accept into the lottery and into the schools reflects the overall number.  Another example of a goal of the new Sheff vs. O’Neill stipulations include:

“If in November of the final year of Phase II [2013-2014], the state is unable to demonstrate its attainment, through reasonable efforts, of the goal of meeting 80% of demand, the parties shall convene to revisit the Comprehensive Management Plan and to determine what steps are necessary to meet the demand standard by the following year.” 6

The various different levels of choice for Hartford District students that are presented on this website in great detail are one of the ways in which the district is appeasing the Sheff case ruling.

Demographics of the Hartford region

The population in Hartford according to the 2010 Census results is 124,775 people.  Out of the total population, 29.8% are white, 38.7% are black, 43.4% are Hispanic or Latino/a, and other races include Asian, American Indian, Native Hawaiian and more.7
Within the Open Choice Program in Hartford, all of the Hartford city schools are included, as well as 28 other districts.  The map below highlights in blue all of the participating areas.

Source: How Does Information Influence Parental Choice? The SmartChoices Project in Hartford, Connecticut8

The “Maps Created with UCONN Magic” page of Jack Dougherty’s On The Line webpage have maps that are beneficial in understanding more about the demographics of Hartford and its surrounding suburbs.  The map below shows the racial makeup of these areas in 2010:

Source: UConn Magic9

The map shows that the majority of areas with a very low population of white individuals are near the city of Hartford in the middle of the map.  As you move towards the outer regions, which are mostly suburbs, the populations become more densely white populated.To better understand some of the other demographics of these districts in Hartford including racial makeup of schools, test scores, the distance of the school from where you live, the SmartChoices website10 helps put all of these categories in one place.  It is unique due to the fact that parents can enter their own address as well as what type of school their child wants to attend, and instantly find the schools near their home.

The map of participating districts as well as the racial makeup map can better show the demographics of people choosing schools is these areas.  The next map will show that in the areas with a very low population of white people, there is a very high concentration of families using the SmartChoices website to research different schools in other areas.

How do demographics affect school choice?

A study by Jack Dougherty and others called “How Does Information Influence Parental Choice? The SmartChoices Project in Hartford, Connecticut”, provides a map indicating where the majority of the SmartChoice patrons were from.  This map is below:

Source: How Does Information Influence Parental Choice? The SmartChoices Project in Hartford, Connecticut11

This grid below shows that the majority of parents searching for alternate schools for their children are from the city of Hartford area rather than suburban areas surrounding Hartford.  This suggests that there is an emphasis on city students going to suburban schools, but not the other way around.

Source: How Does Information Influence Parental Choice? The SmartChoices Project in Hartford, Connecticut12

What’s going on in the media?

NPR “Parents Don’t Always Pick Best Schools”13

In this NPR program on school choice in Hartford, it is very clear that parents in the area are overwhelmed with the amount of choice that Hartford Public Schools offer them.  Jeff Cohen also discusses that parents don’t always make decisions based on school achievement within the state.  He delves a bit deeper into which aspects in choosing schools are the most important.

Watch the Hartford Public Schools “Choose” Campaign commercial!14

This is one of the more recent “Choose” Campaign commercials that are played on local television stations in Hartford to promote choice as well as the desegregation of Hartford Public Schools.

ABOUT THE AUTHORS:

Courtney Chaloff is a senior at Trinity College majoring in Educational Studies with a concentration in learning styles and special education.  She is a Jewish Studies minor and is the Chair of the Student Athlete Advisory Committee as a senior member of the Trinity Varsity Women’s Volleyball team.

Ashley Ardinger is a senior Educational Studies major at Trinity College with a concentration in English Language Learner policy and special education.  She has a minor in Music and is the musical director of Trinity’s oldest acapella group, The Trinity Pipes.

FOOTNOTES:

  1. “SmartChoices: A Digital Guide to Public School Choice in the Greater Hartford Region,” SmartChoices, n.d., http://smartchoices.trincoll.edu/about.html.”
  2. Mark McQuillan, “Public School Choice in Connecticut” (Connecticut Department of Education, 2011 2010), http://www.sde.ct.gov/sde/lib/sde/pdf/equity/choice/choicebooklet1011.pdf.
  3. Mark McQuillan, “Public School Choice in Connecticut” (Connecticut Department of Education, 2011 2010), http://www.sde.ct.gov/sde/lib/sde/pdf/equity/choice/choicebooklet1011.pdf.
  4. Wesley Horton and Richard Blumenthal, “Sheff vs. O’Neill: Stipulation and Proposed Order” (Connecticut Supreme Court, April 4, 2008).
  5. Wesley Horton and Richard Blumenthal, “Sheff vs. O’Neill: Stipulation and Proposed Order” (Connecticut Supreme Court, April 4, 2008).
  6. Wesley Horton and Richard Blumenthal, “Sheff vs. O’Neill: Stipulation and Proposed Order” (Connecticut Supreme Court, April 4, 2008).
  7. “Hartford (city) QuickFacts from the US Census Bureau,” U.S.Census Bureau, 2010, http://quickfacts.census.gov/qfd/states/09/0937000.html.
  8. Jack Dougherty et al., “How does Information Influence Parental Choice?: The SmartChoices Project in Hartford, Connecticut” (Trinity College, 2010).”
  9. “Racial Change in the Hartford Region, 1900-2010,” UConn Magic, 2011, http://magic.lib.uconn.edu/otl/timeslider_racethematic.html.”
  10. “SmartChoices: A Digital Guide to Public School Choice in the Greater Hartford Region,” SmartChoices, n.d., http://smartchoices.trincoll.edu/about.html.
  11. Jack Dougherty et al., “How does Information Influence Parental Choice?: The SmartChoices Project in Hartford, Connecticut” (Trinity College, 2010).”
  12. Jack Dougherty et al., “How does Information Influence Parental Choice?: The SmartChoices Project in Hartford, Connecticut” (Trinity College, 2010).”
  13. Jeff Cohen, “Parents Don’t Always Pick Best Schools,” MP3, Morning Edition (Hartford, CT: National Public Radio, March 23, 2011), http://www.npr.org/2011/03/23/134766860/in-hartford-parents-dont-always-pick-best-schools.
  14. Hartford Public School “Choose” Campaign, n.d., http://www.youtube.com/watch?v=pi_mWizYV8c&feature=related.

Success within Segregation: Jumoke Academy Exposes the Limits of Integration as an Educational Benchmark

Posted on


Photo Credit: Fionnuala Darby Hudgens

In an old Catholic school building, at the end of Blue Hills Avenue in the North End of Hartford, sits Jumoke Academy. The yard surrounding this pre-kindergarten through eighth grade charter school is neat, but without frills. Only a single maroon awning identifies the school by name. A small play structure is squeezed onto the property, which spreads only about a hundred feet from the building. Judging by the old, plain building, high academic success and remarkable student growth might not be the first expectations that come to mind. But on the other side of the walls, a racially and economically isolated urban minority student body is steadily undermining the Connecticut achievement gap. As journalist Stan Simpson explains,

“Remarkable progress in educating poor, urban, ethnic minorities in a state with the widest achievement gap in America makes you take notice.”1

Click to read fully story.Click to read full story.
Freely available at: @hartfordcourant. Hartford, CT: Hartford Courant, 2011, JPEG, Twitter feed, accessed December 2, 2011, http://yfrog.com/h8cxzebtj.

Jumoke Academy has been consistently recognized by ConnCAN as a school success story. In 2011, Jumoke was ranked #5 in the state for Middle School Performance Gains and #3 for African-American school performance.2 Yet according to one of the state’s primary education benchmarks—racial integration—Jumoke is failing. The 1996 decision by the Connecticut Supreme Court in Sheff v. O’Neill established that public schools in Hartford were racially, ethnically, and economically isolated, providing the legal ground for Sheff supporters and educational activists to initiate desegregation efforts in Connecticut education. However, the decision did not specify strategies outlining exactly how to effectively meet the desegregation mandate. As a result of unclear remedies and a tangled web of interdistrict magnet, charter, and traditional public schools, the system of public education in Connecticut has become difficult to navigate. Uncoordinated school choice options, goals, and measures of success have created an atmosphere in which student achievement can easily be overlooked in the quest for racial equality.3 Jumoke Academy, a racially isolated charter school, does not fit into the ideals of the Sheff movement. The student body, while high achieving, is 99.5% minority.4 The extraordinary success achieved at Jumoke Academy highlights one of the most significant shortcomings of the Sheff-based reforms in Hartford schools. By treating desegregation as an end instead of a means, the Sheff v. O’Neill mandates may de-emphasize student achievement, remove vital resources from the Hartford school district, and dismiss the sense of community found in neighborhood schools.

Jumoke Academy was once part of a long list of failing public schools in Hartford, and it remained that way for almost ten years. To stave off closure, Jumoke Academy began what school CEO Michael Sharpe identified as “addressing the barriers to learning of our students.” The majority of Jumoke Academy’s students lived in poverty, forcing the school administration to focus on the basic needs of the children that, until fulfilled, would interfere with students’ focusing on their schoolwork.5 Sharpe discussed how the school started with the basics to set a foundation for success on the Stan Simpson show, a clip of which can be seen below.


Stan Simpson: Urban School Turnaround Pt 2 | 10/23. YouTube Video, 7:20 minutes. Hartford, CT: CT Now, 2011. http://www.youtube.com/watch?v=SdHQtdpGWgg.

Administrators at Jumoke Academy responded to the high needs of their students by offering things like free breakfast and lunch, after-school enrichment programs, and Saturday sessions. By dealing head on with the needs of its students, Jumoke Academy began a steady rise and is now a top performing school within the Hartford district and in the state of Connecticut. The problem for the State in regards to Jumoke Academy is the demographics of the student body. Jumoke Academy does not contribute to the State’s goal of meeting Sheff objectives, making it difficult to evaluate the extent of its success.

Sheff supporters praise the interdistrict magnet schools that have been built or expanded in Hartford since the original 1996 decision. However, in terms of student performance, Jumoke Academy is competitive with even the best magnet schools. Below is a screenshot from the SmartChoices website, with a comparison of Jumoke Academy and several magnet schools. Even though Jumoke Academy clearly “fails” in the racial balance category, it is competitive with other magnet schools in the district in terms of test scores, and in some cases it actually out-performs them.

SmartChoices Comparison: Jumoke Academy with Five Interdistrict Magnet Schools
Click to see larger image.Click to see larger image.
Cities, Suburbs, and Schools Project. “Smart Choices.” Hartford, CT: Trinity College, 2011. http://www.smartchoices.trincoll.edu.

In addition to evidence that racially isolated schools can still be high-performing, the appropriateness of Sheff goals are also questionable in light of the fact that desegregation does not automatically result in higher student performance. The graphs below show the percentage of students at Jumoke Academy and IB Global Magnet achieving proficiency in reading and mathematics on the Connecticut Mastery Test. Despite its full compliance with Sheff desegregation mandates, IB Global Magnet is underperforming when compared to Jumoke Academy.

CMT Score Comparison in Reading and Math: Jumoke Academy with IB Global Magnet
Click to see larger image.Click to see larger image.
“Jumoke Academy and IB Global Magnet Performance Overview.” Hartford, CT: Connecticut Education Data and Research, 2011. http://sdeportal.ct.gov.

Students at Jumoke Academy might be missing some opportunities that can only be offered in integrated schools, but a high quality education is not one of them.

Beyond the fact that Jumoke Academy out-performs some of the magnet schools in Hartford, administrators have caught on to other limitations of Sheff remedies. In many ways, it is not in the long-term interest of the city of Hartford to have its students bused off to suburban schools. In practical terms, the program places a significant burden on Hartford students who have to spend extra time traveling to and from school each day, and who might not get the chance to participate in extracurricular activities because of transportation limitations.6

Click to read fully story.Click to read full story.
Rabe Thomas, Jacqueline. “Increased reimbursements pay off in getting state closer to desegregating Hartford schools.” Hartford Courant, November 24, 2011. http://www.ctmirror.org/story/14609/increased-reimbursements-pay-getting-state-closer-desegregating-hartford-schools.

A drain on the financial resources of Hartford Public Schools is also occurring as a result of Sheff measures. As funding for new magnet school construction dries up, Sheff proponents have switched emphasis to Project Choice, a program that transfers Hartford students to suburban schools. Reimbursement for suburban schools that participate in Project Choice was recently increased from $2500 to $6000 per student in order to entice suburban districts to expand the transfer program.7 Compensating suburban schools for transfer students means that that money is unavailable to city schools, which arguably require the funds more because they have more high-needs students. Former Superintendent Stephen Adamowski believed that expanding Project Choice by 3500 students would mean that six or seven Hartford schools would have to close and that 700 employees would lose their jobs.8 Improving the education quality of Hartford students should not be a zero-sum game, in which one side only wins at the expense of the other. If integration goals are met only by decreasing the resources of students and faculty outside the system, even when those schools have demonstrated high student performance, then it seems as if the fundamental goal of school quality and student achievement is being ignored.

In the 2007 Sheff negotiations, Representative Doug McCrory raised concerns about the direction and focus of the Sheff remedies:

We focus a lot on the desegregation part, but one part we refuse to talk about is the academic achievement of children…I don’t want anyone to think that I’m not a supporter of Sheff…[But] if we can develop some [charter] schools in the Hartford region [that are] 95 percent minority, and those kids are kicking butt on CMTs and the academic levels are high and they’re going to college, I think our children should be in those schools.9

If high-performing schools exist within the city limits, then school administrators should be advertising and promoting those schools. This should not be interpreted as a challenge to Sheff remedies or goals. The Sheff mandate applies to the entire state of Connecticut, so Hartford should not have to bear the burden by emptying its schools and sending all of its money to the suburbs if it can offer effective alternatives.

In more abstract terms, there is also much to be said for being able to attend a quality school in one’s own neighborhood, as opposed to having to commute to a quality school in another town. Students should be able to go to school with their neighbors and to have easy access to after-school activities and the additional resources a school can provide. In defending his reform efforts, Adamowski noted, “What they really want is what every parent in America wants, which is a good school in their own neighborhood.”10 Unlike interdistrict magnet and Project Choice schools, Jumoke Academy serves the community it is located in. It is therefore better positioned to understand and address the unique needs of its students. Pedro Noguera has argued that this sense of community is essential in the education of students in high-needs settings. “Rather than being regarded as hopelessly unfixable, urban public schools, particularly those that serve poor children, must be seen for what they are: the most enduring remnant of the social safety net for poor children in the United States.”11 The success of the students at Jumoke Academy depends on the close attention the school gives to their circumstances. This kind of support might not be available at distant suburban schools, where only a small percentage of the student body is characterized as a high-needs population. Furthermore, neighborhood schools can offer services and support to non-student residents of the area. Allowing local schools to close in the name of integration could be severely detrimental to the entire Hartford community.

Integration is a noble goal, and the Sheff lawyers clearly established that racially isolated schools have inherent challenges. The problem with using Sheff goals to assess a school like Jumoke Academy, however, is that desegregation is still far from being the reality of Hartford schools. The state has invested millions of dollars in Sheff remedies since 1996, but the chances of a student getting to attend an integrated magnet school are still only between five and ten percent.12

Odds of Acceptance to Magnet Schools for 2010-2011 School Year
Click to see larger image.Click to see larger image.
“Hartford-Resident Student RSCO 2010-2011 Magnet School Placement Odds.” Hartford, CT: The CT Mirror, 2011, PDF. http://www.ctmirror.org/sites/default/files/documents/wait%20list.pdf.

As of October 2011, only 32 percent of Hartford students were attending integrated schools.13

Click to read fully story.Click to read full story.
Rabe Thomas, Jacqueline. “With deadline looming, state still far from finish line on integrating Hartford schools.” Hartford Courant, November 21, 2011. http://www.ctmirror.org/story/14578/deadline-looming-state-still-far-finish-line-integrating-hartford-schools.

This means that, almost twelve years after the Sheff lawsuit, approximately 14,700 Hartford minority students remain in isolated school settings. These students will be left behind by any system that uses desegregation as its only measure of success. Policy makers must address the needs of these students even if that means accepting racial isolation for the time being in order to better address the specific needs of the students these isolated schools serve.

An argument could be made that competition for valuable resources is exactly what Hartford schools need. Project Choice and interdistrict magnet schools create competition that pressures neighborhood schools to improve performance in order to retain students and funding. Greater school accountability is one benefit that has come out of increasing school choice efforts to promote desegregation, and this should increase academic standards across the district. In fact, competition is likely one of the reasons for Jumoke Academy’s recent success. Amid whispers of shutting the school down for chronic low performance, officials like Mr. Sharpe changed the school’s structure and focused intently on increasing student performance.

There is great value in school choice and accountability, but the competition should not be so intense that struggling schools do not receive the support they need to improve. The Sheff ideals and remedies should be included in a broader system of school reform, but that system should be comprehensive and include a variety of goals for school quality and academic achievement. While desegregation is undoubtedly a need in Connecticut’s schools, it is not the only characteristic that should be measured or pursued. At least until integration programs have been significantly expanded, resources should be devoted to finding the best way to educate the children left behind by the integration movement. Expanding Sheff remedies at the expense of funding for neighborhood schools will mean that the majority of Hartford’s students will receive a lower quality education, and high-performing schools like Jumoke Academy might lose the financial support they need to continue making strides towards closing the achievement gap.

Integration is a means to an end, not an end itself. The ultimate goal of any education policy should be improving students’ academic achievement, and this goal should not be lost in the battle between competing reform agendas. Jumoke Academy, and many other Hartford Public Schools, has made incredible strides. Students in Jumoke Academy are closing the achievement gap and matching, if not outperforming, their peers in racially balanced settings, and this is what policymakers should be attempting to reproduce. Bruce Douglas, executive director of the Capitol Region Education Council in charge of Hartford’s interdistrict magnet schools, captured this sentiment perfectly: “My attitude is education is so important, I don’t care what school they go to. If it’s a good school, go there.”14


The reform of Hartford schools is an ongoing effort. We encourage you to become part of the debate by contacting policy makers with your comments about city schools, school choice, and desegregation:

Connecticut General Assembly Education Committee
Connecticut State Commissioner of Education
Jumoke Academy


About the Authors:
Fionnuala Darby Hudgens is an Education Studies major at Trinity College in Hartford, CT. Her academic interests lie in communicating a greater understanding of Connecticut’s achievement gap and the overall inequality in the American public education system.

Mary Morr is a senior Public Policy major at Trinity College, concentrating in education policy. She plans to pursue a Master of Social Work and is interested in the intersection of public education and the unique needs of disadvantaged children.


Footnotes:

  1. Stan Simpson, “Charter Lesson: High Goals, Accountability Turn Schools Around,” Hartford Courant, October 28, 2011, http://articles.courant.com/2011-10-28/news/hc-op-simpson-schools-charter-1028-20111028_1_achievement-gap-urban-schools-amistad-academy.
  2. “2011 Top 10 Rankings,” Hartford, CT: ConnCAN, 2011, http://www.conncan.org/sites/default/files/conncan_2011_top_10_lists_final.pdf.
  3. Jack Dougherty, Jesse Wanzer, and Christina Ramsay, “Sheff v. O’Neill: Weak Desegregation Remedies and Strong Disincentives in Connecticut, 1996-2008,” in From the Courtroom to the Classroom: The Shifting Landscape of School Desegregation, edited by Claire E. Smrekar and Ellen B. Goldring, 103-127, Cambridge, MA: Harvard Education Press, 2009.
  4. Jumoke Academy Strategic School Profile 2009-2010,” Hartford, CT: State Department of Education, 2010, www.sde.ct.gov.
  5. Stan Simpson: Urban School Turnaround Pt 1 | 10/23. YouTube Video, 8:52 minutes. Hartford, CT: CT Now, 2011. http://www.youtube.com/watch?v=LQ6eihlBWl8.
  6. Jacqueline Rabe Thomas, “Increased reimbursements pay off in getting state closer to desegregating Hartford schools,” The CT Mirror, November 24, 2011, http://www.ctmirror.org/story/14609/increased-reimbursements-pay-getting-state-closer-desegregating-hartford-schools.
  7. Rabe Thomas, “Increased reimbursements pay off.”
  8. Jacqueline Rabe Thomas, “Officials: Efforts to reduce racial isolation need overhaul,” The CT Mirror, December 8, 2010, http://ctmirror.com/story/8653/officials-efforts-reduce-racial-isolation-need-overhaul.
  9. Connecticut General Assembly, Joint Committee on Education, Ed Committee Hearing Transcript for 06/20/2007, (2007), http://www.cga.ct.gov/2007/eddata/chr/2007ED-00620-R001300-CHR.htm.
  10. Robert A. Frahm, “Ads urging parents to keep children in Hartford schools anger Sheff lawyer,” Hartford Courant, April 29, 2011, http://www.ctmirror.org/story/12413/stay-city-schools-hartford-advises-parents.
  11. Pedro A. Noguera, City Schools and the American Dream, New York: Teachers College Press, 2003.
  12. “Hartford-Resident Student RSCO 2010-2011 Magnet School Placement Odds,” Hartford, CT: The CT Mirror, 2011, PDF, http://www.ctmirror.org/sites/default/files/documents/wait%20list.pdf.
  13. Jacqueline Rabe Thomas, “With deadline looming, state still far from finish line on integrating Hartford schools,” Hartford Courant, November 21, 2011, http://www.ctmirror.org/story/14578/deadline-looming-state-still-far-finish-line-integrating-hartford-schools.
  14. Frahm.