Do Connecticut’s privately-managed charter schools outperform local public school districts?

Posted on

FRPM SCALE SCORE

A few weeks ago, attorney Wendy Lecker asked me in an interview for the Stamford Advocate, “Do Connecticut charter schools outperform district schools?” My answer was, “Not exactly”.

As my Choice Watch report (Cotto & Feder, 2014) demonstrated, charter schools in Connecticut tend to serve a relatively more advantaged group of (mostly) Black and Latinx children including fewer children with disabilities, emerging bilingual children, and children eligible for free and reduced priced meals compared to the students in local public schools in the same cities as the charter schools. As a result, comparing the test results of charter schools with local public schools is like comparing “apples to oranges” because they often serve very different groups of children.

However, using a simple scatterplot chart, it is fairly easy to show that charter schools’ mean test results are not overwhelmingly better when compared with public school districts that have similarly-situated students in terms of a rough income indicator. Other scholars, such as Bruce Baker (2012) at Rutgers University, have constructed scatterplots of income vs. 7th grade math test results to demonstrate similar observations about charter and public schools.

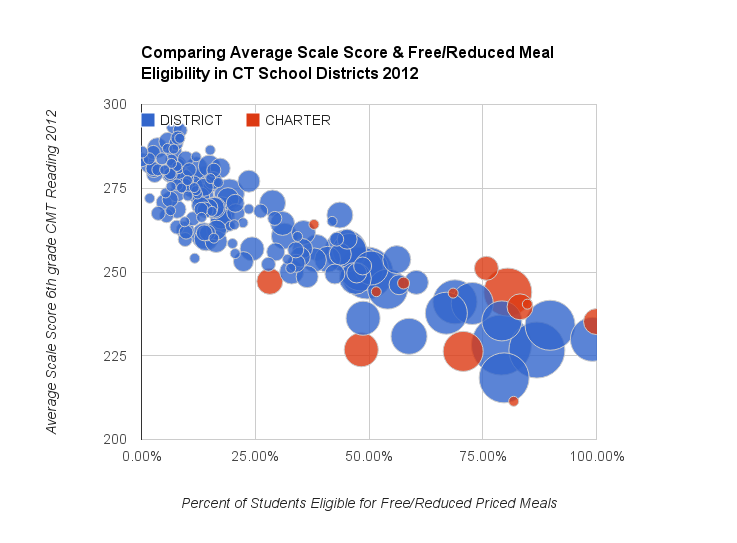
For example, below I constructed an interactive scatterplot that compares 6th grade average scale scores on the CMT reading (2012) versus percentage of children eligible for free and reduced priced meals (FRPM) at the district level (Google sheet data here). This scatterplot data visualization has three major data points. First, each public district and charter school is positioned by the the overall percent FRPM (x-axis). Second, each district is positioned on the y-axis by its mean scale score on 6th grade CMT reading. Third, the size of the dots correspond to the percentage of emerging bilingual children (crudely labeled as “English Language Learners” by the State).

You can scroll over the dots to see the public school district or charter school name and their demographics and test data. Public school districts are in blue dots and charter schools are in red dots. By placing these data points on a scatterplot, we can more easily compare the average test results of districts and charter schools that are similar in terms of district-wide free and reduced meal eligibility. (See the end for notes on limitations of this data and method.)

Source: CT State Department of Education, 2015.

So what does this scatterplot show? Here are some observations:

  • There is a strong negative linear relationship (r= -.869) between this rough income indicator (eligibility for free and reduced priced meals) and average scale score on 6th grade CMT reading. (i.e. as free and reduced priced meal eligibility increases, average reading scores decrease)
  • When compared to similar districts by income, some (4) charter schools appear to have higher than average test results, some (4) have lower than average test results, and some (4) are right in the middle of the pack, or near the average.
  • If charter schools (red dots) had overwhelmingly higher test results, then we would expect more of their average scores to be above the majority of blue dots at their % FRPM level.

Want a closer look?

This second scatterplot chart only compares charter schools with the public school districts where they are located. The same pattern appears.

For example, Bridgeport Public Schools enrolled children that were 99% eligible for FRPM and 12.6% emerging bilingual (ELL). By comparison, all Bridgeport charter schools had higher average scale scores in reading, but lower rates of children eligible for free and reduced priced meals (68-85%) and emerging bilingual students (0-4%). There are exceptions, of course, such as Amistad Academy, which often appears comparable to New Haven Public Schools in terms of %FRPM, %ELL, and higher in average scale score.

And there are examples on the other end of the spectrum. The hypersegregated Stamford charter schools contain larger proportions of Black and Latinx students, those eligible for free/reduced price meals, and those with disabilities compared to the local Stamford public school district. They also appear to be outliers in terms of having very low average scale scores.

Source: CT State Department of Education, 2015.

This test result (“performance”) question is important because it is at the center of claims made about charter schools in Connecticut. The claim that charter schools achieve superior test results as a result of effort, choice, accountability, educational program, governance structure, or some other reason, is frequently cited by charter school lobbyists at the legislature and the CT State Department of Education. 

The simple claim hinges on a statement like this one from a presentation on charter schools by the CT SDE: “Of the 14 charter schools that administered the spring 2013 Connecticut Mastery Test, 12 schools (or 86%) outperformed their host district with their overall SPI.” (CT SDE, 2015) With this statistic, we are left to conclude (or told by the charter school lobby) that charter schools are supposedly excelling compared to local public schools.

The CT SDE presentation (below) offers similar statistics and a chart highlighting some demographics of charter schools versus “alliance” and all other districts, but it does not caution the reader these characteristics could impact test results and comparisons. What the CT SDE and charter school lobbyists are not explicitly telling you in these claims is that charter schools often serve a relatively more advantaged group of Black and Latinx children compared to the local public schools where they are located and these children are likely to do relatively better on standardized tests because standardized tests favor more advantaged groups of people. Therefore, it is not a fair comparison to directly compare charter schools test results to those in local public school districts without some sort of modification (e.g. compare districts similar in income levels and/or other characteristics).

Charter Renewal Process, SBE Overview | April 6, 2015

Screen Shot 2016-12-27 at 9.42.55 PMSource: CT State Department of Education, 2015.

The State is comparing “apples (public schools) to oranges (charter schools)” on test results, despite knowing (it’s their data!) that the massive demographic differences that make these simple comparisons very misleading. To be sure, the CT SDE assists in making these same simplistic comparisons of test results between urban and suburban schools districts as well. This type of misleading comparison of test results persists and is now baked into the CT State Department of Education policy on reviewing and renewing charter schools.

All of this is meant to say that using blunt comparisons of test results does not prove that charter schools or public schools are any better or worse than each other in terms of academic performance, or any other characteristic. Instead, I am arguing that comparisons of test results must account for often massive demographic differences. This was a major recommendation of the Choice Watch (2014) report. I would also add, as I’ve written elsewhere, that school performance should be thought of in broader terms than standardized tests. Simple comparisons of standardized test results will always favor schools with barriers to entry and participation (e.g. charter, magnet, vocational technical schools) and advantaged districts where families must buy or rent homes to attend local schools (affluent, suburban).

So when somebody asks the question, “Do Connecticut charter schools outperform public school districts?”, how will you answer?


Notes: 1. There are many other and better ways of analyzing this question about charter and public schools. My observations above are based on scatterplot charts that crudely “account” for income (FRPM). 2. The data above comes from 2012, the most recent data in which average scale score on State tests can be compared to other demographic information. 3. Finally, the %FRPM applies to all grades in the district, while the average scale score applies to all students in a district in the 6th grade taking the standard version of the test. The State does not share %FRPM data at the grade level. 4. Average scale scores are a better measure of central tendency compared to percent of students at proficient or goal because scale scores do not lump students status levels at arbitrary cut points.


Updated (with video): Got something to say about charter schools? NAACP Special Hearing on Charter Schools – New Haven, CT – Saturday, Dec. 3, 1 – 6 p.m.

Posted on

Update: The full video of the NAACP special hearing is here. (Source: W4 News, AccessTV.org) Also see parent letters regarding charter school issues to the NAACP Task Force on Quality Education.

In October, the NAACP (national conference) passed a resolution that called for a moratorium on privately-managed, publicly funded charter schools. The resolution was fairly moderate and listed the charter school policies that must change in order for any future NAACP support. This weekend, the NAACP will host the first in a series of national meetings about this resolution for a charter school moratorium.  The first meeting will be in New Haven, CT. (details below)

The fact that charter schools are racially segregated (mostly Black students), have punitive disciplinary policies, and siphon funds away from public schools to privately-managed charter schools were among the reasons for a charter school moratorium. (You can read more about why here.) In a press release, the NAACP stated:

We are calling for a moratorium on the expansion of the charter schools at least until such time as:
 (1) Charter schools are subject to the same transparency and accountability standards as public schools
 (2) Public funds are not diverted to charter schools at the expense of the public school system
 (3) Charter schools cease expelling students that public schools have a duty to educate and
 (4) Charter schools cease to perpetuate de facto segregation of the highest performing children from those whose aspirations may be high but whose talents are not yet as obvious.

In addition to this resolution, the NAACP created a National Task Force for Quality Education. This Task Force will hold a special hearing (one of many around the country) focusing on this resolution for a charter school moratorium on Saturday, December 3, 2016, from 1 – 6 p.m. in New Haven, CT at the Omni Hotel, 155 Temple Street. (directions here)

Sign-up happens at 1 p.m. and the hearing begins at 2 p.m. 3 minute speaking limit per person. You can read the full details in the flyer below. The meeting appears to be open to the public.

NAACPspecialhearing

You can be sure, the charter school lobby that advocates for more privately-managed schools and funding for only those charter schools will be there.

Will public education advocates show up?

Want to learn more about charter schools in Connecticut? Here’s a little something to get started:

Why did the NAACP propose a moratorium on charter schools? Will the Connecticut NAACP support this moratorium on charter schools? (Updated)

Posted on

Update: The NAACP Board has approved the moratorium on new charter schools. Read the Tweet below and a statement from the NAACP here.

Screen Shot 2016-10-15 at 12.31.12 PM

Continue reading Why did the NAACP propose a moratorium on charter schools? Will the Connecticut NAACP support this moratorium on charter schools? (Updated)

English Language Learners Underrepresented in Connecticut’s Choice Schools

Posted on

Background

Just over two decades ago, in 1989, Elizabeth Horton Sheff and a coalition of plaintiffs filed a lawsuit against Connecticut’s then-governor, William O’Neill, calling attention to the stark segregation and inequality that characterized Hartford Area schools at the time. Now, twenty-six years later, almost half of the students in Connecticut’s capital city attend integrated schools.[i] When plaintiffs returned to the courtroom in 2003, they walked out with a new settlement that set even higher standards for racial integration within schools. In addition to expanding participation in the “Open Choice” system (previously known as “Project Concern”), this legislation called for the expansion of public charters and themed magnet schools in the Hartford Area. Connecticut’s system has been hugely successful in its attempts to promote racial integration within schools: In a recent Civil Rights Project report, Gary Orfield, a Distinguished Professor of Education, Law and Political Science and Urban Planning at UCLA, referred to it as “the only successful effort to produce a new legal framework to deal with the reality of metropolitan segregation.”[ii],[iii] Despite this undeniable progress, though, the system has been far from inclusive of the state’s large population of nonnative English speakers and has a long way to go before reaching its goal of equal educational opportunity for all students.[iv],[v] In order for English Language Learners (ELL) to be fairly represented in Connecticut’s choice schools, two things must happen. First and foremost, the state must implement recommended policy changes designed to address the insufficiency of bilingual education programs in these schools. Secondly, they should support the establishment of new dual-language magnet schools.

ELL Disparity in Choice Schools: What the Numbers Say

The number of English Language Learners in Connecticut is immense, and it is growing rapidly. In 2011-2012, over 30,000 students were considered to be ELL (and it is likely that this is an underestimate), making up 5.4% of the state’s total student population.[vi] Despite their large presence, ELL students are severely underrepresented in Connecticut’s public choice schools (specifically in magnet, charter and technical schools). According to the Choice Watch Report released in 2014 by policy analysts Robert Cotto and Kenny Feder, in the 2011-2012 school year, 76% of public charters, 64% of magnets, and 56% of technical schools in the Greater Hartford Area (GHA) had substantially lower enrollment percentages of ELL students than the local, traditional public schools in their districts.[vii] Unfortunately, choice schools have not become any more inclusive in the years since their report. These schools still enroll significantly lower percentages of ELL students than the traditional public schools in their respective districts.

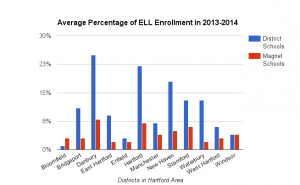
ELL Enrollment in Magnet Schools, by District (2013-2014)

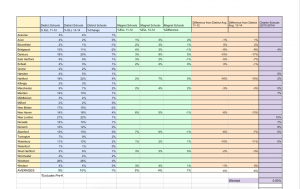
Comparison of ELL enrollment numbers from 2011-2012 to 2013-2014 in Hartford Area magnet schools, as compared to their district averages. Charter school data included as was available.
Fig. 1: Comparison of ELL enrollment numbers from 2011-2012 to 2013-2014 in Hartford Area magnet schools, as compared to their district averages. Charter school data included as was available. [ix]

When our Choice Seminar at Wesleyan updated the Choice Watch Report with 2013-2014 data provided to us by the CT State Department of Education (based on 13 of the 28 GHA districts – as much data as was available), we found that ELL students are still underrepresented, and especially so in magnet schools. ELL students are no more represented in magnet schools than they were two years ago, and in some cases, they are less so. Currently, the average ELL student-composition across the GHA is 10% for district schools, but only 4% for magnets. To identify districts that did a better job in encouraging ELL enrollment, it is most useful to look at the relative proportions within a particular district, rather than looking at the GHA as a whole. Danbury (25%), Hartford (22%), New London (22%) and Windham (26%) district schools enroll the highest percentages of ELL students. Danbury magnet schools, however, enroll 17% fewer ELL students than their district counterparts; this represents the largest enrollment gap in the GHA.[viii] Charter and technical schools also tend to under-enroll ELL students. The average composition of ELL students among Bridgeport’s four public charter schools is only 4%.[ix]

Fig. 2: ELL Enrollment in Hartford Area magnet schools as compared to district averages, in 2013-2014. [ix]
Based on the numbers, it would seem that ELL students are, to say the least, restricted, when it comes to school choice.  As of February 2015, less than half of the state’s students requiring ELL support were actually receiving it (approximately 9,897 out of 22,914), and this does not come without consequences.[x] ELL students in Connecticut are, on average, five grade levels below their non-ELL classmates.[xi] Based on 8th grade math and reading scores, the achievement gap for ELL students in Connecticut is the worst and second-to-worst in the country.[xii] The amelioration of this achievement gap relies in part on changes to existing policies regarding bilingual education programs.


Solution #1: Policy Changes

This past January, a group of concerned stakeholders including teachers, administrators, and members of the Latino and Asian communities held a forum to address the lack of resources for bilingual education. Luckily, a few legislators listened to their suggestions and worked with them to write what because known as House Bill 6835, “An Act Concerning English Language Learners.”[xiii] Aiming to better educational opportunities for ELL students in Connecticut, the original bill proposed changes to existing policies. Two recommendations, in particular, are ones that, if passed, could potentially have a significant and positive impact on the under enrollment of ELL students at choice schools.

As it stands, the Bilingual Education Statute (Section 10-17e-j) dictates that only schools with twenty or more ELL students must offer a program of bilingual education. [xiv] Furthermore, those twenty students have to speak the same foreign language. [xiv] On top of that, to say bilingual education is loosely defined in the statutes would be a gross understatement. H.B. 6835’s originally called for a decrease in this threshold, from twenty students to six. Based on 2013-2014 enrollment data, this decreased minimum would lead to the new bilingual education programs in at least forty additional choice schools in the Hartford Area. Soon after the stakeholders met, the Joint Education Commission held a public hearing, at which much dissent was expressed over the proposed amendments, in part due to financial concerns. Interestingly enough, Connecticut only spends a mere $1.9 million dollars on over 30,000 ELL students every year: a number that comes out to around $50-$60 per student.[xv] Nonetheless, in the resulting substitution bill, the proposed amendment to lower the twenty-person minimum had been thrown out.

The Connecticut Statute for Education also limits the amount of time that a student is allowed to spend in a bilingual education program to just thirty months – If the student is within 30 months of high school graduation, they are not eligible for the services at all. A second, important feature of H.B. 6835, that did make it into the substitution bill, was a two-fold increase in this time frame, from thirty to sixty months. Just last week, on April 29th, the Appropriations Committee of the Connecticut General Assembly voted 36 to 20 in favor of the Joint Education Committee’s substitution bill. [xvi] H.B. 6835 still has a long way to go – it must pass through both House and Senate before its fate is sealed.


Solution #2: Dual Language Magnet Schools  

According to Cotto and Feder’s 2012 Report, in the 2011-2012 school year, just under 50,000 students were enrolled in one of Connecticut’s choice programs – the majority of these students attended one of 63 interdistrict magnet schools.[xvii] In Connecticut, it’s easy enough to find a magnet school with just about any theme – there are magnet schools for arts, for aerospace and engineering, and for global citizenship. In New Haven, there is a very special magnet school called the John C. Daniels School (JDS). JDS is a dual-language immersion school, and with 19% of its students being ELL, a proportion one percentage point higher than the district average and more than twice that of any other interdistrict magnet school in New Haven.[xviii] So, if only 19% of students at JDS are ELL, then who are the other 81%? They are native English speakers, and they have chosen to go to JDS to learn Spanish. At JDS, half of classes are taught in English, and half are taught in Spanish. Then, in middle school, students can elect to take either Mandarin or continue on with Spanish.[xix]

View of main entrance at John C. Daniels Interdistrict Magnet School of International Communication.
Fig. 3: View of main entrance at John C. Daniels Interdistrict Magnet School of International Communication. [xxi]
JDS students consistently score above the district average in every subject, with very few exceptions. In 2013, 97% of sixth graders passed the math section of the CMT, putting them ahead of not only their district, but the entire state of Connecticut.[xx] JDS is not the only dual-language schools in Connecticut – the Dual Language and Arts Magnet Middle School in in Waterford, and the Regional Multicultural Magnet School in New London have also been both popular and successful. More dual-language magnet schools should be built, and the preexisting ones should be used as models. Dual-language instruction has been shown to contribute to a child’s cognitive development, language skills, career readiness and general global awareness.[xxi] A 2013 “Feasibility Study of Two-Way Language Programs,” led by the Superintendent of Hartford Public Schools, revealed widespread community and business support, and even potential state interest and funding.

With the creation of more bilingual education schools comes the problem of staffing. Some consider the state’s stringent certification requirements for bilingual education teachers to be one of the biggest barriers to serving the needs of the state’s large (and growing) ELL student population. To become certified in bilingual education, a teacher must go to through a fifth year of schooling. However, once certified, they are not paid any more than regular teachers. The state also does not recognize out-of-state certification – only teachers who received their bilingual education certificates in the state of Connecticut are eligible to teach. A bill that is currently on the senate calendar, Bill 1102, addresses these stipulations. If it passes, establishing more of these themed-magnets will become a more feasible prospect: more teachers mean more programs in more schools, and more options for ELL students.


Looking Forward

Both key policy changes originally proposed in H.B. 6835 could have made many more schools practical choices for ELL students. The suggestion for the extension of the time maximum for bilingual education programs that still remains in the bill’s text is not an insignificant one. Not only could it enhance learning opportunities for students already enrolled in these programs, but it could also serve as a potential justification for the creation of new, dual-language magnet schools, if their documented success will not suffice as persuasion, since they would be providing dual-language instruction over four-or-more years. Connecticut’s choice schools should be more than just options for ELL students: they should be sensible options, at the very least. I am neither a policy analyst nor an expert in education, but I do believe in evidence, and right now the evidence suggests that something must be done.


[i] Rabe Thomas, J. (2013, November 26). Nearly half the students from Hartford now attend integrated schools. Retrieved May 3, 2015, from http://ctmirror.org/nearly-half students-hartford-now-attend-integrated-schools/.

[iii] Rabe Thomas, J. (2013, November 26). Nearly half the students from Hartford now attend integrated schools. Retrieved May 3, 2015, from http://ctmirror.org/nearly-half students-hartford-now-attend-integrated-schools/.

[iv] See, Plurality Opinion of the State Supreme Court, Connecticut Coalition for Justice in Education Funding vs. Rell. March, 2009. Available at http://ccjef.org/litigation.

[v] How and Miller. Inequality in ELL-Enrollment at District versus Magnet Schools in the Greater Hartford Area. March, 2015. https://docs.google.com/document/d/1n0kDYiXIWSq17hSQl5aW8ecmKwZb6J-3PhHsdfHkffg/edit

[vi] Hartford Public Schools. Two-Way Language Program Feasibility Study, January 3, 2013. http://www.achievehartford.org/upload/files/DualLanguageDiscussion—20130124123318926.pdf.

[vii] Cotto, R. & Feder, K. (2014). Choice Watch: Diversity and Access in Connecticut’s School Choice Programs, (p. 17). Connecticut Voices for Children. New Haven, CT.

[viii] Ibid.

[ix] Miller, C. & How, H. (2015, March 6). “Inequality in ELL-Enrollment at District versus Magnet Schools in the Greater Hartford Area. Available at https://docs.google.com/document/d/1n0kDYiXIWSq17hSQl5aW8ecmKwZb6J-3PhHsdfHkffg/edit.

[x] Zimmerman, E. (Director) (2015, February 25). Testimony before the Education Committee on Proposed S.B. No. 944 and H.B. 6835. Commission on Children. Lecture conducted from State of Connecticut General Assembly, Hartford, Connecticut. Available at http://www.cga.ct.gov/2015/eddata/tmy/2015SB-00944-R000225-Elaine%20Zimmerman,%20CT%20Commission%20on%20Children-TMY.PDF.

[xi] ConnCan: Connecticut Maintains Worst-in-the-Nation Achievement Gap. (2013, November 8). Retrieved May 3, 2015, from http://www.conncan.org/media-room/press-releases/2013-11-conncan-connecticut-maintains-worst-in-the-nation-ac.

[xii] Boesner, B. (2013, November 7). 2013 NAEP Snapshot [PDF document]. Retrieved from http://webiva-downton.s3.amazonaws.com/696/f8/4/1276/4/2013_ConnCAN_NAEP_Snapshot.pdf.

[xv] Rodriguez, O. (2015, May 1). Background Information on H.B. 6835 [Telephone interview].

[xvi] Appropriations Committee – Vote Tally Sheet. (2015, April 29). Retrieved May 3, 2015, from http://www.cga.ct.gov/2015/TS/H/2015HB-06835-R00APP-CV33-TS.htm.

[xvii] Cotto, R. & Feder, K. (2014). Choice Watch: Diversity and Access in Connecticut’s School Choice Programs. Connecticut Voices for Children. New Haven, CT.

[xviii] MacDonald, A. (2015, March 6). “Angus’s Exercise D.” Available at https://docs.google.com/document/d/1CPD_xgiWQFqSIPHbyRDXEHWRZ_ti61Qv8P-FhuXRxwE/edit.

[xx] John C. Daniels School Test Scores – New Haven County, CT. (n.d.). Retrieved May 3, 2015, from http://www.realtor.com/local/John-C-Daniels-School_New-Haven_New-Haven-County_CT/test-scores